New Semester
Started
Get
50% OFF
Study Help!
--h --m --s
Claim Now
Question Answers
Textbooks
Find textbooks, questions and answers
Oops, something went wrong!
Change your search query and then try again
S
Books
FREE
Study Help
Expert Questions
Accounting
General Management
Mathematics
Finance
Organizational Behaviour
Law
Physics
Operating System
Management Leadership
Sociology
Programming
Marketing
Database
Computer Network
Economics
Textbooks Solutions
Accounting
Managerial Accounting
Management Leadership
Cost Accounting
Statistics
Business Law
Corporate Finance
Finance
Economics
Auditing
Tutors
Online Tutors
Find a Tutor
Hire a Tutor
Become a Tutor
AI Tutor
AI Study Planner
NEW
Sell Books
Search
Search
Sign In
Register
study help
mathematics
mathematical applications for the management
Mathematical Interest Theory 3rd Edition Leslie Jane, James Daniel, Federer Vaaler - Solutions
Divide into groups of four or five students and collect past results from a state lottery. Such results are often available on websites for individual state lotteries. Use the methods of Section 11-1 to test the claim that the numbers are selected in such a way that all possible outcomes are
Divide into groups of four or five students and collect past results from a state lottery. Such results are often available on websites for individual state lotteries. Use the methods of Section 11-1 to test the claim that the numbers are selected in such a way that all possible outcomes are
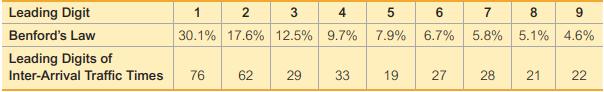
Divide into groups of four or five students. The Chapter Problem noted that according to Benford’s law, a variety of different data sets include numbers with leading (first) digits that follow the distribution shown in the table below. Collect original data and use the methods of Section 11-1 to
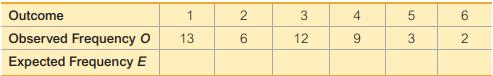
Use Statdisk, Minitab, Excel, StatCrunch, a TI-83>84 Plus calculator, or any other software package or calculator capable of generating equally likely random digits between 0 and 9 inclusive. Generate 5000 digits and record the results in the accompanying table. Use a 0.05 significance level to
When designing cars and aircraft, we must consider the forward grip reach of women. Women have normally distributed forward grip reaches with a mean of 686 mm and a standard deviation of 34 mm (based on anthropometric survey data from Gordon, Churchill, et al.).a. If a car dashboard is positioned
Listed below are repair costs (in dollars) for cars crashed at 6 mi/h in full-front crash tests and the same cars crashed at 6 mi/h in full-rear crash tests (based on data from the Insurance Institute for Highway Safety). The cars are the Toyota Camry, Mazda 6, Volvo S40, Saturn Aura, Subaru
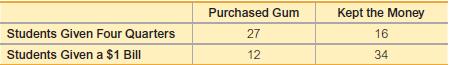
In a study of the “denomination effect,” 150 women in China were given either a single 100 yuan bill or a total of 100 yuan in smaller bills. The value of 100 yuan is about $15. The women were given the choice of spending the money on specific items or keeping the money. The results are
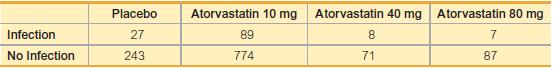
Lipitor is the trade name of the drug atorvastatin, which is used to reduce cholesterol in patients. (Until its patent expired in 2011, this was the largest-selling drug in the world, with annual sales of $13 billion.) Adverse reactions have been studied in clinical trials, and the table below
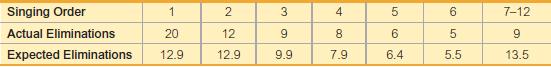
Contestants on the TV show American Idol competed to win a singing contest. At one point, the website WhatNotToSing.com listed the actual numbers of eliminations for different orders of singing, and the expected number of eliminations was also listed. The results are in the table below. Use a 0.05
The chi-square distribution is continuous, whereas the test statistic used in this section is discrete. Some statisticians use Yates’s correction for continuity in cells with an expected frequency of less than 10 or in all cells of a contingency table with two rows and two columns. With Yates’s
A x2 test involving a 2 × 2 table is equivalent to the test for the difference between two proportions, as described in Section 9-1. Using the claim and table in Exercise 9 “Four Quarters the Same as $1?” verify that the x2 test statistic and the z test statistic (found from the test of
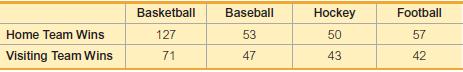
Winning team data were collected for teams in different sports, with the results given in the table on the top of the next page (based on data from “Predicting Professional Sports Game Outcomes from Intermediate Game Scores,” by Copper, DeNeve, and Mosteller, Chance, Vol. 5, No. 3–4). Use a
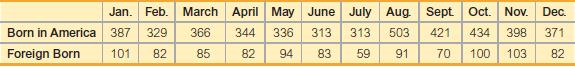
In his book Outliers, author Malcolm Gladwell argues that more American-born baseball players have birth dates in the months immediately following July 31 because that was the age cutoff date for nonschool baseball leagues. The table below lists months of births for a sample of American-born
A study of people who refused to answer survey questions provided the randomly selected sample data shown in the table below (based on data from “I Hear You Knocking But You Can’t Come In,” by Fitzgerald and Fuller, Sociological Methods and Research, Vol. 11, No. 1). At the 0.01 significance
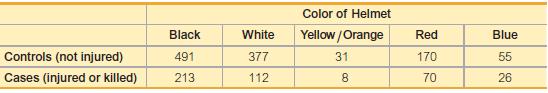
A case-control (or retrospective) study was conducted to investigate a relationship between the colors of helmets worn by motorcycle drivers and whether they are injured or killed in a crash. Results are given in the table below (based on data from “Motorcycle Rider Conspicuity and Crash Related
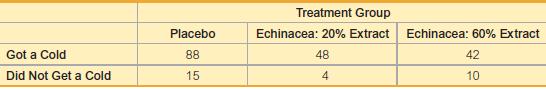
In a clinical trial of the effectiveness of echinacea for preventing colds, the results in the table below were obtained (based on data from “An Evaluation of Echinacea Angustifolia in Experimental Rhinovirus Infections,” by Turner et al., New England Journal of Medicine, Vol. 353, No. 4). Use
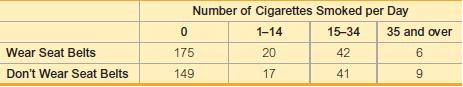
A study of seat belt users and nonusers yielded the randomly selected sample data summarized in the given table (based on data from “What Kinds of People Do Not Use Seat Belts?” by Helsing and Comstock, American Journal of Public Health, Vol. 67, No. 11). Test the claim that the amount of
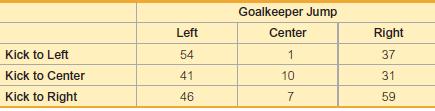
In soccer, serious fouls in the penalty box result in a penalty kick with one kicker and one defending goalkeeper. The table below summarizes results from 286 kicks during games among top teams (based on data from “Action Bias Among Elite Soccer Goalkeepers: The Case of Penalty Kicks,” by
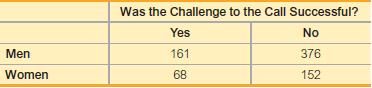
The table below shows results since 2006 of challenged referee calls in the U.S. Open. Use a 0.05 significance level to test the claim that the gender of the tennis player is independent of whether the call is overturned. Do players of either gender appear to be better at challenging calls?
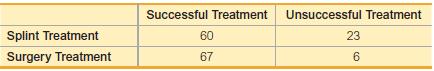
A randomized controlled trial was designed to compare the effectiveness of splinting versus surgery in the treatment of carpal tunnel syndrome. Results are given in the table below (based on data from “Splinting vs. Surgery in the Treatment of Carpal Tunnel Syndrome,” by Gerritsen et al.,
The accompanying TI-83/84 Plus calculator display results from the hypothesis test described in Exercise 1. Assume that the hypothesis test requirements are all satisfied. Identify the test statistic and the P-value (expressed in standard form and rounded to three decimal places), and then state
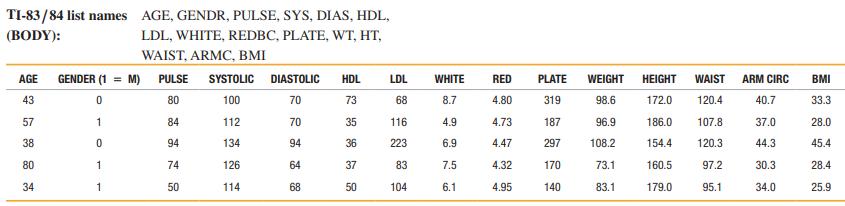
Refer to Data Set 1 “Body Data” in Appendix B for the heights of females.a. Enter the observed frequencies in the table above.b. Assuming a normal distribution with mean and standard deviation given by the sample mean and standard deviation, use the methods of Chapter 6 to find the probability
The author recorded the leading digits of the sizes of the electronic document files for the current edition of this book. The leading digits have frequencies of 55, 25, 17, 24, 18, 12, 12, 3, and 4 (corresponding to the leading digits of 1, 2, 3, 4, 5, 6, 7, 8, and 9, respectively). Using a 0.05
Frequencies of leading digits from IRS tax files are 152, 89, 63, 48, 39, 40, 28, 25, and 27 (corresponding to the leading digits of 1, 2, 3, 4, 5, 6, 7, 8, and 9, respectively, based on data from Mark Nigrini, who provides software for Benford data analysis). Using a 0.05 significance level, test
Exercise 21 lists the observed frequencies of leading digits from amounts on checks from seven suspect companies. Here are the observed frequencies of the leading digits from the amounts on the most recent checks written by the author at the time this exercise was created: 83, 58, 27, 21, 21, 21,
Exercise 21 lists the observed frequencies of leading digits from amounts on checks from seven suspect companies. Here are the observed frequencies of the leading digits from the amounts on the most recent checks written by the author at the time this exercise was created: 83, 58, 27, 21, 21, 21,
When working for the Brooklyn district attorney, investigator Robert Burton analyzed the leading digits of the amounts from 784 checks issued by seven suspect companies. The frequencies were found to be 0, 15, 0, 76, 479, 183, 8, 23, and 0, and those digits correspond to the leading digits of 1, 2,
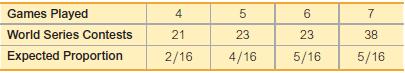
The table below lists the numbers of games played in 105 Major League Baseball (MLB) World Series. This table also includes the expected proportions for the numbers of games in a World Series, assuming that in each series, both teams have about the same chance of winning. Use a 0.05 significance
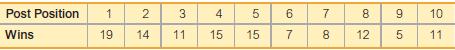
The table below lists the frequency of wins for different post positions through the 141st running of the Kentucky Derby horse race. A post position of 1 is closest to the inside rail, so the horse in that position has the shortest distance to run. (Because the number of horses varies from year to
Repeat Exercise 11 using these observed frequencies for police calls received during the month of March: Monday (208); Tuesday (224); Wednesday (246); Thursday (173); Friday (210); Saturday (236); Sunday (154). What is a fundamental error with this analysis?Data From Exercise 11:The police
The police department in Madison, Connecticut, released the following numbers of calls for the different days of the week during a February that had 28 days: Monday (114); Tuesday (152); Wednesday (160); Thursday (164); Friday (179); Saturday (196); Sunday (130). Use a 0.01 significance level to
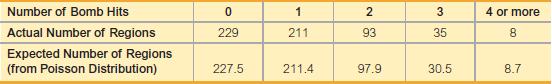
In analyzing hits by V-1 buzz bombs in World War II, South London was subdivided into regions, each with an area of 0.25 km2. Shown below is a table of actual frequencies of hits and the frequencies expected with the Poisson distribution. (The Poisson distribution is described in Section 5-3.) Use
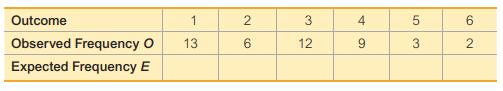
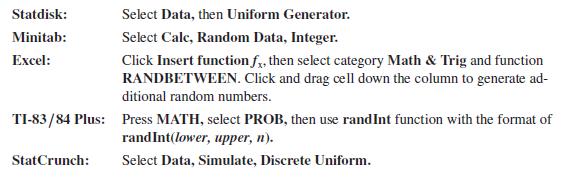
The author drilled a hole in a die and filled it with a lead weight, then proceeded to roll it 200 times. Here are the observed frequencies for the outcomes of 1, 2, 3, 4, 5, and 6, respectively: 27, 31, 42, 40, 28, and 32. Use a 0.05 significance level to test the claim that the outcomes are not
The accompanying Statdisk results shown in the margin are obtained from the data given in Exercise 1. What should be concluded when testing the claim that the leading digits have a distribution that fits well with Benford’s law?Data From Exercise 1:The table below lists leading digits of 317
Divide into groups of three or four people. Investigate the relationship between two variables by collecting your own paired sample data and using the methods of this chapter to determine whether there is a significant linear correlation. Also identify the regression equation and describe a
Divide into groups of three or four people. Appendix B includes many data sets not yet included in examples or exercises in this chapter. Search Appendix B for a pair of variables of interest, then investigate correlation and regression. State your conclusions and try to identify practical
Divide into groups of 8 to 12 people. Record the pulse rate of each group member while he or she is seated. Then record the pulse rate of each group member while he or she is standing. Is there a relationship between sitting and standing pulse rate? If so, what is it?
Use a ruler as a device for measuring reaction time. One person should suspend the ruler by holding it at the top while the subject holds his or her thumb and forefinger at the bottom edge, ready to catch the ruler when it is released. Record the distance that the ruler falls before it is caught.
Divide into groups of 8 to 12 people. For each group member, measure the person’s height and also measure his or her navel height, which is the height from the floor to the navel. Is there a correlation between height and navel height? If so, find the regression equation with height expressed in
Divide into groups of 8 to 12 people. For each group member, measure the person’s height and also measure his or her navel height, which is the height from the floor to the navel. Is there a correlation between height and navel height? If so, find the regression equation with height expressed in
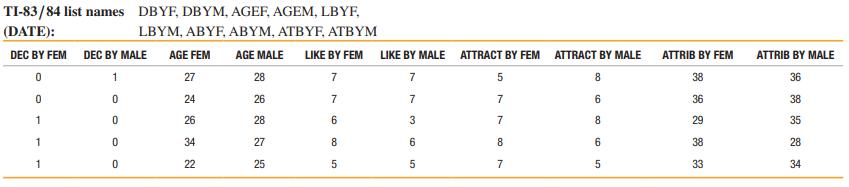
Data Set 18 “Speed Dating” in Appendix B includes data from 199 dates. Due to the large size of this data set, the data are available at www.TriolaStats.com. Download the data set and proceed to investigate correlations between pairs of variables using the data in the 5th, 7th, and 9th columns,
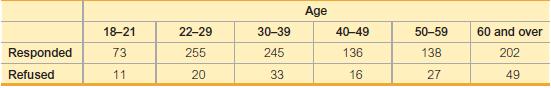
Based on the data from Cumulative Review Exercise 7, assume that ages of moviegoers are normally distributed with a mean of 35 years and a standard deviation of 20 years.a. What is the percentage of moviegoers who are younger than 30 years of age?b. Find P25, which is the 25th percentile.c. Find
Construct a 95% confidence interval estimate of the mean sunspot number. Write a brief statement interpreting the confidence interval.Listed below are annual high values of the Dow Jones Industrial Average (DJIA) and annual mean sunspot numbers for eight recent years. A sunspot number is a measure
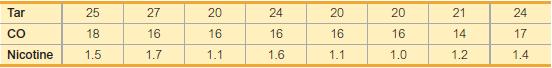
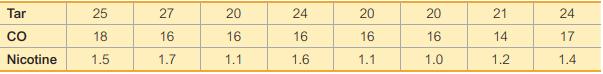
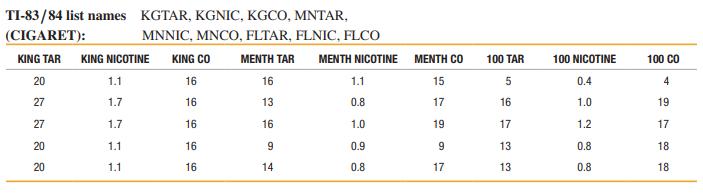
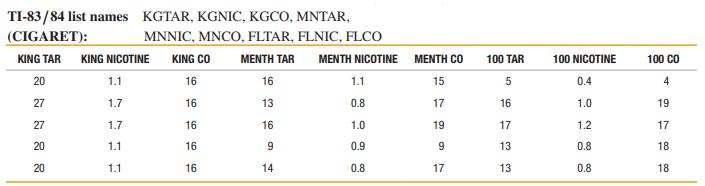
Use the sample data given in Review Exercise 1 “Cigarette Tar and Nicotine.”a. Find the multiple regression equation with the response (y) variable of amount of nicotine and predictor (x) variables of amounts of tar and carbon monoxide.b. Identify the value of the multiple coefficient of
Refer to the table of data given in Exercise 1 and use the amounts of nicotine and carbon monoxide (CO).a. Construct a scatterplot using nicotine for the x scale, or horizontal axis. What does the scatterplot suggest about a linear correlation between amounts of nicotine and carbon monoxide?b. Find
In addition to the value of R2, another measurement used to assess the quality of a model is the sum of squares of the residuals. Recall from Section 10-2 that a residual is the difference between an observed y value and the value of y predicted from the model, which is denoted as ŷ. Better
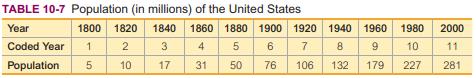
In 1965, Intel cofounder Gordon Moore initiated what has since become known as Moore’s law: The number of transistors per square inch on integrated circuits will double approximately every 18 months. In the table below, the first row lists different years and the second row lists the number of
Listed below are mean annual temperatures (°C) of the earth for each decade, beginning with the 1880s. Find the best model and then predict the value for 2090– 2099. Comment on the result.Construct a scatterplot and identify the mathematical model that best fits the given data. Assume that the
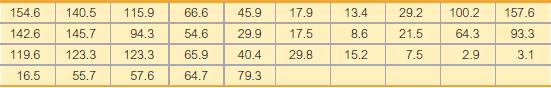
Listed below in order by row are annual sunspot numbers beginning with 1980. Is the best model a good model? Carefully examine the scatterplot and identify the pattern of the points. Which of the models fits that pattern?Construct a scatterplot and identify the mathematical model that best fits the
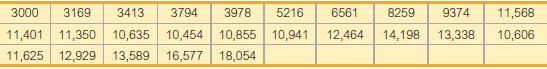
Listed on the top of the next page in order by row are the annual high values of the Dow Jones Industrial Average for each year beginning with 1990. Find the best model and then predict the value for the year 2014 (the last year listed). Is the predicted value close to the actual value of
The table lists different amounts (metric tons) of the explosive TNT and the corresponding value measured on the Richter scale resulting from explosions of the TNT.Construct a scatterplot and identify the mathematical model that best fits the given data. Assume that the model is to be used only for
The table lists the value y (in dollars) of $1000 deposited in a certificate of deposit at Bank of New York (based on rates currently in effect).Construct a scatterplot and identify the mathematical model that best fits the given data. Assume that the model is to be used only for the scope of the
The table lists the value y (in dollars) of $1000 deposited in a certificate of deposit at Bank of New York (based on rates currently in effect).Construct a scatterplot and identify the mathematical model that best fits the given data. Assume that the model is to be used only for the scope of the
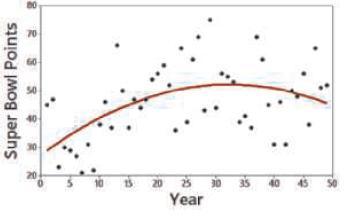
The accompanying graph plots the numbers of points scored in each Super Bowl to the last Super Bowl at the time of this writing. The graph of the quadratic equation that best fits the data is also shown in red. What feature of the graph justifies the value of R2 = 0.255 for the quadratic model?
In Exercise 2, the quadratic model results in R2 = 0.255. Identify the percentage of the variation in Super Bowl points that can be explained by the quadratic model relating the variable of year and the variable of points scored. What does the result suggest about the usefulness of the quadratic
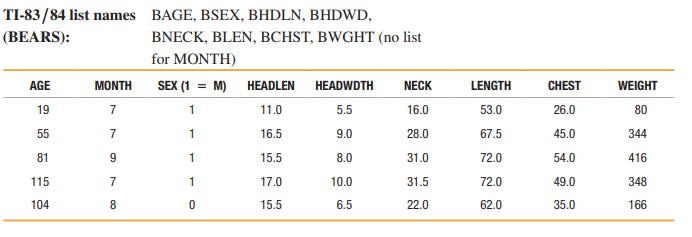
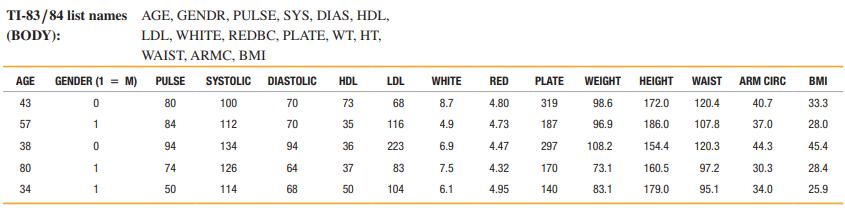
Refer to Data Set 9 “Bear Measurements” in Appendix B and use the sex,age, and weight of the bears. For sex, let 0 represent female and let 1 represent male. Letting the response (y) variable represent weight, use the variable of age and the dummy variable of sex to find the multiple regression
Refer to Data Set 9 “Bear Measurements” in Appendix B and use the sex,age, and weight of the bears. For sex, let 0 represent female and let 1 represent male. Letting the response (y) variable represent weight, use the variable of age and the dummy variable of sex to find the multiple regression
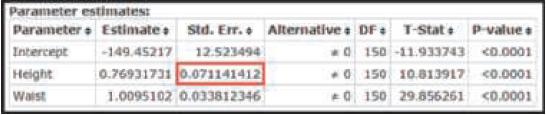
A confidence interval for the regression coefficient β1 is expressed aswhereThe critical t score is found using n - (k + 1) degrees of freedom, where k, n, and sb1 are described in Exercise 17. Using the sample data from Example 1, n = 153 and k = 2, so df = 150 and the critical t scores are ±
If the coefficient β1 has a nonzero value, then it is helpful in predicting the value of the response variable. If β1 = 0, it is not helpful in predicting the value of the response variable and can be eliminated from the regression equation. To test the claim that β1 = 0 use the test statistic t
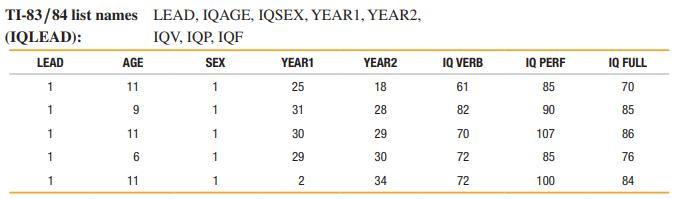
Refer to Data Set 7 “IQ and Lead” in Appendix B and find the best regression equation with IQ FULL (full IQ score) as the response (y) variable. Use predictor variables of IQ VERB (verbal IQ score) and IQ PERF (performance IQ score). Why is this equation best? Based on these results, can we
Repeat the preceding exercise using the sample data from the Menthol cigarettes listed in Data Set 13 “Cigarette Contents” in Appendix B.Refer to the indicated data set in Appendix B and use technology to obtain results.Data Set 13: Cigarette Contents Data are from 75 cigarettes (first five
Refer to Data Set 13 “Cigarette Contents” in Appendix B and use the tar, nicotine, and CO amounts for the cigarettes that are 100 mm long, filtered, nonmenthol, and nonlight (the last set of measurements). Find the best regression equation for predicting the amount of nicotine in a cigarette.
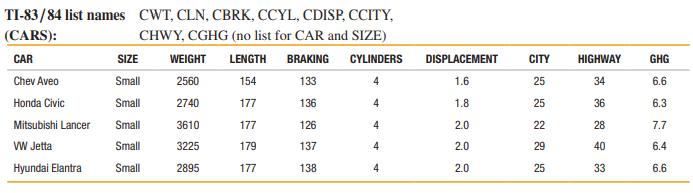
A Honda Civic weighs 2740 lb, it has an engine displacement of 1.8 L, and its highway fuel consumption is 36 mi/gal. What is the best predicted value of the city fuel consumption? Is that predicted value likely to be a good estimate? Is that predicted value likely to be very accurate?Refer to the
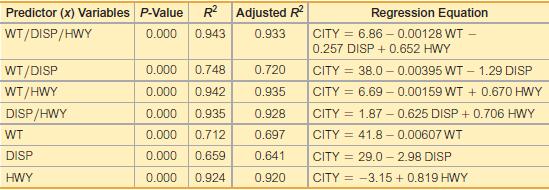
Which regression equation is best for predicting city fuel consumption? Why?Refer to the accompanying table, which was obtained using the data from 21 cars listed in Data Set 20 “Car Measurements” in Appendix B. The response (y) variable is CITY (fuel consumption in mi / gal). The predictor (x)
If exactly two predictor (x) variables are to be used to predict the city fuel consumption, which two variables should be chosen? Why?Refer to the accompanying table, which was obtained using the data from 21 cars listed in Data Set 20 “Car Measurements” in Appendix B. The response (y) variable
If only one predictor (x) variable is used to predict the city fuel consumption, which single variable is best? Why?Refer to the accompanying table, which was obtained using the data from 21 cars listed in Data Set 20 “Car Measurements” in Appendix B. The response (y) variable is CITY (fuel
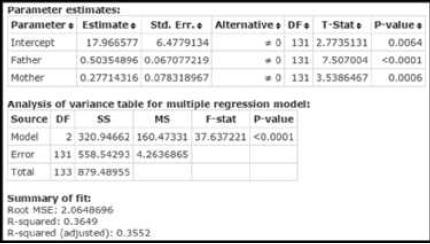
Should the multiple regression equation be used for predicting the height of a son based on the height of his father and mother? Why or why not?We want to consider the correlation between heights of fathers and mothers and the heights of their sons. Refer to the StatCrunch display and answer the
Identify the multiple regression equation that expresses the height of a son in terms of the height of his father and mother.We want to consider the correlation between heights of fathers and mothers and the heights of their sons. Refer to the StatCrunch display and answer the given questions or
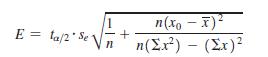
Example 1 in this section illustrated the procedure for finding a prediction interval for an individual value of y. When using a specific value x0 for predicting the mean of all values of y, the confidence interval is as follows:whereThe critical value ta/2 is found with n - 2 degrees of freedom.
The table below lists overhead widths (cm) of seals measured from photographs and the weights (kg) of the seals (based on “Mass Estimation of Weddell Seals Using Techniques of Photogrammetry,” by R. Garrott of Montana State University). For the prediction interval, use a 99% confidence level
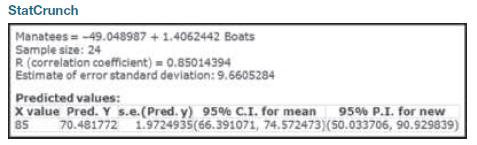
Using x = 85 (for 850,000 registered boats), what is the single value that is the best predicted number of manatee fatalities resulting from encounters with boats?Refer to the display obtained by using the paired data consisting of Florida registered boats (tens of thousands) and numbers of manatee
What percentage of the total variation in manatee fatalities can be explained by the linear correlation between registered boats and manatee fatalities?Refer to the display obtained by using the paired data consisting of Florida registered boats (tens of thousands) and numbers of manatee deaths
Use the information provided in the display to determine the value of the linear correlation coefficient. Is there sufficient evidence to support a claim of a linear correlation between numbers of registered boats and numbers of manatee deaths from encounters with boats?Refer to the display
Using the heights and weights described in Exercise 1, a height of 180 cm is used to find that the predicted weight is 91.3 kg, and the 95% prediction interval is (59.0 kg, 123.6 kg). Write a statement that interprets that prediction interval. What is the major advantage of using a prediction
Using Data Set 1 “Body Data” in Appendix B, if we let the predictor variable x represent heights of males and let the response variable y represent weights of males, the sample of 153 heights and weights results in se = 16.27555 cm. In your own words, describe what that value of se
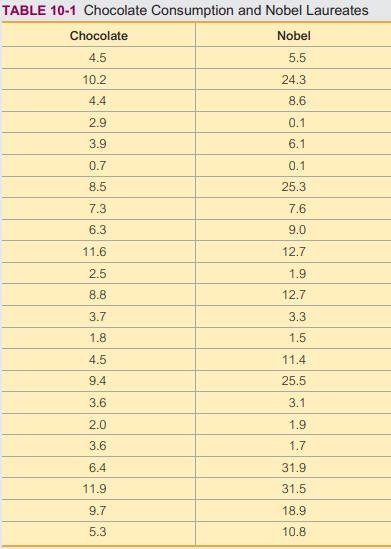
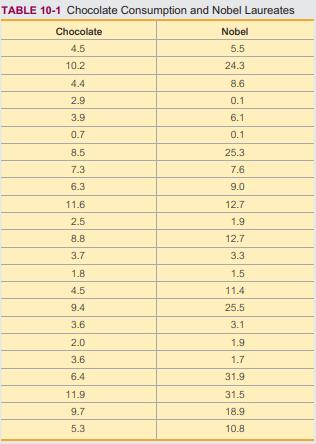
According to the least-squares property, the regression line minimizes the sum of the squares of the residuals. Refer to the data in Table 10-1.a. Find the sum of squares of the residuals.b. Show that the regression equation ŷ = -3 + 2.5x results in a larger sum of squares of residuals.Table 10-1:
According to the least-squares property, the regression line minimizes the sum of the squares of the residuals. Refer to the data in Table 10-1.a. Find the sum of squares of the residuals.b. Show that the regression equation ŷ = -3 + 2.5x results in a larger sum of squares of residuals.Table 10-1:
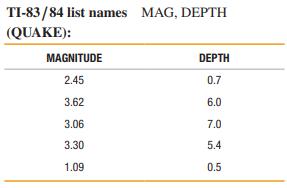
Refer to Data Set 21 “Earthquakes” in Appendix B and use the depths (x) and magnitudes (y) from the earthquakes. Find the best predicted magnitude of an earthquake with a depth of 5 km.In each case, find the regression equation, letting the first variable be the predictor (x) variable. Find the
Refer to Data Set 21 “Earthquakes” in Appendix B and use the depths (x) and magnitudes (y) from the earthquakes. Find the best predicted magnitude of an earthquake with a depth of 5 km.In each case, find the regression equation, letting the first variable be the predictor (x) variable. Find the
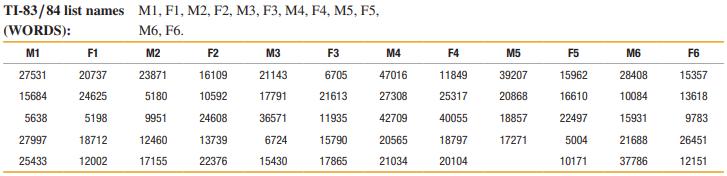
Refer to Data Set 24 “Word Counts” in Appendix B and use the word counts measured from men (x) and women (y) in couple relationships listed in the first two columns of Data Set 24. Find the best prediction for the number of words spoken by a female, given that her male partner speaks 16,000
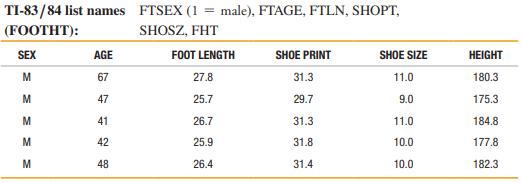
Repeat Exercise 18 using the foot lengths and heights of the 19 males from Data Set 2 “Foot and Height.”In each case, find the regression equation, letting the first variable be the predictor (x) variable. Find the indicated predicted values following the prediction procedure summarized in
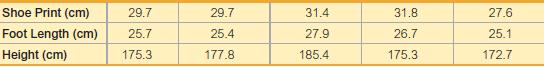
Repeat Exercise 17 using the shoe print lengths and heights of the 19 males from Data Set 2 “Foot and Height.”Exercise 17:Use the shoe print lengths and heights to find the best predicted height of a male who has a shoe print length of 31.3 cm. Would the result be helpful to police crime scene
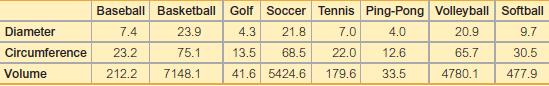
Using the diameter/volume data from the preceding exercise, find the best predicted volume of a marble with a diameter of 1.50 cm. How does the result compare to the actual volume of 1.8 cm3?In each case, find the regression equation, letting the first variable be the predictor (x) variable. Find
Using the diameter/volume data from the preceding exercise, find the best predicted volume of a marble with a diameter of 1.50 cm. How does the result compare to the actual volume of 1.8 cm3?In each case, find the regression equation, letting the first variable be the predictor (x) variable. Find
Using the diameter/volume data from the preceding exercise, find the best predicted volume of a marble with a diameter of 1.50 cm. How does the result compare to the actual volume of 1.8 cm3?In each case, find the regression equation, letting the first variable be the predictor (x) variable. Find
Using the diameter/circumference data, find the best predicted circumference of a marble with a diameter of 1.50 cm. How does the result compare to the actual circumference of 4.7 cm?
Using the diameter/circumference data, find the best predicted circumference of a marble with a diameter of 1.50 cm. How does the result compare to the actual circumference of 4.7 cm?
Using the listed width/weight data, find the best predicted weight of a seal if the overhead width measured from a photograph is 2 cm. Can the prediction be correct? If not, what is wrong?
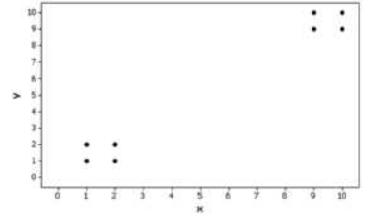
Refer to the Minitab-generated scatterplot given in Exercise 12 of Section 10-1 on page 485.a. Using the pairs of values for all 8 points, find the equation of the regression line.b. Using only the pairs of values for the 4 points in the lower left corner, find the equation of the regression
Refer to the Minitab-generated scatterplot given in Exercise 12 of Section 10-1 on page 485.a. Using the pairs of values for all 8 points, find the equation of the regression line.b. Using only the pairs of values for the 4 points in the lower left corner, find the equation of the regression
Refer to the Minitab-generated scatterplot given in Exercise 12 of Section 10-1 on page 485.a. Using the pairs of values for all 8 points, find the equation of the regression line.b. Using only the pairs of values for the 4 points in the lower left corner, find the equation of the regression
Refer to the Minitab-generated scatterplot given in Exercise 12 of Section 10-1 on page 485.a. Using the pairs of values for all 8 points, find the equation of the regression line.b. Using only the pairs of values for the 4 points in the lower left corner, find the equation of the regression
Refer to the Minitab-generated scatterplot given in Exercise 12 of Section 10-1 on page 485.a. Using the pairs of values for all 8 points, find the equation of the regression line.b. Using only the pairs of values for the 4 points in the lower left corner, find the equation of the regression
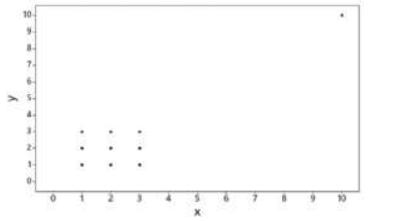
Refer to the Minitab-generated scatterplot given in Exercise 11 of Section 10-1 on page 485.a. Using the pairs of values for all 10 points, find the equation of the regression line.b. After removing the point with coordinates (10, 10), use the pairs of values for the remaining 9 points and find the
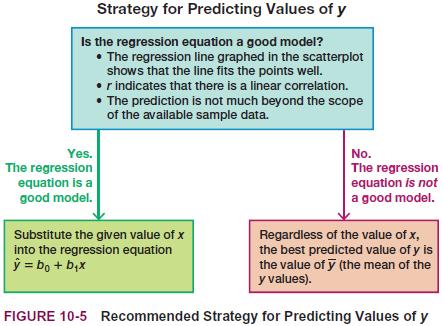
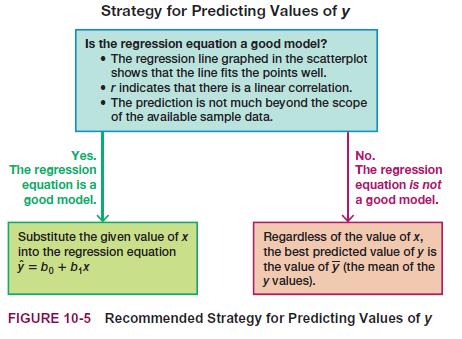
For 30 recent Academy Award ceremonies, ages of Best Supporting Actors (x) and ages of Best Supporting Actresses (y) are recorded. The 30 paired ages yield x̅ = 52.1 years, y̅ = 37.3 years, r = 0.076, P-value = 0.691, and ŷ = 34.4 + 0.0547x. Find the best predicted value of ŷ (age of Best
For 30 recent Academy Award ceremonies, ages of Best Supporting Actors (x) and ages of Best Supporting Actresses (y) are recorded. The 30 paired ages yield x̅ = 52.1 years, y̅ = 37.3 years, r = 0.076, P-value = 0.691, and ŷ = 34.4 + 0.0547x. Find the best predicted value of ŷ (age of Best
Table A-6 lists critical values of r for selected values of n and a. More generally, critical r values can be found by using the formula where the t value is found from the table of critical t values (Table A-3) assuming a twotailed case with n - 2 degrees of freedom. Use the formula for r given
In addition to testing for a linear correlation between x and y, we can often use transformations of data to explore other relationships. For example, we might replace each x value by x2 and use the methods of this section to determine whether there is a linear correlation between y and x2. Given
In addition to testing for a linear correlation between x and y, we can often use transformations of data to explore other relationships. For example, we might replace each x value by x2 and use the methods of this section to determine whether there is a linear correlation between y and x2. Given
Listed below are the overhead widths (cm) of seals measured from photographs and the weights (kg) of the seals (based on “Mass Estimation of Weddell Seals Using Techniques of Photogrammetry,” by R. Garrott of Montana State University). The purpose of the study was to determine if weights of
Showing 100 - 200
of 2634
1
2
3
4
5
6
7
8
9
10
11
12
13
14
15
Last
Step by Step Answers