New Semester
Started
Get
50% OFF
Study Help!
--h --m --s
Claim Now
Question Answers
Textbooks
Find textbooks, questions and answers
Oops, something went wrong!
Change your search query and then try again
S
Books
FREE
Study Help
Expert Questions
Accounting
General Management
Mathematics
Finance
Organizational Behaviour
Law
Physics
Operating System
Management Leadership
Sociology
Programming
Marketing
Database
Computer Network
Economics
Textbooks Solutions
Accounting
Managerial Accounting
Management Leadership
Cost Accounting
Statistics
Business Law
Corporate Finance
Finance
Economics
Auditing
Tutors
Online Tutors
Find a Tutor
Hire a Tutor
Become a Tutor
AI Tutor
AI Study Planner
NEW
Sell Books
Search
Search
Sign In
Register
study help
mathematics
precalculus
Thomas Calculus Early Transcendentals 13th Edition Joel R Hass, Christopher E Heil, Maurice D Weir - Solutions
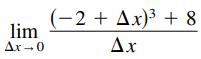
The limit represents f′(c) for a function f and a number c. Find f and c. lim Δr - 0 (-2 + Δx) + 8 Δε
Sketch a graph of a function whose derivative is zero at exactly two points. Explain how you found the answer.
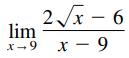
The limit represents f′(c) for a function f and a number c. Find f and c. 2√x-6 lim x 9 x 9
Find d2y/dx2 implicitly in terms of x and y.x2 y − 2 = 5x + y
Find the derivative of the trigonometric function.y = sin(3x2 + cos x)
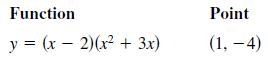
(a) Find an equation of the tangent line to the graph of the function at the given point,(b) Use a graphing utility to graph the function and its tangent line at the point, and(c) Use the tangent feature of a graphing utility to confirm your results. Function y = (x-2)(x² + 3x) Point (1,-4)
A function f is symmetric with respect to the origin. Is f′ necessarily symmetric with respect to the origin? Explain.
Find the derivative of the trigonometric function.y = cos(5x + csc x)
Find the slope of the graph of the function at the given point. Use the derivative feature of a graphing utility to confirm your results.
Find d2y/dx2 implicitly in terms of x and y.7xy + sin x = 2
Use a computer algebra system to find the derivative of the function. f(x) = COS X 1 - sin x
Find the derivative of the trigonometric function.y = sin√cot 3 x
The tangent line to the graph of y = h(x) at the point (−1, 4) passes through the point (3, 6). Find h(−1) and h′(−1).
Find d2y/dx2 implicitly in terms of x and y.3xy − 4 cos x = −6
Find the derivative of the trigonometric function.y = cos√sin(tan x)
(a) Find an equation of the tangent line to the graph of the function at the given point,(b) Use a graphing utility to graph the function and its tangent line at the point, and f(x) = tan² x, (-¹) 4
Use a computer algebra system to find the derivative of the function. Then use the utility to graph the function and its derivative on the same set of coordinate axes. Describe the behavior of the function that corresponds to any zeros of the graph of the derivative.y = cos x + 1 / x
Find the slope of the graph of the function at the given point. Use the derivative feature of a graphing utility to confirm your results.y = √x2 + 8x, (1, 3)
Find the slope of the graph of the function at the given point. Use the derivative feature of a graphing utility to confirm your results.f(x) = 5(x3 − 2)−1 , (−2, −1 /2)
Consider the equation x4 = 4(4x2 − y2).(a) Use a graphing utility to graph the equation.(b) Find and graph the four tangent lines to the curve for y = 3.(c) Find the exact coordinates of the point of intersection of the two tangent lines in the first quadrant.
Find the second derivative of the function. f(x) = 1 11x - 6
(a) Find an equation of the tangent line to the graph of the function at the given point,(b) Use a graphing utility to graph the function and its tangent line at the point, andf(x) = √2x2 − 7, (4, 5)
(a) Find an equation of the tangent line to the graph of the function at the given point,(b) Use a graphing utility to graph the function and its tangent line at the point, andy = (4x3 + 3)2, (−1, 1)
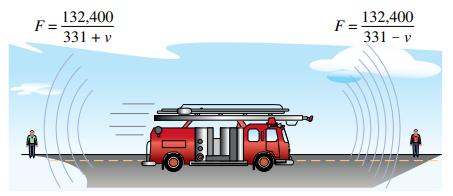
The frequency F of a fire truck siren heard by a stationary observer iswhere ±v represents the velocity of the accelerating fire truck in meters per second (see figure). Find the rate of change of F with respect to v when(a) The fire truck is approaching at a velocity of 30 meters per second (use
(a) Find an equation of the tangent line to the graph of the function at the given point,(b) Use a graphing utility to graph the function and its tangent line at the point, andf(x) = sin 8x, (π, 0)
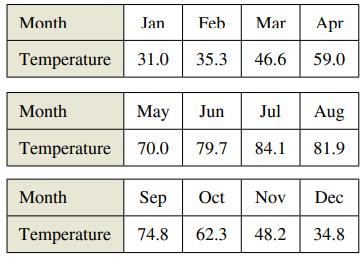
The normal daily maximum temperatures T (in degrees Fahrenheit) for Chicago, Illinois, are shown in the table. (a) Use a graphing utility to plot the data and find a model for the data of the form T(t) = a + b sin(ct − d) where T is the temperature and t is the time in months, with t = 1
Determine the point(s) in the interval (0, 2) at which the graph of f(x) = 2 cos x + sin 2x has a horizontal tangent.
Find the second derivative of the function.f(x) = 5(2 − 7x)4
Prove each differentiation rule.(a) d/dx [sec x] = sec x tan x(b) d/dx [csc x] = −csc x cot x(c) d/dx [cot x] = −csc2 x
Find the second derivative of the function.f(x) = sin x2
Evaluate the second derivative of the function at the given point. Use a computer algebra system to verify your result.f(x) = cos x2, (0, 1)
The linear and quadratic approximations of a function f at x = a are P1(x) = f′(a)(x − a) + f (a) and P2(x) = 1/2 f ″(a)(x − a)2 + f′(a)(x − a) + f (a).(a) Find the specified linear and quadratic approximations of f,(b) Use a graphing utility to graph f and the approximations,(c)
Find the second derivative of the function.f(x) = x2 + 7x − 4
The relationship between f and g is given. Describe the relationship between f′ and g′.(a) g(x) = f(3x)(b) g(x) = f(x2)
Find the given higher-order derivative.f ″(x) = −sin x, f (8) (x)
Consider the function f(x) = sin x, where is a constant.(a) Find the first-, second-, third-, and fourth-order derivatives of the function.(b) Verify that the function and its second derivative satisfy the equation f ″(x) + 2 f(x) = 0.(c) Use the results of part (a) to write general rules for the
Determine whether the statement is true or false. If it is false, explain why or give an example that shows it is false.The slope of the function f(x) = sin ax at the origin is a.
Determine whether the statement is true or false. If it is false, explain why or give an example that shows it is false.If y is a differentiable function of u, and u is a differentiable function of x, then y is a differentiable function of x.
Determine whether the statement is true or false. If it is false, explain why or give an example that shows it is false.If f′(c) and g′(c) are zero and h(x) = f(x)g(x), then h′(c) = 0.
Determine whether the statement is true or false. If it is false, explain why or give an example that shows it is false.The second derivative represents the rate of change of the first derivative.
Graph the lower half of the circle defined by the equation x2 + 2x = 4 + 4y - y2.
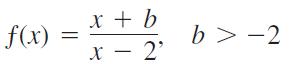
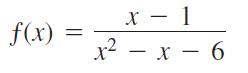
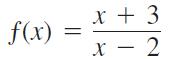
Gives a formula for a function y = ƒ(x). In each case, find ƒ -1(x) and identify the domain and range of ƒ -1. As a check, show that ƒ(ƒ -1(x)) = ƒ -1(ƒ(x)) = x.and constant f(x) x + b x - 2' b> -2
Express the area and circumference of a circle as functions of the circle’s radius. Then express the area as a function of the circumference.
Sketch the given curves together in the appropriate coordinate plane and label each curve with its equation.y = 2x, y = 4x, y = 3-x, y = (1/5)x
Use graphing software to determine which of the given viewing windows displays the most appropriate graph of the specified function.ƒ(x) = x4 - 7x2 + 6xa. [-1, 1] by [-1, 1] b. [-2, 2] by [-5, 5]c. [-10, 10] by [-10, 10] d. [-5, 5] by [-25, 15]
A point P in the first quadrant lies on the parabola y = x2. Express the coordinates of P as functions of the angle of inclination of the line joining P to the origin.
Sketch the given curves together in the appropriate coordinate plane and label each curve with its equation.y = 2-t and y = -2t
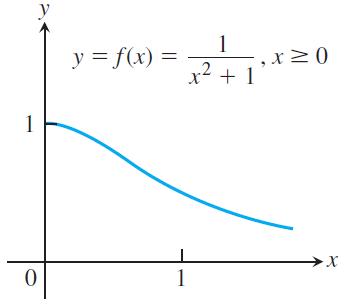
Shows the graph of a function y = ƒ(x). Copy the graph and draw in the line y = x. Then use symmetry with respect to the line y = x to add the graph of ƒ-1 to your sketch. (It is not necessary to find a formula for ƒ -1.) Identify the domain and range of ƒ-1. 1 0 y = f(x): 1 x2 x² + 1 ≥0 >X
Use graphing software to determine which of the given viewing windows displays the most appropriate graph of the specified function.ƒ(x) = 5 + 12x - x3a. [-1, 1] by [-1, 1]b. [-5, 5] by [-10, 10]c. [-4, 4] by [-20, 20] d. [-4, 5] by [-15, 25]
Determine whether the graph of the function is symmetric about the y-axis, the origin, or neither.y = x1/5
Find an appropriate graphing software viewing window for the given function and use it to display its graph. The window should give a picture of the overall behavior of the function. There is more than one choice, but incorrect choices can miss important aspects of the function. f(x) = xV9 - x²
Use the laws of exponents to simplify the expression. 44.2 43.7
Sketch the given curves together in the appropriate coordinate plane and label each curve with its equation.y = ex and y = 1/ex
Find an appropriate graphing software viewing window for the given function and use it to display its graph. The window should give a picture of the overall behavior of the function. There is more than one choice, but incorrect choices can miss important aspects of the function.ƒ(x) = x4 -
Sketch the shifted exponential curve.y = 2x - 1 and y = 2-x - 1
Find an appropriate graphing software viewing window for the given function and use it to display its graph. The window should give a picture of the overall behavior of the function. There is more than one choice, but incorrect choices can miss important aspects of the function.ƒ(x) = x5 - 5x4 + 10
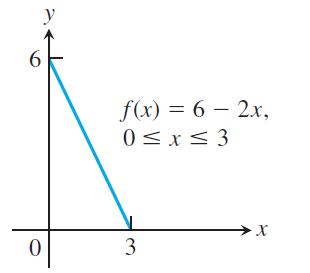
Shows the graph of a function y = ƒ(x). Copy the graph and draw in the line y = x. Then use symmetry with respect to the line y = x to add the graph of ƒ-1 to your sketch. (It is not necessary to find a formula for ƒ -1.) Identify the domain and range of ƒ-1. y 0 f(x) = 6 - 2x, 0≤x≤3 3 X
Sketch the shifted exponential curve.y = 1 - ex and y = 1 - e-x
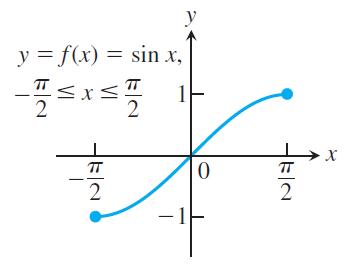
Shows the graph of a function y = ƒ(x). Copy the graph and draw in the line y = x. Then use symmetry with respect to the line y = x to add the graph of ƒ-1 to your sketch. (It is not necessary to find a formula for ƒ -1.) Identify the domain and range of ƒ-1. y = f(x) = sin x, T ||
Use the laws of exponents to simplify the expression.162 · 16-1.75
Graph the function What symmetry does the graph have? f(x) = V1 - x²,0 ≤ x ≤ 1.
Find an appropriate graphing software viewing window for the given function and use it to display its graph. The window should give a picture of the overall behavior of the function. There is more than one choice, but incorrect choices can miss important aspects of the function.y = 2x - 3x2/3
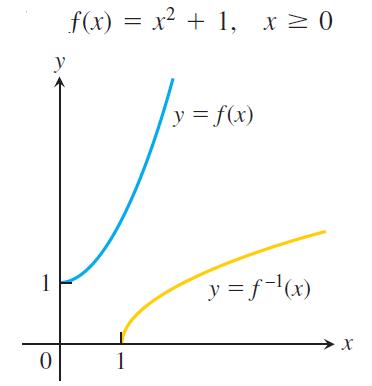
Gives a formula for a function y = ƒ(x) and shows the graphs of ƒ and ƒ -1. Find a formula for ƒ -1 in each case. - y 0 0 = x 'I + zx = (x)ƒ 1 y = f(x) y = f-¹(x) Xx
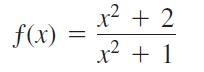
Find an appropriate graphing software viewing window for the given function and use it to display its graph. The window should give a picture of the overall behavior of the function. There is more than one choice, but incorrect choices can miss important aspects of the function. x + 3 x + 2 = y
Find an appropriate graphing software viewing window for the given function and use it to display its graph. The window should give a picture of the overall behavior of the function. There is more than one choice, but incorrect choices can miss important aspects of the function.y = 5x2/5 - 2x
Find the (a) Domain and (b) Range. y: 1-91
Find an appropriate graphing software viewing window for the given function and use it to display its graph. The window should give a picture of the overall behavior of the function. There is more than one choice, but incorrect choices can miss important aspects of the function.y = | x2 - 1|
Find an appropriate graphing software viewing window for the given function and use it to display its graph. The window should give a picture of the overall behavior of the function. There is more than one choice, but incorrect choices can miss important aspects of the function. f(x) || 2 x² X
Suppose that ƒ and g are both odd functions defined on the entire real line. Which of the following (where defined) are even? odd?a. ƒg b. ƒ3 c. ƒ(sin x) d. g(sec x) e. |g|
Find the domain and range for each of the function. g(t) = V1 + 3 t
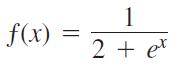
Find the domain and range for each of the function. f(x) 1 2 + et
Find an appropriate graphing software viewing window for the given function and use it to display its graph. The window should give a picture of the overall behavior of the function. There is more than one choice, but incorrect choices can miss important aspects of the function. f(x) = x - 1 x -
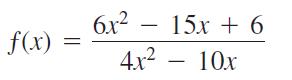
Find an appropriate graphing software viewing window for the given function and use it to display its graph. The window should give a picture of the overall behavior of the function. There is more than one choice, but incorrect choices can miss important aspects of the function. f(x) = 6x² - 15x +
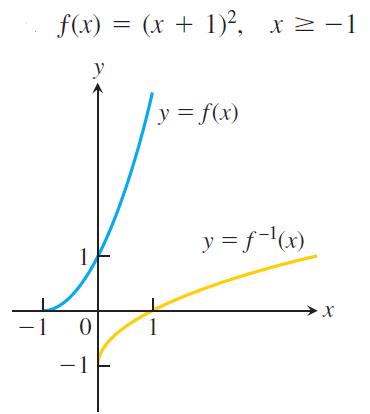
Gives a formula for a function y = ƒ(x) and shows the graphs of ƒ and ƒ -1. Find a formula for ƒ -1 in each case. - 1 f(x) = (x + 1)², x ≥ −1 y 0 - 1 /y = f(x) 1 y = f-¹(x) X
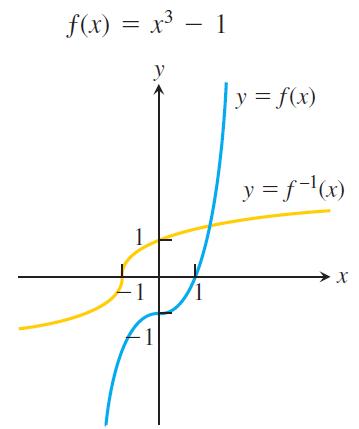
Gives a formula for a function y = ƒ(x) and shows the graphs of ƒ and ƒ -1. Find a formula for ƒ -1 in each case. f(x) = x³ - 1 1 1 y -1 y = f(x) y = f-¹(x) → X
Find the (a) Domain and (b) Range.y = | x | - 2
Find the (a) Domain and (b) Range.y = 2e-x - 3
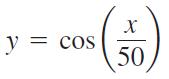
Find an appropriate graphing software viewing window for the given function and use it to display its graph. The window should give a picture of the overall behavior of the function. There is more than one choice, but incorrect choices can miss important aspects of the function. y = COS X 50
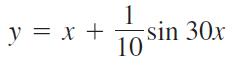
Find an appropriate graphing software viewing window for the given function and use it to display its graph. The window should give a picture of the overall behavior of the function. There is more than one choice, but incorrect choices can miss important aspects of the function. y = x + 1 19 10 sin
Find the (a) Domain and (b) Range.y = 2sin (3x + π) - 1
Use graphs to find approximate solution.2x = 5
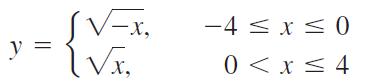
Find the (a) Domain and (b) Range. -X, y = {√ ₁² -4 ≤ x ≤0 0 ≤ x ≤ 4
Find an appropriate graphing software viewing window for the given function and use it to display its graph. The window should give a picture of the overall behavior of the function. There is more than one choice, but incorrect choices can miss important aspects of the function.y = sin 250x
Gives a formula for a function y = ƒ(x). In each case, find ƒ -1(x) and identify the domain and range of ƒ -1. As a check, show that ƒ(ƒ -1(x)) = ƒ -1(ƒ(x)) = x.ƒ(x) = x5
Gives a formula for a function y = ƒ(x). In each case, find ƒ -1(x) and identify the domain and range of ƒ -1. As a check, show that ƒ(ƒ -1(x)) = ƒ -1(ƒ(x)) = x. f(x) = x + 3 2 x X
Find the (a) Domain and (b) Range.y = ln (x - 3) + 1
Use graphs to find approximate solution.3x - 0.5 = 0
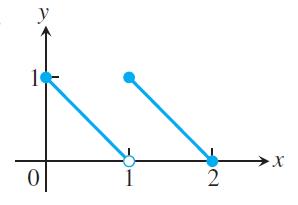
Write a piecewise formula for the function. 0 1 2 ·X
Gives a formula for a function y = ƒ(x). In each case, find ƒ -1(x) and identify the domain and range of ƒ -1. As a check, show that ƒ(ƒ -1(x)) = ƒ -1(ƒ(x)) = x.ƒ(x) = x3 + 1
State whether each function is increasing, decreasing, or neither.a. Volume of a sphere as a function of its radiusb. Greatest integer functionc. Height above Earth’s sea level as a function of atmospheric pressure (assumed nonzero)d. Kinetic energy as a function of a particle’s velocity
The population of Knoxville is 500,000 and is increasing at the rate of 3.75% each year. Approximately when will the population reach 1 million?
Gives a formula for a function y = ƒ(x). In each case, find ƒ -1(x) and identify the domain and range of ƒ -1. As a check, show that ƒ(ƒ -1(x)) = ƒ -1(ƒ(x)) = x.ƒ(x) = 1/x2, x > 0
The half-life of phosphorus-32 is about 14 days. There are 6.6 grams present initially.a. Express the amount of phosphorus-32 remaining as a function of time t.b. When will there be 1 gram remaining?
Graph four periods of the function ƒ(x) = -tan 2x.
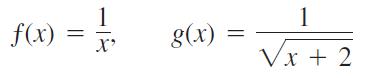
Finda. (ƒ ∘ g) (-1). b. (g ∘ ƒ) (2).c. (ƒ ∘ ƒ) (x). d. (g ∘ g) (x). f(x) 1 X' g(x) = 1 √x + 2
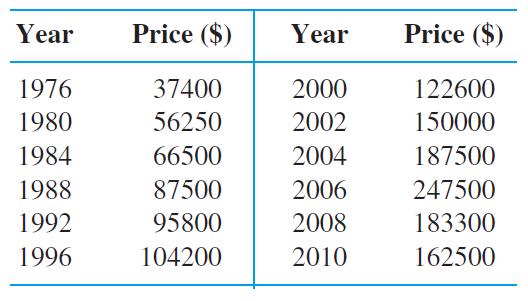
The median price of single-family homes in the United States increased quite consistently during the years 1976–2000. Then a housing “bubble” occurred for the years 2001–2010, in which prices first rose dramatically for 6 years and then dropped in a steep “crash” over the next 4 years,
Determine how much time is required for an investment to double in value if interest is earned at the rate of 6.25% compounded annually.
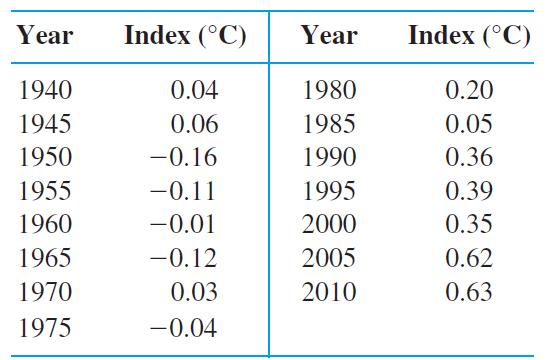
A NASA Goddard Institute for Space Studies report gives the annual global mean land-ocean temperature index for the years 1880 to the present. The index number is the difference between the mean temperature over the base years 1951–1980 and the actual temperature for the year recorded. For the
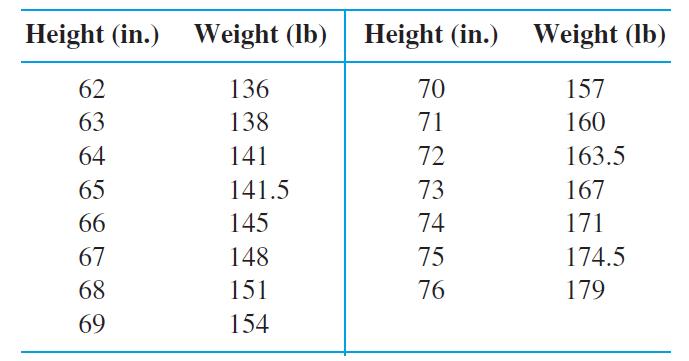
The table shows the average weight for men of medium frame based on height as reported by the Metropolitan Life Insurance Company (1983).a. Make a scatterplot of the data.b. Find and plot a regression line, and superimpose the line on the scatterplot.c. Does the regression line reasonably capture
Gives a formula for a function y = ƒ(x). In each case, find ƒ -1(x) and identify the domain and range of ƒ -1. As a check, show that ƒ(ƒ -1(x)) = ƒ -1(ƒ(x)) = x.ƒ(x) = x2 - 2x, x ≤ 1
Showing 14500 - 14600
of 29454
First
139
140
141
142
143
144
145
146
147
148
149
150
151
152
153
Last
Step by Step Answers