New Semester
Started
Get
50% OFF
Study Help!
--h --m --s
Claim Now
Question Answers
Textbooks
Find textbooks, questions and answers
Oops, something went wrong!
Change your search query and then try again
S
Books
FREE
Study Help
Expert Questions
Accounting
General Management
Mathematics
Finance
Organizational Behaviour
Law
Physics
Operating System
Management Leadership
Sociology
Programming
Marketing
Database
Computer Network
Economics
Textbooks Solutions
Accounting
Managerial Accounting
Management Leadership
Cost Accounting
Statistics
Business Law
Corporate Finance
Finance
Economics
Auditing
Tutors
Online Tutors
Find a Tutor
Hire a Tutor
Become a Tutor
AI Tutor
AI Study Planner
NEW
Sell Books
Search
Search
Sign In
Register
study help
business
construction project management
Project Management Systems Principles And Applications 1st Edition Adedeji B Badiru - Solutions
Develop an integer programming model for the resource allocation problem in Figure 7.47 assuming that daily resource availability is 5 units. Use LINDO or any other integer programming software to determine the optimal solution to your model. Discuss the results. Draw the project schedule chart
White Water Fun Park is planning to add another ride which consists of three main parts A, B, and C. The manager anticipates that it will take 14 days to receive the material. It should then take 7 days to assemble the components of part A which is then to be tested separately, which will take 3
Use any software tool available to you to solve the LP model in Exercise 7.11.
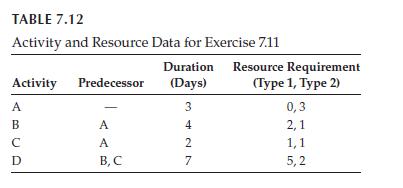
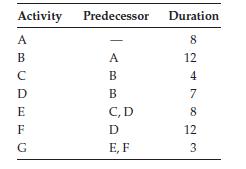
Develop a general LP formulation for scheduling the project in Table 7.12. Resource requirements and precedence relationships must be satisfied in the model (R1 = 5, R2 = 3).
Develop a computer program for finding the shortest path between all pairs of nodes in a directed acyclic network. Use the program to verify your solution to Exercise 7.9.
Find the shortest path between the originating node and the terminal node for the following acyclic network.
A project manager has four crews which can be hired on a temporary basis during peak construction periods. The manager currently has three projects more than can be handled with his regular crews. It is desired to determine the crew assignments that will minimize the total project cost. The costs
Golden Eagles, Inc. produces three styles of portable stadium seats: high-rider style, low-rider style, and line-hugger style. The seats are made of high-impact composite material and are produced in two steps, assembly and painting. The schedule for labor and material inputs for each seat style
Starting with Vogel’s approximation as the starting solution, solve the transportation problem example presented in this chapter. The example was previously solved with the northwest-corner starting solution.
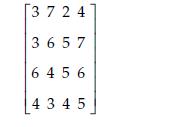
Solve the resource assignment problem with the following cost matrix: [3 7 24 3657 6456 4 345
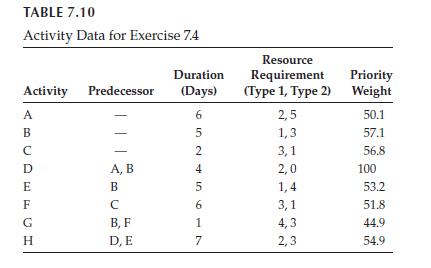
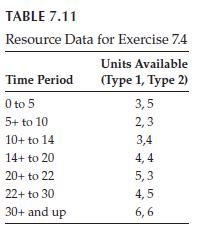
Develop and solve the knapsack formulation to schedule the project presented in Table 7.10, the resource for which is presented in Table 7.11. Draw the Gantt chart for the schedule. Use the following notation in your formulation:Ct is the set of activities eligible for scheduling at time t CAFi is
Solve the LP model of the example presented in this chapter on the number of workers to assign to a project workstation. Discuss how you would go about implementing the LP solution in a practical setting.
A delivery person makes deliveries to two project sites, site A and site B. He receives$1000 per delivery to site A and $200 per delivery to site B. He is required to make at least five deliveries per week to site B. Each delivery to either site A or site B takes him 3 h to complete. There is an
Repeat the activity scheduling example presented in this chapter with the assumption that a 15-min break is required between the completion of one activity and the start of the next activity.
Develop a computer simulation model to solve the problem in Exercise 6.18. Run the simulation for N = 1, 2, 3,…, 200. Plot the probabilities versus the values of N. Discuss your findings.
Suppose N independent candidates are to be scheduled for interviews during 1 year(365 days). Each interview takes exactly 1 day. There is only one interviewer available and only one candidate can be interviewed at a time. Each candidate is requested to specify a preferred date for his or her
The birthday problem is a popular problem in probability. The problem involves finding the probability that at least two people have the same birthday in a group of N individuals. An activity scheduling formulation of the problem can be stated as follows: N activities must be scheduled at random
Draw a fishbone diagram for evaluating the causes of deficiencies for each of the following project parameters:Cost Schedule Performance
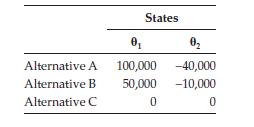
Consider the following payoff matrix for a decision-making problem:Determine the best alternative as a function of P(θ1) = p, where 0 ≤ p ≤ 1. What is the best alternative for p = 0.3? What is the value of perfect information for p = 0.3? 0 States 02 Alternative A 100,000 -40,000 Alternative B
Alctrex Construction Company is bidding against Betatrex for a building project. Due to past performance of both companies, Alctrex knows that if the company bids a lower or an equal amount, it will win the bid. It will cost Alctrex $9,500 to complete the project. Betatrex’s bid is a random
The duration of a certain task is known to be normally distributed with a mean of 7 days and a standard deviation of 3 days. Find the following:a. The probability that the task can be completed in exactly 7 daysb. The probability that the task can be completed in 7 days or lessc. The probability
What types of data would you recommend to be collected for a project involving the construction of a new soccer playground in a small community?
Using a software tool, such as a spreadsheet program, compute the average deviation, standard deviation, and variance for the raw data presented in Exercise 6.8.
Use the raw data presented in Exercise 6.8 to verify that (X − X) = 0.
The employees selected to work on a project are surveyed to select the type of organization structure suitable for the project. Which measure of central tendency would be the most appropriate to determine the preference by the greatest number of employees?
For each of the following measurement scales—nominal scale, ratio scale, ordinal scale, and interval scale—list at least five factors or data types associated with project management that can be measured on the scale.
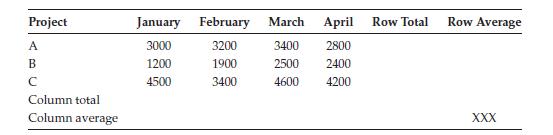
Given the following data for three projects, perform the complete data analysis as was done for Table 6.2. How would you perform the average cross-check in the cell marked “XXX”? Project January February March April Row Total Row Average A 3000 3200 3400 2800 B 1200 1900 2500 2400 C 4500 3400
List some additional reasons for terminating a project as a measure of control.
For each of the causes of control problems listed in this chapter, discuss what corrective actions should be taken.
How can schedule control be tied in with cost control?
How is the WBS (work breakdown structure) valuable in project monitoring and control?
Prepare a taxonomy of what should be included in a project management information system as measures of control.
Some common impediments to control.
Give one definition of productivity that relates to managerial control.
Calculate the takt time for a production project that calls for the production of 125 units of a product within an 8 h work day that includes two 15 min rest breaks and a 45 min lunch break.
Pay and work rate distribution exercise: Suppose two construction workers did a job together over several days and agreed to split the profits as follows:Contractor A: 40%Contractor B: 60%Contractor B had to leave the job early on some days. So, contractor A ended up working 9 h more than
Suppose the sixtieth unit of a product produced under a learning rate of 80% is $30. If the production standard is $20 per unit, determine how many more units must be produced before the standard can be reached.
The first 50 unit order of a job shop costs $1500. It is believed that the shop experiences a 75% learning curve rate. Determine a reasonable price quote for the next 80 unit order of the same job.
Suppose unit 190 of a product requires 45 h to produce under a learning curve rate of 80%. Determine the number of hours required by the first unit of the product and the number of hours required by unit 250.
The first performance of a task requires 8 h. The twentieth performance of the task requires only 2 h. If this task is subject to a conventional learning process, determine(a) Learning rate associated with the task.(b) Number of hours it will take to perform the task the twelfth time.
Suppose the first 20 unit batch of a product has an average cost of $72 per unit, the next 30 unit batch has an average cost of $60 per unit, and the next 50 unit batch has an average cost of $50 per unit. Based on this cost history, determine the appropriate learning curve percent to recommend for
Suppose an operation is known to exhibit a learning curve rate of 85%. Production was interrupted for 3 months after 100 units had been produced. If the cost of the very first unit is $50, find(a) Unit cost of the first unit produced after production begins again.(b) Cost of unit 150 of the product
In a certain project operation, it was noted that a total assembly cost of $2000 was incurred for the production of 50 units of a product. Suppose an additional 100 units were produced at a cost of $1000. Determine the learning curve percentage for the operation.
Compute scaled CAF priority weight for each of the activities in the project described hereafter. Use the scaled values to schedule the activities. Compare the schedule obtained to the schedule in Exercise 5.3.Units of resource type 1 available = 10 Units of resource type 2 available = 15 Resource
Suppose snowfall is a critical resource for a skiing business. The availability of snowfall in inches during a season is known to be a random variable defined by a triangular distribution with a lower-end point of 3 in., a mode of 6 in., and an upperend point of 10.5 in. Compute the probability
Three resource types (RES 1, RES 2, and RES 3) are to be assigned to a certain task. RES 1 working alone can complete the task in 30 days, RES 2 working alone can complete the task in 45 days, and RES 3 working alone can complete the task in 50 days. Suppose 2 units of RES 1 and 1 unit of RES 2
There are three resource types available for a certain project. One unit of each resource type is available. The project manager wants to evaluate the project cost on the basis of how resource teams are made up. She has the option of using a resource team, where the team can consist of only one
For the project data in the table, use the comprehensive network complexity approach to compute the network complexity for all possible combinations of resource availability(Z1, Z2), where the possible values of Z1 are 4, 6, 7, 8, and 9 and the possible values of Z2 are 2, 3, 4, 5, and 6. Note that
For the project data in the table, use the comprehensive network complexity measure to compute the network complexity for the following alternate levels of resource availability: 2, 3, 4, 5, 6, 7, 8, 9, 10, 11, and 12. Plot the complexity measures against the respective resource availability
Use the approach presented in Chapter 4 to compute the project network complexity for the data in Exercise 5.3.
Develop a quantitative methodology for incorporating different levels of quality of work by different resource types into the procedure for work rate analysis presented in this chapter.
Three resource types (RES 1, RES 2, and RES 3) are to be assigned to a certain task. RES 1 working alone can complete the task in 35 days, RES 2 working alone can complete the task in 40 days, and RES 3 working alone can complete the task in 60 days. Suppose 1 unit of RES 1 and 1 unit of RES 2
Suppose three resource types (RES 1, RES 2, and RES 3) are to be assigned to a certain task. RES 1 working alone can complete the task in 35 days, RES 2 working alone can complete the task in 40 days, and RES 3 working alone can complete the task in 60 days. Suppose 1 unit of RES 1 and 1 unit of
A scarce resource is to be leased for an engineering project. There is a graduated cost associated with using the resource at a certain percentage level, U. A step function has been defined for the cost rates for different levels of utilization. The step cost function is presented as follows:If U <
Suppose rainfall is a critical resource for a farming project. The availability of rainfall in terms of inches during the project is known to be a random variable defined by a triangular distribution with a lower-end point of 5.25 in., a mode of 6 in., and an upper end point of 7.5 in. Compute the
Suppose the utilization level of a critical resource is defined by a normal distribution with a mean of 70% and a variance of 24% squared. Compute the probability that the utilization of the resource will exceed 85%.
A project involves laying 100 miles of oil distribution pipe in the Alaskan wilderness. It is desired to determine the lowest-cost crew size and composition that can get the job done within 90 days. Three different types of crew are available. Each crew can work independently or work simultaneously
Three project crews are awarded a contract to construct an automated plant. The crews can work simultaneously on the project if necessary. Crew 1, working alone, can complete the project in 82 days. Crew 2, working alone, can complete the project in 50 days. Crew 3, working alone, can complete the
Use the computational measure presented in this chapter to compute the resource utilization level (area) for each schedule in Exercise 5.6.
Draw the resource idleness graph for each schedule in Exercise 5.6.
Draw the resource loading graph for each schedule in Exercise 5.6.
Schedule the project in Exercise 5.3 using each of the following heuristics: CAF, LS, ES, LC, EC, TS, CRD, and ACTIM. What is the shortest project duration obtained?Which heuristics yield that shortest project duration?
Using the computational approach presented in this chapter, compute the scaled CAF weight for each activity in Exercise 5.3.
For Exercise 5.3, draw the resource loading diagram for each resource type on the same graph. Which resource type exhibits more fluctuations in resource loading?
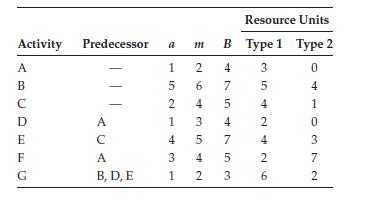
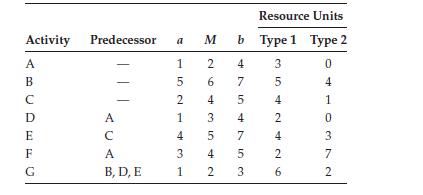
Use the minimum total slack (Min TS) heuristic to schedule the resource-constrained project. If a tie occurs, use minimum activity duration to break the tie.Units of resource type 1 available = 10 Units of resource type 2 available = 15 Resource Units Activity Predecessor a M b Type 1 Type 2 A B C
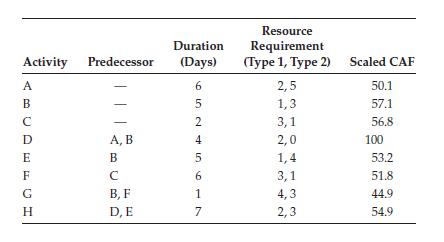
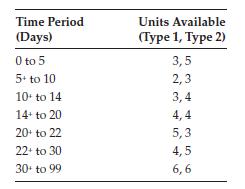
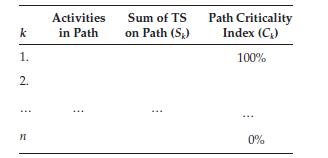
Presented in the table is the activity data for a project that is subject to variable resource availability. It is assumed that the scaled CAF weights for the activities are already known as given in the last column of the tabulated data. There are two resource types. Resource availability varies
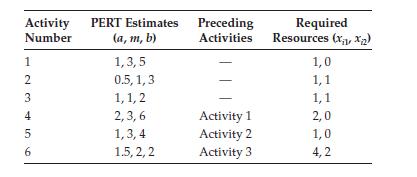
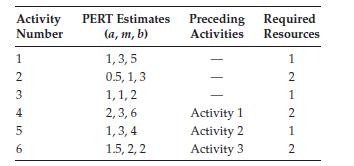
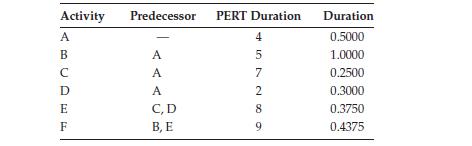
For the project data in Table 5.2, redefine the activity durations in terms of the PERT estimates presented as follows. If the other activity data are the same as presented in Table 5.2, compute the scaled CAF for each activity in the project and use the CAF criterion to schedule the project.
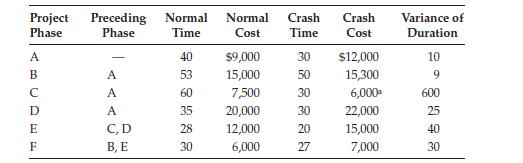
For the problem given in Exercise 4.12, assuming that the variance of duration is 0 for all the project phases, determine the time–cost trade-off curve by defining the strategies and calculating crashing cost for each strategy for Tmax ≤ T ≤ Tmin.
Draw an AOA network for the project described in Exercise 4.19. Use as few dummy arcs as possible.
The median rule of project control refers to the due date that has a 0.50 probability of being achieved. Suppose the duration, T, of a project follows a triangular distribution with end points a andb. If the mode of the distribution is closer to b than it is to a, find a general expression for the
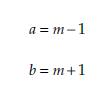
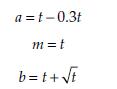
For the project data in Exercise 4.20, assume that the given activity durations represent the most likely PERT estimates (m). Define the other PERT estimates a and b as follows:Disregarding the PDM lead–lag constraints, find the probability of finishing the project within 51 time units. a=m-1
Would you classify the CPM procedure as a management by objective (MBO)approach or a management by exception (MBE) approach? Discuss.
Draw an expanded CPM network for the Gantt chart in Exercise 4.21 considering the need to split activities.
Repeat Exercise 4.20 and consider the lead–lag PDM restrictions. Draw the Gantt chart schedule that satisfies all the lead–lag constraints.
Assume that we have the following precedence diagramming network data:The following PDM restrictions are applicable to the network:SSAB = 3 FFAB = 12 FSBC = 1 SSBD = 6 SFDE = 13 FSFG = 3 If the project start time is t = 5 and the project due date is t = 52, perform conventional CPM analysis of the
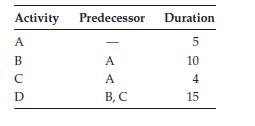
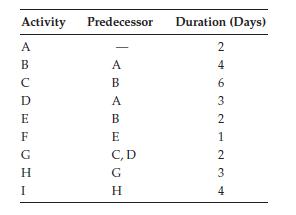
Assume that you are the manager responsible for the project whose data is presented as follows:(a) Draw the CPM diagram for this project.(b) Perform the forward and backward pass calculations on the network and indicate the project duration.(c) List all the different paths in the network in
(a) What potential effect(s) does the crashing of a noncritical activity have on the critical path and the project duration?(b) Use a hypothetical example of a CPM project network consisting of seven activities to support your answer given earlier. First show the network computations without
Presented in the following are the data for a precedence diagram problem. The SS, SF, and FF relationships between pairs of activities are given.SS(between A and B) = 1 F(between A and B) = 8 SS(between A and C) = 2 SF(between A and C) = 8 SS(between B and D) = 5 SS(between C and D) = 7 FF(between
Suppose we are given the following data for a project:There is no penalty if the project is completed on or before the normal PERT duration. However, a penalty of $3000 is charged for each day that the project lasts beyond the normal PERT duration. Using standard probability approach, find the
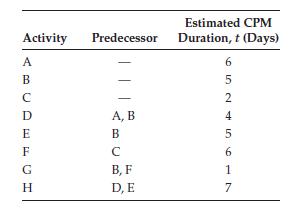
You are given the following project data:If the PERT time estimates for each activity are defined asfind a deadline, Td, such that there is 0.85 probability of finishing the project on or before the deadline. Note: Carry all computations to four decimal places. Estimated CPM Activity Predecessor
Suppose it is known that the duration of a project is uniformly distributed between 24 months and 46 months. Find the probability that the project can be completed in 40 months or less.
Suppose it is known that the duration of a project has a triangular distribution with a lower limit of 24 months, an upper limit of 46 months, and a mode of 36 months. Find the probability that the project can be completed in 40 months or less.
Answer the following questions using the tabulated project data.(a) There is a penalty of $3000/day beyond the normal PERT duration. Perform a crashing analysis to compare total normal cost to total crash cost. First crash only the critical activities; then crash all activities.(b) Find the
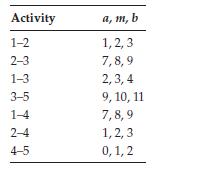
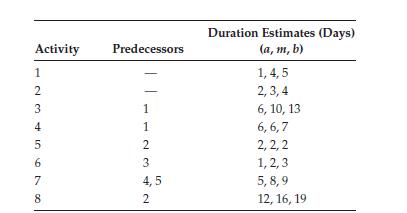
Perform a PERT analysis of the following project and find the probability of finishing the project between 16 and 20 days inclusive. Activity Predecessors Duration Estimates (Days) (a, m, b) 1,4,5 3 1 12345678 2,3,4 1 6, 10, 13 2 3 4,5 2 6,6,7 2,2,2 1,2,3 5,8,9 12, 16, 19
Suppose two serial activities A and B are the only activities in a precedence diagramming network. Activity A precedes activity B. There is an SS restriction of 4 time units and an FF restriction of 3 time units between A and B.(a) Determine the mathematical relationship between the duration of
Suppose five activities are on a CPM critical path and each activity has TS = 2. Determine the overall effect on the critical path length if two of the critical activities are delayed by 2 time units each. Discuss.
Using the mathematical expressions for FS and TS, show that FS cannot be larger then TS.
The following CPM network is subject to the following two simultaneous restrictions:(a) The project cannot start until 5 days from time 0 (i.e., ES of the start node = 5).(b) There is a deadline of 35 days (i.e., LC of the finish node = 35). Perform the forward and backward CPM computations and
Answer the following questions using the tabulated PERT project data.(a) Draw the AON CPM network for the project, perform the forward and backward computations, and determine the project duration.(b) Draw the Gantt chart using the earliest start times.(c) Draw the Gantt chart using the latest
The following historical data was compiled for the time (days) it takes to perform a task: 11, 18, 25, 30, 8, 42, 25, 30, 13, 21, 26, 35, 15, 23, 29, 36, 17, 25, 30, 21. Based on the given data, determine reasonable values for the PERT estimatesa, m, and b for the task.
Repeat the crashing exercise presented in Table 4.5 by crashing only the three critical activities, C, E, and G. What is the new project duration? What is the new total project cost?
Show that for any PERT project network, the probability of finishing the project in exactly x time units is zero.
Develop a table of advantages and disadvantages of the different organization structures presented in this chapter.
Use the combination and permutation formulas to compute and plot the complexity of project communication against varying values of n, the number of discussants. Discuss what you observe in the characteristics of the plots.
Prepare the management section of a project proposal dealing with environmental impact assessment for a new industry. Use the same industry type selected in Exercise 2.9.
Discuss some of the criteria that can be used to assess the technical feasibility of a project.
Develop a project planning model for the construction of a new manufacturing facility. The facility will produce products to be sold in the international market.
List five additional disadvantages of the Blobs structure shown in Figure 1.5 and five additional advantages of value-stream structure shown in Figure 1.6.
Project: Consider the compromise surface modeled in Figure 1.3. Develop a table of data (real or hypothetical) to actually model a three-dimensional surface representing a specific type of project of interest.
Consider the eight operating points in Figure 1.2(box of scope boundary), analyze and discuss the circumstance of each point with respect to the combination of levels of requirements, cost, and time.
Showing 4900 - 5000
of 6659
First
43
44
45
46
47
48
49
50
51
52
53
54
55
56
57
Last
Step by Step Answers