New Semester
Started
Get
50% OFF
Study Help!
--h --m --s
Claim Now
Question Answers
Textbooks
Find textbooks, questions and answers
Oops, something went wrong!
Change your search query and then try again
S
Books
FREE
Study Help
Expert Questions
Accounting
General Management
Mathematics
Finance
Organizational Behaviour
Law
Physics
Operating System
Management Leadership
Sociology
Programming
Marketing
Database
Computer Network
Economics
Textbooks Solutions
Accounting
Managerial Accounting
Management Leadership
Cost Accounting
Statistics
Business Law
Corporate Finance
Finance
Economics
Auditing
Tutors
Online Tutors
Find a Tutor
Hire a Tutor
Become a Tutor
AI Tutor
AI Study Planner
NEW
Sell Books
Search
Search
Sign In
Register
study help
business
construction project management
Project Management For Engineering Business And Technology 4th Edition John M. Nicholas, Herman Steyn - Solutions
Discuss briefl y each of the following ways to handle risk: transfer risk, avoid risk, reduce risk, contingency plan, and accept risk.
Do equations (10.1), (10.2), and (10.3) present good ways for rating the overall likelihood, impact, and consequences of risk? Discuss pros and cons of using these equations.
Tables 10.3 and 10.4 are for illustration purposes. Discuss the general applicability of these tables to rating risks in projects. Would you use these tables to assess the risk likelihood and impact in a project of your choice? Why, or why not?
What is an infl uence diagram? How is it used to identify and analyze risk sources, and to assign priorities to those sources?
A project involves developing a system with state-of-the-art hardware and software, both complex, and where system performance depends on another, external system that is being developed concurrently. Based on Table 10.3, and assuming all risk factors are independent and equally weighted, what is
Describe a cause-and-effect diagram. Pick a problem (effect) of your own choice, and use a cause-and-effect diagram for illustration.
Briefl y describe the following risk identifi cation techniques: analogy, checklists, WBS analysis, process fl owcharts, and brainstorming.
Describe each of the following sources of technical risk: maturity, complexity, quality, and concurrency or dependency.
Discuss the difference between internal risk and external risk. List sources of risk in each of these categories.
What factors make a project high risk?
What is meant by risk of failure?
How does a person’s risk tolerance affect whether he rates a risk high, medium, or low?
Should risks that have low likelihood be ignored? Explain.
Compile a list of “lessons learned,” and indicate how these lessons could contribute to more successful future projects.
Draw a CE diagram, a causal loop diagram, a CRT, and a Pareto diagram to illustrate a project management problem that you have experienced in your study project.
Identify project budget items that aim to reduce the cost of external failures.
Discuss how the quality plan is integrated with the schedule, budget, and risk management plan, and, if applicable, with the procurement plan.
Develop a quality plan for your project to form part of an integrated project management plan. Include quality management policies, standards, and specifi cations to meet metrics for meeting specifi cations/standards, training, and criteria for authorizing project phases, and discuss the use of
In which ways would you be able to uncover client expectations that have not been articulated explicitly?
Why does it make sense to construct a Pareto diagram before constructing a CRT?
Describe the pros and cons of CE diagrams, causal loop diagrams, and CRT.
How does the information on the x-axis of a Pareto diagram in project control differ from the information on the x-axis of a Pareto diagram constructed to analyze defects in a mass production environment?
How would you expect the bars of a Pareto diagram to change as the result of an improvement program?
How do client tests for acceptance differ from tests to obtain design information?
Perform an FMEA analysis on an electric kettle with cord and plug.
Describe how FMEA resembles the risk management approach described in Chapter 10.
Discuss the relationship between project risk management and project quality management.
Explain how classifi cation of defects differs from classifi cation of characteristics.
Explain how a narrow tolerance on a manufacturing drawing differs from the characteristic being classifi ed as critical or major.
Discuss how design reviews contribute to the approach of concurrent engineering.
Describe the differences between design reviews and audits.
Indicate for each of the following whether to apply for a modifi cation, a deviation, or a waiver:a. The supplier of oil fi lters to an automobile manufacturer says it plans to terminate production of a fi lter to be used on a car that is being developed.b. An inspector has discovered a kink in
How does the role of the quality manager (a functional manager) regarding quality planning differ from that of the project manager?
Explain the difference between quality and grade.
What is the difference between satisfying requirements and fi tness for purpose?Explain.
How does compliance to specifi cation differ from satisfying requirements?
A Rolls Royce is a high-quality vehicle. Is this always true? Consider different users and uses.
Describe your understanding of “quality.”
Did the PCAS produce time-phased cost schedules and forecasts? Show some examples. How were they used by the project manager?
What kinds of costs summaries were prepared? Who were they sent to? How were they used? Show some examples.
Was the project budget broken down into control accounts? If so:a. How were they related to the work packages and WBS, andb. How were they tied into the PCAS?
How were management and supervisory costs handled in the budget?
Describe the process of creating the project budget. Show a sample budget (or portion thereof).
What kind of project cost accounting system (PCAS) was used? Was it manual or computerized? Describe the system and its inputs and outputs. Who maintained the system? How was it used during the project?
How were estimates tallied to arrive at a total project cost estimate? Who did this?
How were overhead costs determined? What basis was used for establishing overhead cost rates?
How often and when were cost estimates revised during the project?
Was a life cycle cost analysis performed? If so, who did it, when, and using what methods? How did the analysis affect the design, development, and production of the project deliverables or main end-item?
What, if any, were the principle causes of cost escalation in the project?
When did estimating take place? How were estimates checked and accumulated?How were they related to the WBS?
How were project costs estimated? Who was involved? Describe the process.
Explain retention money and performance guarantee.
Using the data in problem 30, repeat Steps b and c using late start times. Then identify the feasible budget region using the cumulative curves.
Use the table below and the network in Figure 8.19 to answer questions about the ARGOT project:a. Compute the ESs and LSs for the project. Assume Ts is the same as the earliest project completion date.b. Construct a time-based network for the project such as Figure 8.14 (use early start times).c.
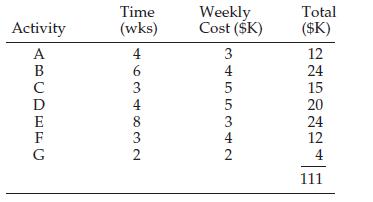
Chapter 7 discussed the impact of crashing activities and the relationship of schedules to cost. The method assumes that as activity duration is decreased, the direct cost increases owing to the increases in direct labor rates from overtime.Overhead rates also may vary, although the overhead rate
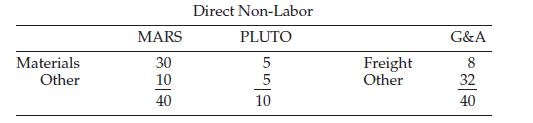
The example in Table 8.2 shows three possible ways of apportioning total direct costs. Using the same example, suppose the direct non-labor (DNL) cost and G&A are broken down as follows:Assuming all remaining costs shown in Table 8.2 are unchanged, compute the project costs for MARS and PLUTO
The project manager Sean Shawn employed the analogy with adjustment method to estimate the cost of constructing a three-car garage. Specifi cally, he started with the cost of an average two-car garage, $43,000, and increased it by 50 percent to$64,500. Comment on the likely accuracy of the
Refer to Case 5.1, the Barrage Construction Company, in Chapter
What might happen if top management submitted a bid for a project without consulting the business unit or department to be involved in the project?
What are the reasons for investigating the infl uence of schedules on project costs? What is the feasible budget region?
How are time-based forecasts prepared, and how are they used?
How are control accounts aggregated horizontally and vertically? Why are they aggregated like this?
What is a control account, and what kinds of information does it contain? How does a control account fi t into the structure of the PCAS?
How is the overhead rate determined?
What expenses are included under direct non-labor?
How are direct labor expenses determined?
What are six cost elements shared by most estimates and budgets?
Distinguish recurring costs from non-recurring costs.
What is a time-phased budget? What is the difference between a budget and a cost estimate?
Describe the PCAS. What is its purpose, and how is it used in project planning?
Describe the different kinds of contingency amounts, and the purposes each serves.
What is the role of the functional units and subcontractors in cost estimating?
Describe the process of using the WBS to develop cost estimates. How are these estimates aggregated into total project cost estimates?
For each of the following estimating methods, briefl y describe the method, when it is used, and the estimate accuracy it provides:a. Expert opinionb. Analogyc. Parametricd. Cost engineering.
Explain the difference between accuracy and precision. Give two examples that illustrate the difference.
Explain the difference between a cost estimate and a cost target. What are the problems in confusing the two—in using cost targets as cost estimates?
Explain what life cycle costs are, and how they are different from project costs.
What is the relationship between phases of the project life cycle and cost escalation?
How does the type of contractual agreement infl uence the potential for cost escalation?
How do changes in requirements cause cost escalation?
Describe what the term “phased (rolling wave) project planning” means.
What is the purpose of a contingency fund (management reserve)? How is the contingency fund used and controlled?
Defi ne cost escalation. What are major sources of cost escalation?
Why are accurate cost estimates so important, yet so diffi cult, in project planning?What are the implications and consequences of overestimating costs, and of underestimating costs?
Were people (other than the project manager) required to make commitments on the duration of activities? Comment on the possibility of changing this behavior.
How do you rate the risk of not fi nishing on time, and what are the factors contributing to this risk?
Discuss how they were applied and show examples. Discuss those applications which were not applied but which seem especially applicable to the project.
In the project you are studying, discuss which of the following kinds of analysis were performed:a. PERTb. CPM/time–cost trade-off analysisc. Scheduling with resource constraintsd. CCPM.
Write an essay on the reasons why projects are often late.
Discuss the differences between fast-tracking, concurrent engineering, and crashing.
Discuss the implications of resource allocation for organizations involved in multiple projects.
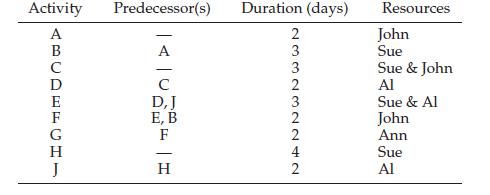
Consider the data about project activities given in the table below.36a. Schedule the work in such a way that each person always has only one task to perform (do not reduce the durations of activities or insert buffers as yet).b. Indicate the critical chain.c. Indicate where the feeding buffers
Refer to Figure 7.20. Scheduling Activity Q before Activity T would also have been a way to resolve the resource contingency. Explain why this alternative was not selected.
Refer to the network in Number 19 in “Review Questions and Problems” for Chapter 6.a. Indicate the critical chain on the diagram.b. Which one of the two resources is the constraint?c. Construct Gantt charts for this example based on the following heuristics: the shortest task time rule, the
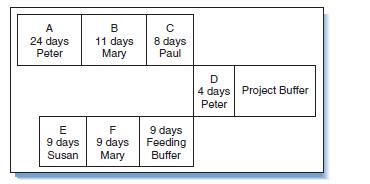
The diagram below was drawn before it became clear that Mary would have to perform both Activity B and Activity F.a. With the realization that Mary has to do the two tasks, indicate two possible critical chains.b. Reschedule the work and indicate the position and the size of the feeding buffer. A B
Explain in your own words how the principle of aggregation plays a role in reducing project duration.
How would you use buffers to ensure that you are on time for appointments?What factors would you take into account when you make a decision on the size of the buffer?
For the network in Figure 7.12, what is the probability of completing each of the fi ve paths within 30 days? What is the probability of completing them all within 30 days?
Refer to the fi rst network in the above problem.a. What is P(Te < 23)?b. What is P(Te < 32)?c. For what Ts is the probability 95 percent that the project will be completed?
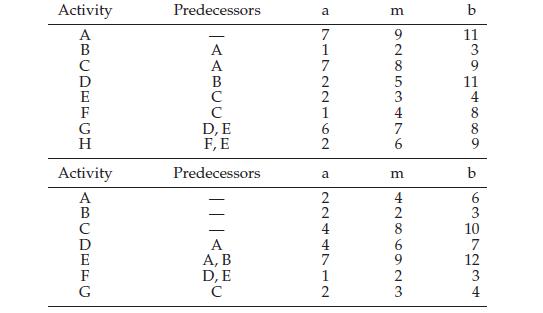
Given the immediate predecessors anda, m, b for each activity in the tables below, compute:a. te and V for each activityb. ES, EF, LS, and LF for each activity.c. Te and Vp for the project. Predecessors a b 92853476 71722162 AABCC Activity D, E F, E Predecessors ABCDEFGH a Activity ABCDEFC C
Showing 4600 - 4700
of 6659
First
40
41
42
43
44
45
46
47
48
49
50
51
52
53
54
Last
Step by Step Answers