New Semester
Started
Get
50% OFF
Study Help!
--h --m --s
Claim Now
Question Answers
Textbooks
Find textbooks, questions and answers
Oops, something went wrong!
Change your search query and then try again
S
Books
FREE
Study Help
Expert Questions
Accounting
General Management
Mathematics
Finance
Organizational Behaviour
Law
Physics
Operating System
Management Leadership
Sociology
Programming
Marketing
Database
Computer Network
Economics
Textbooks Solutions
Accounting
Managerial Accounting
Management Leadership
Cost Accounting
Statistics
Business Law
Corporate Finance
Finance
Economics
Auditing
Tutors
Online Tutors
Find a Tutor
Hire a Tutor
Become a Tutor
AI Tutor
AI Study Planner
NEW
Sell Books
Search
Search
Sign In
Register
study help
business
data analytics accounting
Introduction To Data Analytics For Accounting 2nd Edition Vernon Richardson, Katie Terrell And Ryan Teeter - Solutions
(LO 10-3) An outlier showing on a box plot will typically appear the maximum or minimum value within the expected range.a. outsideb. inside
(LO 10-2) Accounting figures and money are most likely to be shown as .a. interval datab. ratio datac. nominal datad. ordinal data
(LO 10-2) Why is a bar chart optimal for numerical data and pie chart optimal for categorical data?
(LO 10-1, LO 10-2) How does sorting help the decision maker more quickly grasp information conveyed in a bar chart?
(LO 10-1, LO 10-2, LO 10-5) When do you use a table instead of a bar chart?
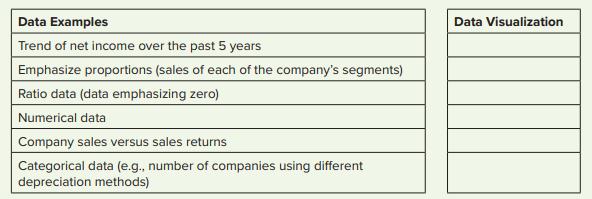
(LO 10-1, 10-2, 10-3, 10-4, 10-5) Match the type of data to the best descriptive data visualization as either (1) pie chart or (2) bar chart or line chart. There can be multiple answers for each example. Data Examples Trend of net income over the past 5 years Emphasize proportions (sales of each of
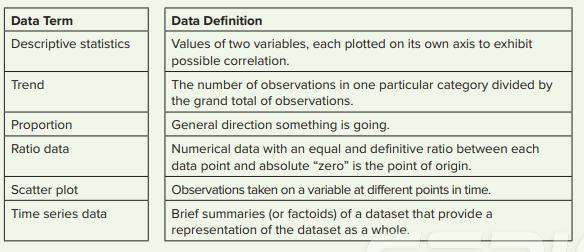
(LO 10-1, 10-2, 10-3, 10-4, 10-5) Match the data term to its appropriate definition. Data Term Descriptive statistics Trend Proportion Ratio data Scatter plot Time series data Data Definition Values of two variables, each plotted on its own axis to exhibit possible correlation. The number of
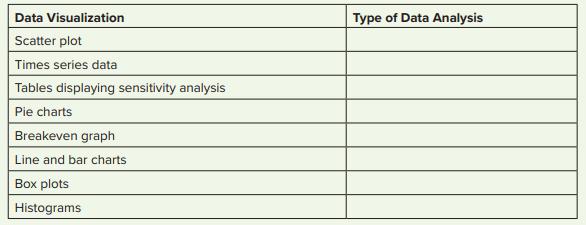
(LO 10-1, 10-2, 10-3, 10-4, 10-5) Match the data visualization most associated to its type of data analysis (descriptive, diagnostic, predictive, or prescriptive). Please select all that apply Data Visualization Scatter plot Times series data Tables displaying sensitivity analysis Pie charts
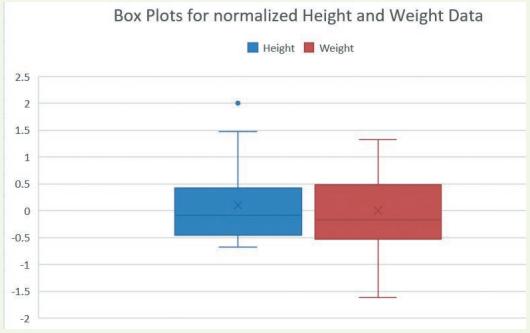
(LO 10-3) The following box plots illustrate the heights (blue/left) and weights (red/right)from a sample of children. To make it easier to compare the two box plots, the heights and weights of each individual have been transformed to a z-variable, which is a method for transforming datasets so
(LO 10-4) The following scatter plot uses the same data as in Problem 1, with a correlation of 0.439. (The data points are presented as their original values, not transformed into z-values).a. Interpret the correlation value and the scatter plot.b. Are the two variables positively or negatively
(LO 4-2) Foreign keys are required in every relational database table.a. Trueb. False
(LO 4-2) If customer ID is a unique identifier for the customer table, it would be the.a. primary keyb. foreign keyc. unique key
(LO 4-5) Tableau and Power BI require that you create a connection to a(n)data source.a. internalb. externalc. proprietary
(LO 4-4) To be useful to decision makers, accounting information must be and exhibit faithful representation.a. reliableb. free from errorc. relevantd. neutral
(LO 4-4) To faithfully represent what occurs, accounting information needs to be, complete, and neutral.a. reliableb. free from errorc. relevantd. timely
(LO 4-4) Internal control benefits of storing data in relational databases include all but which of the following?a. Reduced redundancy cuts down on errors.b. Physical security of the data is enhanced.c. Security around data entry and table access can aid in creating and enforcing data entry
(LO 4-4) According to the text, data integrity essentially means .a. truth in datab. that the testing can handle multiple versions of the datac. reliable data
(LO 4-5) Tableau shows you are importing a categorical variable by showing the icon.a. graphicalb. Abcc. bar chartd. numerical
(LO 4-1) Tableau has the biggest advantage over Excel in :a. data analysisb. data entryc. data manipulationd. data visualization
(LO 4-1) The most common type of database model is the database.a. hierarchicalb. networkc. relationald. star schema
(LO 4-2) Why is a foreign key needed to connect two tables?
(LO 4-4) By storing different versions of the data on their desktop computers or laptops instead of analyzing data through a live connection to the database, there ends up being “multiple versions of the truth” stored on computers across the company. How does this affect data integrity?
(LO 4-2, LO 4-4) What are the advantages of using a relational database?
(LO 4-5, LO 4-6) In Excel, when downloading data, you have the option to automatically refresh data each time you open the file. When considering Tyson’s financial statements, why would you want to refresh the financial statement data each time you access it? Why would you not want to refresh the
(LO 4-5, LO 4-6) In the text, there is an example of Excel not reading in the financial statement numbers as numbers to allow further analysis. Why is this? And how do you fix it?
(LO 4-6) Why is it perceived to be an advantage in Tableau and Power BI to only be able to access data externally rather than build the data internally?
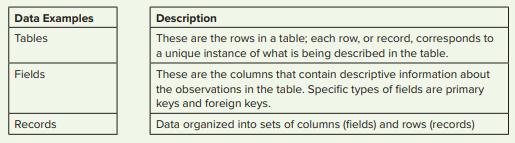
(LO 4-2) Match the relational database component term to its description: Data Examples Tables Fields Records Description These are the rows in a table; each row, or record, corresponds to a unique instance of what is being described in the table. These are the columns that contain descriptive
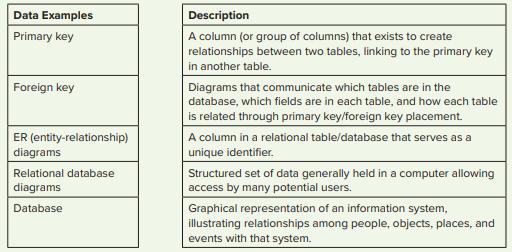
(LO 4-2, LO 4-3) Match the data example to its appropriate data type. Data Examples Primary key Foreign key ER (entity-relationship) diagrams Relational database diagrams Database Description A column (or group of columns) that exists to create relationships between two tables, linking to the
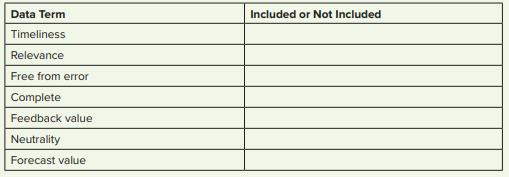
(LO 4-4) Mark whether each of the data terms are either “included” or “not included” as possible subcomponents of faithful representation of useful accounting. Data Term Timeliness Relevance Free from error Complete Feedback value Neutrality Forecast value Included or Not Included
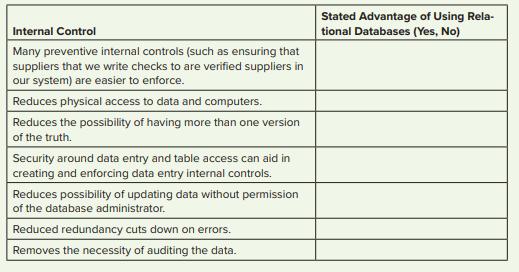
(LO 4-4) Mark each of the possible internal controls as either a stated advantage of using relational databases (yes) or not a stated advantage of relational databases (no). Internal Control Many preventive internal controls (such as ensuring that suppliers that we write checks to are verified
(LO 4-5) (This problem requires Excel for PC). Replicate the steps taken in the chapter regarding obtaining data from the Web through Excel, and access Amazon’s balance sheet from the Reuter’s site through Excel’s Get & Transform and Power Query tools.Transform the data in the following
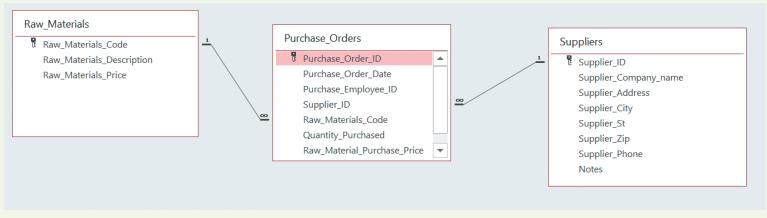
(LO 4-2, 4-3) Use the ER-diagram to answer the following questions:a. Identify the primary key in each table.b. Identify the foreign keys that build the relationship between the tables.c. Relying on the primary key/foreign key relationships, how would you create a SQL query that would select all
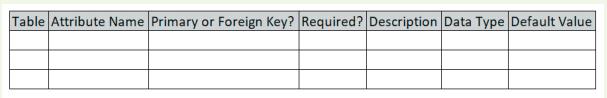
(LO 4-3) Use the same ER diagram from Problem 2 to create a data dictionary. Use the following template (for some of the fields, you can just make your best guess): Table Attribute Name Primary or Foreign Key? Required? Description Data Type Default Value
(LO 5-5) Which type of question does predictive analytics address?a. What happened?b. What should we do based on what we expect will happen?c. Why did it happen?d. Will it happen in the future?
(LO 5-4) Which type of question does diagnostic analytics address?a. What happened?b. What should we do based on what we expect will happen?c. Why did it happen?d. Will it happen in the future?
(LO 5-2, LO 5-3) What type of analytics addresses questions of “What happened?”?a. Descriptive analyticsb. Diagnostic analyticsc. Predictive analyticsd. Prescriptive analytics
(LO 5-2) What type of analytics would address the question of whether a company will go bankrupt?a. Descriptive analyticsb. Diagnostic analyticsc. Predictive analyticsd. Prescriptive analytics
(LO 5-2) If we wanted to know what level of sales would be needed to break even given the current economic environment, we would call that analytics.a. Descriptiveb. Diagnosticc. Predictived. Prescriptive
(LO 5-2, LO 5-3) What type of analytics would primarily summarize facts and compute sums, averages, counts, etc.?a. Descriptive analyticsb. Diagnostic analyticsc. Predictive analyticsd. Prescriptive analytics
(LO 5-2, LO 5-6) What type of analytics would primarily use what-if analysis, scenario manager, and goal seek analysis?a. Descriptive analyticsb. Diagnostic analyticsc. Predictive analyticsd. Prescriptive analytics
(LO 5-2, LO 5-4) What type of analytics would include Benford’s law to assess whether fraud had occurred?a. Descriptive analyticsb. Diagnostic analyticsc. Predictive analyticsd. Prescriptive analytics
(LO 5-2, LO 5-5) What kind of analytics is generally used to forecast future sales, earnings, and cash flows from operating activities?a. Time seriesb. Classificationc. Regressiond. Benford’s law
(LO 5-5) What kind of analytics is generally used to predict whether a company’s financial statements are fraudulent?a. Time seriesb. Classificationc. Regressiond. Horizontal analytics
(LO 5-2, LO5-6) Which tool is generally associated with prescriptive analytics?a. What-if scenariob. Fuzzy matchingc. Pivot tablesd. Means, modes, medians, and counts
(LO 5-7) Which statistic tells us how many standard deviations (σ), a data point (or observation), xi, is from its population mean, µ?a. z-scoreb. normal distributionc. uniform distributiond. F-statistic
(LO 5-7) Which distribution is a probability distribution where all outcomes are equally likely?a. Normal distributionb. Poisson distributionc. Level distributiond. Uniform distribution
(LO 5-7) If p-value ≤ alpha threshold, you shoulda. reject the null hypothesis (i.e. significant result).b. fail to reject the null hypothesis (i.e. not significant result).
(LO 5-7) If we run a regression where y (college completion rate) = f (factors potentially predicting college completion rate), what is the dependent variable?a. Factors potentially predicting college completion rateb. College completion ratec. Cannot be determined
(LO 5-7) A t-test has more power than a t-test.a. one-tailed; two-tailedb. two-tailed; two-tailed
(LO 5-7) If the critical value for a one-tailed t-test at the α = 0.05 level is 1.645, the t-statistic needed to reject the null hypothesis of no difference would be a. greater than 1.645b. less than 1.645
(LO 5-2) How does each question a decision maker might make require a different level, or type, of analytics, be it descriptive, diagnostic, predictive, or prescriptive?
(LO 5-2, LO 5-3, LO 5-6) Describe the differences between descriptive and prescriptive analytics.
(LO 5-2) Why is understanding what happened (descriptive analytics) often considered to be a prerequisite to understanding why something happened (diagnostic analytics)?
(LO 5-2, LO 5-3) Which type of analytics answers the question of how much state taxes the company paid during the previous year?
(LO 5-2, LO 5-3) Which type of analytics emphasizes totals, sums, averages, and sum totals? Defend your choice.
(LO 5-2, LO 5-5) Which type of analytics would forecast future earnings or sales? Defend your choice.
(LO 5-2, LO 5-6) Which type of analytics would optimize firm analytics based on expected changes in tax law? Defend your choice.
(LO 5-2, LO 5-4) Which type of analytics would look for violations of internal company policies? Defend your choice.
(LO 5-7) We are interested in investigating whether holiday sales returns at Target are different than nonholiday sales returns at Target. How would you describe the null and the alternate hypotheses for this situation?
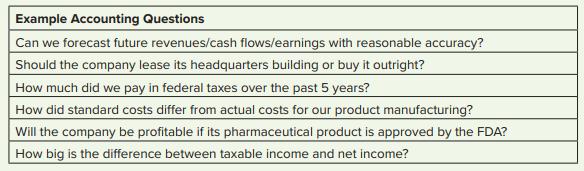
(LO 5-2, LO 5-3, LO 5-4, LO 5-5, LO 5-6) Select the analytics type (descriptive, diagnostic, predictive, or prescriptive) that best goes with the example accounting questions. Example Accounting Questions Can we forecast future revenues/cash flows/earnings with reasonable accuracy? Should the
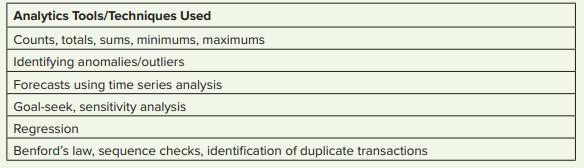
(LO 5-2, LO 5-3, LO 5-4, LO 5-5, LO 5-6) Select the analytics type (descriptive, diagnostic, predictive, or prescriptive) that best describes the analytics tools/techniques used. Analytics Tools/Techniques Used Counts, totals, sums, minimums, maximums Identifying anomalies/outliers Forecasts using
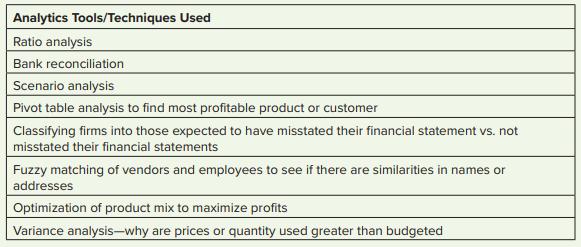
(LO 5-2, LO 5-3, LO 5-4, LO 5-5, LO 5-6) Select the analytics type (descriptive, diagnostic, predictive, or prescriptive) that best describes the analytics tools/techniques used. Analytics Tools/Techniques Used Ratio analysis Bank reconciliation Scenario analysis Pivot table analysis to find most
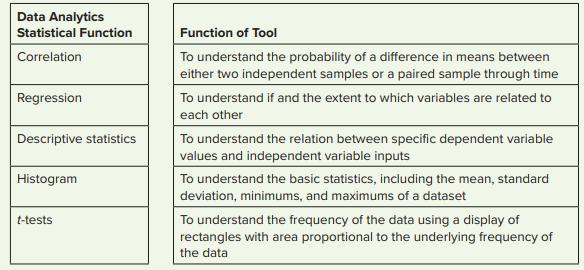
(LO 5-2, LO 5-3, LO 5-4, LO 5-5, LO 5-6) Select the type of Excel’s Data Analysis Toolpak statistical function that best describes the function of the tool. Data Analytics Statistical Function Correlation Regression Descriptive statistics Histogram t-tests Function of Tool To understand the
(LO 5-3) As part of descriptive analytics, determine which retail company (Amazon, Walmart, Target, or Kroger) has the highest return on assets. Go to their respective websites on finance.yahoo.com and key in their respective ticker symbols (Amazon =AMZN; Walmart = WMT; Target = TGT; Kroger = KR);
(LO 5-7) If the alpha threshold is 0.05, and the p-value on a t-test comparing one company’s ROA to the industry average ROA is 0.045, what do you conclude about the null hypothesis that the company’s ROA is the same as the industry? Is the ROA the same or different than that of the industry?If
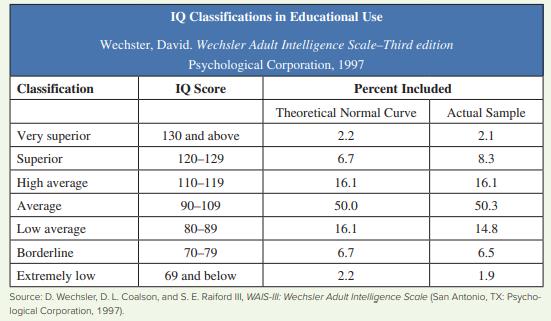
(LO 5-7)If your IQ is 130, the average population IQ is 100, and the standard deviation is 15, what is your z-score? How many standard deviations is that above the mean? What does that suggest about your IQ compared to the population?If the average IQ of the population is 100 and the standard
(LO 5-2, LO 5-3, LO 5-4, LO 5-5, LO 5-6) Describe specific types of questions asked in auditing that might require descriptive, diagnostic, predictive, and prescriptive analytics(one question for each). Describe the types of specific tools and techniques that could be used to address each of those
(LO 5-2, LO 5-3, LO 5-4, LO 5-5, LO 5-6) Describe specific types of questions asked in tax that might require descriptive, diagnostic, predictive, and prescriptive analytics (one question for each). Describe the types of specific tools and techniques that could be used to address each of those
(LO 5-3, LO 5-8) Download the “DJI Mavic Drone Sales Journal” dataset in Excel. Note the sales price and cost of each sale. Use the descriptive statistics tool featured in Excel’s Analysis Toolpak (or relevant Excel functions) to compute the summary statistics to address the following
(LO 5-3, LO 5-8) Download the “DJI Mavic Drone Sales Journal” dataset in Excel. Note the sales price and cost of each sale. In Excel, calculate the gross margin (Sales Price –Cost) for each sale (or row in the sales journal). Use the descriptive statistics tool featured in Excel’s Analysis
(LO 5-3, LO 5-8) Download the “Skydio Drone Sales Journal” dataset in Excel. Note the sales price and cost of each sale. Use the descriptive statistics tool featured in Excel’s Analysis Toolpak (or relevant Excel functions) to compute the summary statistics to address the following questions.
(LO 5-3, LO 5-8) Download the “SkyDio Drone Sales Journal” dataset in Excel. Note the sales price and cost of each sale. In Excel, calculate the gross margin percentage (Sales Price – Cost)/Sales Price for each sale (or row in the sales journal). Use the descriptive statistics tool featured
(LO 6-4) To compute the percentage change in a horizontal analysis, the computation is:a. (New – Old)/Oldb. (Old – New)/Oldc. (Old – New)/Newd. (New – Old)/New
(LO 6-4) In vertical analysis, the relevant base for accounts receivable would be which of the following?a. Sales revenueb. Total assetsc. Total stockholders’ equityd. Total credit sales
(LO 6-3) In which of the buckets would you expect the greatest amount of aged receivables to be?a. 31–60 daysb. 61–90 daysc. 1–30 daysd. 91–120 days
(LO 6-4) Which would have a higher expected profit margin (per dollar of sales) than the others?a. Jewelryb. Shampooc. Bananasd. Clothing
(LO 6-4) Which would have a higher expected asset turnover (per dollar of assets) than the others?a. Jewelryb. Real estatec. Grocery storesd. Airline transportation
(LO 6-4) In vertical analysis, the relevant base for interest expense would be which of the following?a. Sales revenueb. Total assetsc. Total expensesd. Total liabilities
(LO 6-4) The calculation for return on equity using Dupont Analysis would be as follows:a. Profit margin × Asset turnover × Financial leverageb. Profit margin × Asset turnoverc. Asset turnover × Financial leveraged. Gross profit margin × Asset turnover × Financial leverage
(LO 6-4) Which ratio includes a component to evaluate financial leverage?a. Return on assetsb. Return on equityc. Return on salesd. Return on investment
(LO 6-2) Which measure would help us evaluate what happens in the highest and lowest 10 percent of the data?a. Quintilesb. Quartilesc. Averaged. Deciles
(LO 6-2, 6-3) A is a graphical depiction of a , which reorganizes and summarizes certain data using cross-tabulations without changing the underlying spreadsheet (or data).a. pivot chart; pivot tableb. pivot table; pivot chartc. histogram; pivot tabled. graph; table
(LO 6-1, LO 6-5) Which type of analytics generally would go first when addressing an accounting issue?a. Predictive analyticsb. Prescriptive analyticsc. Diagnostic analyticsd. Descriptive analytics
(LO 6-4) The best measure for evaluating firm efficiency in handling and using assets would be .a. asset turnoverb. return on assetsc. profit margind. return on equity
(LO 6-3) The older the accounts receivable (i.e., longer amount of time it has been outstanding), the likely it will be that they will ultimately be collected.a. moreb. less
(LO 6-2) The best way to analyze the extreme values in the sample would be to consider the .a. meanb. maximum or minimumc. moded. standard deviation
(LO 6-2) The best way to analyze the variability in the sample would be to consider the.a. meanb. maximum or minimumc. moded. standard deviation
(LO 6-3) Why is the accounts receivable aging analysis done in terms of 30-day buckets? Why is that helpful to the decision maker trying to assess the appropriate level of the Allowance for Doubtful Accounts?
(LO 6-1, LO6-3, LO 6-5) The text discussed additional analysis that could be used to understand why customers are late paying their receivables, such learning more about the customers and their buying preferences. Why might this additional analysis be considered diagnostic analytics, as opposed to
(LO 6-3) In the chapter, we had an example of Amazon being one of the top six in terms of economy-wide dollar of sales increases from 2016 to 2017, but it is only in the top quartile of percentage of sales increases. How could this occur?
(LO 6-4) Explain how the DuPont ratio analysis divides up return on equity into component parts of profitability, efficiency, and leverage. Why do you think it is useful to divide it into these parts to discover what happened?
(LO 6-4) How do vertical and horizontal analyses complement each other in describing the performance of the company over the last relevant period?
(LO 6-2) When would the use of quartiles be more useful in describing a dataset than means or medians?
(LO 6-4) How do sparklines help the reader quickly grasp what happened? When might they be more useful than a table of figures or a bigger graph?
(LO 6-4, LO 6-5) Based on Exhibit 6.10 and the descriptive analytics reporting the return on market equity (the research work of Burgstahler and Dichev referenced in the chapter), what additional type of analytics could you do to understand why this distribution is different from a normal,
(LO 6-5) Why is descriptive analytics usually the first step in analyzing firm performance?Give three examples of basic descriptive analyses in this chapter that might lead to diagnostic analyses to better understand why something happened.
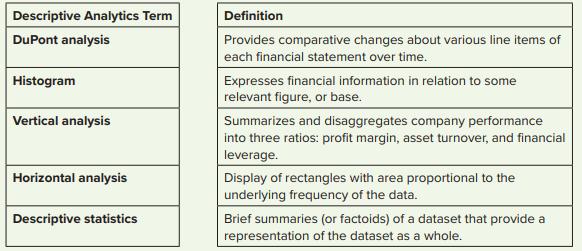
(LO 6-2, LO 6-3, LO 6-4) Match the descriptive analytics terms (descriptive statistics, horizontal analysis, vertical analysis, DuPont analysis, histogram) to its definition. Descriptive Analytics Term DuPont analysis Histogram Vertical analysis Horizontal analysis Descriptive statistics Definition
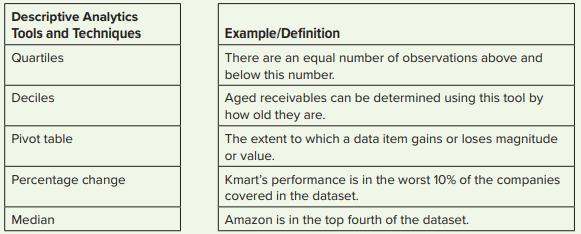
(LO 6-2, LO 6-3) Match the descriptive analytics tools and techniques to an example or definition. Descriptive Analytics Tools and Techniques Quartiles Deciles Pivot table Percentage change Median Example/Definition There are an equal number of observations above and below this number. Aged
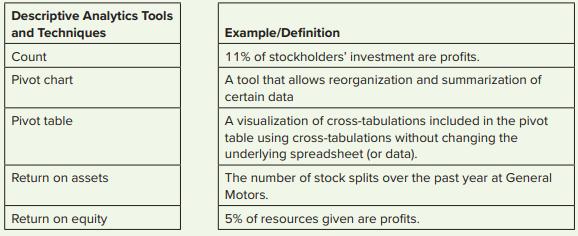
(LO 6-2, LO 6-3, LO 6-4) Match the descriptive analytics tool and technique to an example or definition. Descriptive Analytics Tools and Techniques Count Pivot chart Pivot table Return on assets Return on equity Example/Definition 11% of stockholders' investment are profits. A tool that allows
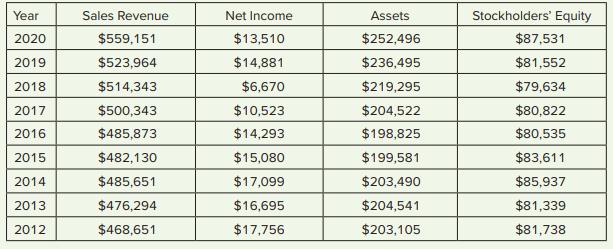
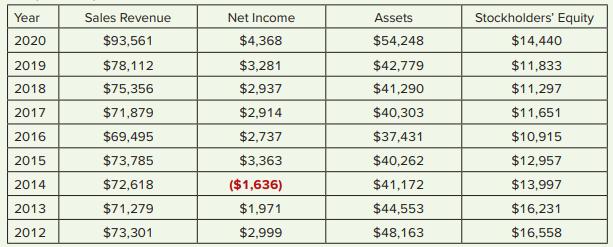
(LO 6-4) Compute the DuPont ratios (profit margin, asset turnover, and financial leverage ratios) for Walmart and Target given these numbers for 2012–2020. Check your numbers to make sure that Profit margin × Asset turnover × Financial leverage = Return on equity. The data file, DuPont Analysis
Showing 1100 - 1200
of 1576
First
2
3
4
5
6
7
8
9
10
11
12
13
14
15
16
Step by Step Answers