New Semester
Started
Get
50% OFF
Study Help!
--h --m --s
Claim Now
Question Answers
Textbooks
Find textbooks, questions and answers
Oops, something went wrong!
Change your search query and then try again
S
Books
FREE
Study Help
Expert Questions
Accounting
General Management
Mathematics
Finance
Organizational Behaviour
Law
Physics
Operating System
Management Leadership
Sociology
Programming
Marketing
Database
Computer Network
Economics
Textbooks Solutions
Accounting
Managerial Accounting
Management Leadership
Cost Accounting
Statistics
Business Law
Corporate Finance
Finance
Economics
Auditing
Tutors
Online Tutors
Find a Tutor
Hire a Tutor
Become a Tutor
AI Tutor
AI Study Planner
NEW
Sell Books
Search
Search
Sign In
Register
study help
business
data analytics accounting
ISE Data Analytics For Accounting 3rd Edition Ryan A. Teeter, Vernon Richardson, Katie L. Terrell - Solutions
(LO 9-1) Descriptive analytics help calculate tax liability more accurately. Give some examples of tax-related descriptive analytics.
(LO 9-3) Explain why tax sustainability would be of interest to the tax department.What does it allow them to do if they are able to gain tax sustainability?
(LO 9-3) Why would employee turnover of the tax personnel be a good KPI to track a company’s overall tax efficiency and effectiveness? What does low employee turnover (as compared to high turnover) allow a tax department to do?
(LO 9-2) Explain why the needs of the tax accountant are different than the needs of the financial accountants. Why does this lead to a tax data warehouse or tax data mart?
(LO 9-1, 9-4) Why would a company be interested in documenting the book-tax differences to identify potential items of interest to the IRS?
(LO 9-1) Explain how the IRS might use social media data to profile taxpayers who might be underpaying taxes. What additional information would the IRS need to consider in addition to social media data to build a full taxpayer profile?
(LO 9-4) Predictive analysis of potential tax liability and the formulation of a plan to reduce the amount of taxes paid is defined as:a. tax data analytics.b. tax data warehouses.c. tax compliance data.d. tax planning.
(LO 9-3) What allows tax departments to view multiple years, periods, jurisdictions(state or federal or international, etc.), and differing scenarios of data, typically through use of a dashboard?a. Tax data visualizationsb. Tax data warehousesc. Tax compliance datad. Tax planning
(LO 9-3) According to the textbook, an example of a tax risk KPI would be:a. employee turnover of the tax personnel.b. levels of technology/tax training.c. ETR (effective tax rate).d. levels of late filing or error penalties.
(LO 9-4) The task of tax accountants and tax departments to minimize the amount of taxes paid in the future is called:a. tax planning.b. tax compliance.c. tax minimization.d. tax sustainability.
(LO 9-3) According to the textbook, an example of a tax cost KPI would be:a. employee turnover of the tax personnel.b. levels of technology/tax training.c. ETR (effective tax rate).d. levels of late filing or error penalties.
(LO 9-2) Tax departments interested in maintaining their own data are likely to have their own:a. tax reporting system.b. tax data mart.c. tax dashboard.d. tax analytics.
(LO 9-1) In which stage of the IMPACT model (introduced in Chapter 1) would the use of tax cockpits fit?a. Track outcomesb. Master the datac. Address and refine resultsd. Perform test plan
How does having more metadata help a tax accountant minimize taxes?
What are some data a tax manager would need in order to perform a what-if analysis of the potential effects of a stock buyback?
Why would a company want to track the levels of late filing or error penalties as a tax risk KPI?
Why is ETR (effective tax rate) a good example of a tax cost KPI? Why is ETR over time considered to be a good tax sustainability KPI?
How is a tax data mart specifically able to target the needs of the tax department?
Why do tax departments need to extract data for tax calculation from a financial reporting system?
How can tax analytics support and potentially increase the amount of R&D tax credit taken by a company?
Which types of analytics are useful in tax planning—descriptive, diagnostic, predictive, or prescriptive—and why?
Understand the use of tax data for tax planning, and perform what-if scenario analysis.
Understand the use of visualizations as a tool in tax analytics.
Describe the tax data sources available at companies, accounting firms, and the IRS.
Understand the different types of problems addressed and analytics performed in tax analytics.
How else might you want to evaluate or visualize financial sentiment?
What do you notice about the count of positive and negative words compared to the total word count? How might this comparison impact your conclusions?
If you look at the scatter plot for all NYSE companies, do word count and positive-negative ratio appear to be correlated? In other words, if a company has more to say, does that mean it is more likely to say positive or negative things?
Click through several of the companies to observe their word counts and positive-negative ratios. What patterns to you notice?
According to the visual showing NYSE page 453 companies’ total word count, does the majority of the companies with a high total word count appear to have a positive-negative ratio higher or lower than the benchmark?
Click the filters to compare S&P100 companies listed on the NYSE to those listed on NASDAQ. Which exchange has the most positive companies in the data?
In the top 10 companies with the most to say, which companies have a positive-negative ratio higher than 0.7?
What is the value of the positive-negative ratio at its highest point?
In what year does the positive-negative ratio reach its highest point?
How many NYSE companies have a positive-negative ratio above 0.7 from 2016 to 2019?
Look at the companies with the highest word counts.Do they tend to have a higher or lower PNR? Would you expect companies that with high word counts in their financial statements to include more positive words or more negative words?
Given the benchmark for PNR, do you expect financial statements to include more positive or negative words overall? Why?
What does the PNR represent?
What is the benchmark value for PNR used to identify companies with the most positive word counts?
If one company has a significantly higher debt-toequity ratio than the other two, what might be driving this? How might the DuPont ratios help explain this?
What impact (if any) does missing data have on the ratios?
Analyze liquidity, profitability, financing (leverage), and activity for your company. Where is it strong?
Why is it useful to compare multiple companies at once?
How does XBRL fulfill the need for real-time, accurate financial data?
How well has your Company 1 managed short-term liabilities over the last three years?
Which of the three companies is most liquid in 2020, according to the quick ratio?
For your Company 1, which ratio has seen the biggest change from 2018 to 2020? Use sparklines or calculate the percentage change.
Which industry did you analyze?
Look at the values that return a 0.Is it likely that the 0 represents the company’s actual standing? What else might explain the 0 value?
Look at the different companies’ ratios. Which ones stand out to you as being atypical?
Which company’s ratios match Column J?
Which company’s ratios match Column I?
Which company’s ratios match Column H?
Which company’s ratios match Column G?
Which company’s ratios match Column F?
Which company’s ratios match Column E?
Which company’s ratios match Column D?
Which company’s ratios match Column page 441 C?
Which company’s ratios match Column B?
Which company’s ratios match Column A?
If analysts expect MMM to attain a gross profit margin above 47 percent, does the company exceed the expectations in all three years analyzed?
In which of the three years analyzed is operating expense highest as a percentage of revenue for PG?
What direction is cost of revenue trending for GE?
How could you expand this table you built in Part 2 to include multiple competitors’ data on the same sheet for quick analysis?
Replace the company ticker with a competitor of your company (e.g., MSFT vs. AAPL). How do their trends compare with your initial company?
How did the actual results compare with your hypothesis in Part 1 AQ3?
Enter the ticker for Apple Inc. (AAPL) or Nike(NKE). Look at the trends and composition of the income statement, then answer your three questions from Part 1 AQ2.
Change the values in your test formula. What is the value of [Current Assets] or AssetsCurrent for PG in 2020? (Round to the nearest million dollars.)
Change the values in your test formula. What is the Net Income for NKE in 2020? (Round to the nearest million dollars.)
What was the Net Income value for AAPL in 2020?(Round to the nearest million dollars.)
Form a hypothesis for each of your questions. For example, “I expect Nike’s operating costs have gone up.”
Select either Apple Inc. (AAPL) or Nike (NKE), and identify three questions you might want to know about that company’s financial performance over the past three years. For example, “What is the trend of operating costs?”
iXBRLAnalyst in Google Sheets uses “normalized”tags for common financial statement elements. What is the purpose of “normalized” XBRL tags?
(LO 8-3) Go to Loughran and McDonald’s sentiment word lists at https://sraf.nd.edu/textual-analysis/resources/ and download the Master Dictionary. These lists are what they’ve used to assess sentiment in financial statements and related financial reports. Select the appropriate
(LO 8-3) Go to Loughran and McDonald’s sentiment word lists at https://sraf.nd.edu/textual-analysis/resources/ and download the Master Dictionary.These lists are what they’ve used to assess sentiment in financial statements and related financial reports. Select the appropriate category
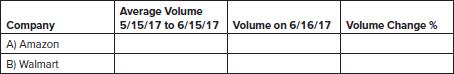
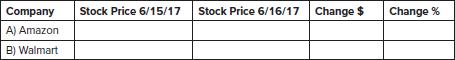
What impact did the Whole Foods announcement have on Amazon trading volume?b. Do the same analysis for Walmart (WMT) over the same dates. What impact did the Whole Foods announcement have on Walmart trading volume? Company A) Amazon Average Volume 5/15/17 to 6/15/17 Volume on 6/16/17 Volume Change
(LO 8-1) The preceding question asked you to figure out how the stock market responded to Amazon’s announcement that it would purchase Whole Foods. The question now is if the stock market for Amazon had higher trade volume on that day than the average of the month before.a. Go to
(LO 8-1) You’re asked to figure out how the stock market responded to Amazon’s announcement on June 16, 2017, that it would purchase Whole Foods—arguably a transformational change for Amazon, Walmart, and the whole retail industry.Go to finance.yahoo.com, type in the ticker symbol for
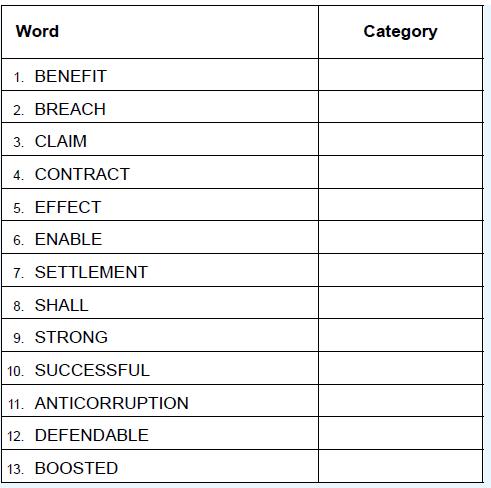
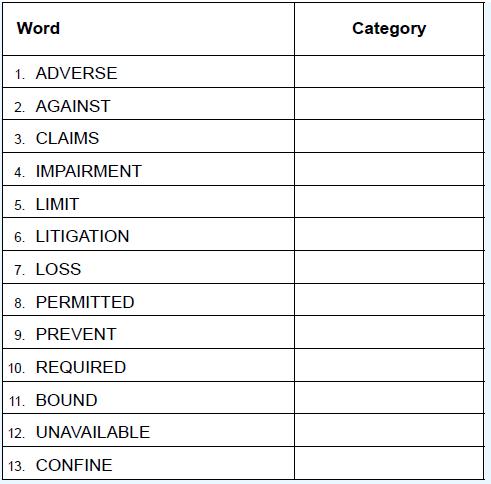
(LO 8-3) Analysis: We noted in the text that negative words in the financial dictionary include words such as loss, claims, impairment, adverse, restructuring, and litigation. What other negative words might you add to that list? What are your thoughts on positive words that would be included in
(LO 8-3) Analysis: Can you think of situations where sentiment analysis might be helpful to analyze press releases or earnings announcements? What additional information might it provide that is not directly in the overall announcement? Would it be useful to have sentiment analysis automated to
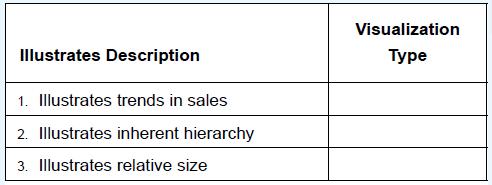
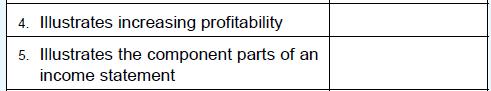
(LO 8-2) Match the following descriptions to one of the following visualization types:Heat map Sparklines Sunburst diagram Illustrates Description 1. Illustrates trends in sales 2. Illustrates inherent hierarchy 3. Illustrates relative size Visualization
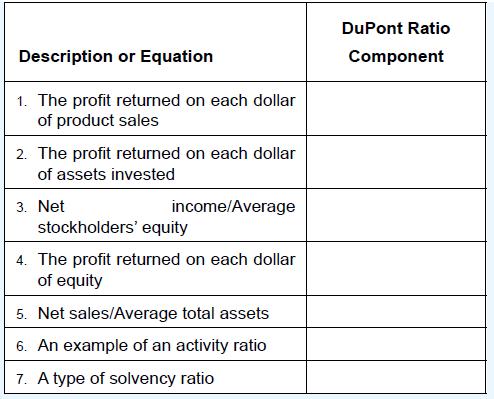
(LO 8-1) Match the following descriptions or equations to one of the following components of the DuPont ratio:Return on stockholders’ equity Profit margin Asset turnover Equity multiplier Return on assets Description or Equation 1. The profit returned on each dollar of product sales 2. The profit
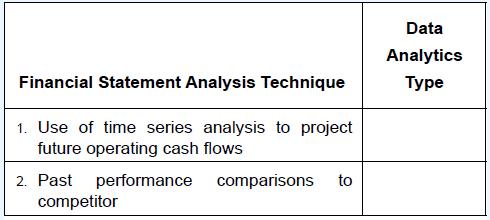
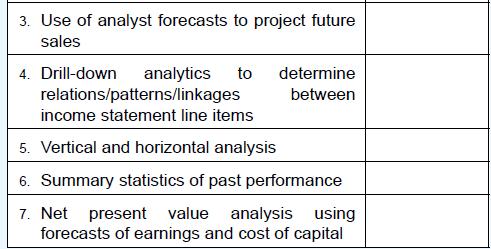
(LO 8-1) Match the description of the financial statement analysis technique to the data analytics type:Descriptive analytics Diagnostic analytics Predictive analytics Prescriptive analytics Financial Statement Analysis Technique 1. Use of time series analysis to project future operating cash flows
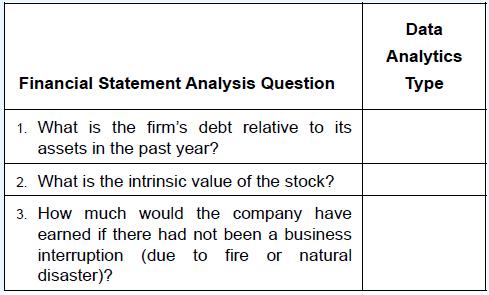
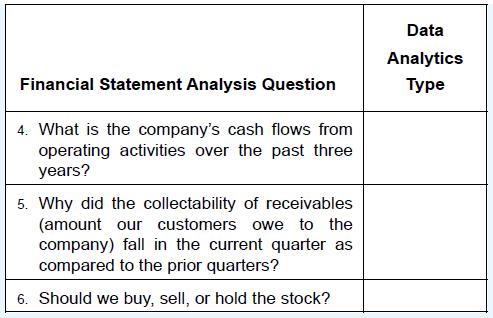
(LO 8-1) Match the description of the financial statement analysis question to the data analytics type:Descriptive analytics Diagnostic analytics Predictive analytics Prescriptive analytics Financial Statement Analysis Question 1. What is the firm's debt relative to its assets in the past year? 2.
(LO 8-3) Can you think of how sentiment analysis might be used in a marketing setting? How could it be used in a hospital setting? Or at your university? When would it be especially good to measure the sentiment?
(LO 8-4) Can you think of any other settings, besides financial reports, where tagged data might be useful for fast, accurate analysis generally completed by computers? How could it be used in a hospital setting? Or at your university?
(LO 8-1) Go to finance.yahoo.com and type in the ticker symbol for Apple (AAPL)and click on the statistics tab. Which of those variables would be useful in assessing profitability?
(LO 8-4) Go to https://xbrl.us/data-rule/dqc_0015-lepr/ and find the XBRL element name for Other Nonoperating Income and indicate whether XBRL says that should normally be a debit or credit entry.
(LO 8-4) Go to https://xbrl.us/data-rule/dqc_0015-lepr/ and find the XBRL element name for Interest Expense and Sales, General, and Administrative Expense.
(LO 8-1) Why do audit firms perform analytical procedures to identify risk? Which type of ratios (liquidity, solvency, activity, and profitability ratios) would you use to evaluate the company’s ability to continue as a going concern?
(LO 8-2) Would you recommend the Securities and Exchange Commission require the use of sparklines on the face of the financial statements? Why or why not?
(LO 8-3) Which would you predict would have more positive sentiment in a 10-K, the financial statements or the MD&A (management discussion and analysis) of the financial statements? More positive sentiment in the footnotes or MD&A? Why?
(LO 8-4) What is the name of the output from data vendors to help compare companies using different XBRL tags for revenue?a. XBRL taxonomyb. Data assimilationc. Consonant taggingd. Standardized metrics
(LO 8-4) What is the term used to describe the process of assigning XBRL tags internally within a financial reporting/enterprise system?a. XBRL taggingb. XBRL taxonomyc. XBRL-GLd. XBRL dictionary
(LO 8-4) Which term defines and describes each XBRL financial element?a. Data dictionaryb. Descriptive statisticsc. XBRL-GLd. Taxonomy
(LO 8-4) XBRL stands for:a. Extensible Business Reporting Language.b. Extensive Business Reporting Language.c. XML Business Reporting Language.d. Excel Business Reporting Language.
(LO 8-2) Determining how sensitive a stock’s intrinsic value to assumptions and estimates made would be an example of _____ analytics.a. diagnosticb. predictivec. descriptived. prescriptive
(LO 8-3) What computerized technique would be used to perform sentiment analysis on an annual accounting report?a. Text miningb. Sentiment miningc. Textual analysisd. Decision trees
(LO 8-2) In which stage of the IMPACT model (introduced in Chapter 1) would the use of sparklines fit?a. Track outcomesb. Communicate insightsc. Address and refine resultsd. Perform test plan
(LO 8-1) Performance comparisons to a company’s own past or to its competition would be considered _____ analytics.a. prescriptiveb. descriptivec. predictived. diagnostic
Showing 200 - 300
of 1576
1
2
3
4
5
6
7
8
9
10
11
12
13
14
15
Last
Step by Step Answers