New Semester
Started
Get
50% OFF
Study Help!
--h --m --s
Claim Now
Question Answers
Textbooks
Find textbooks, questions and answers
Oops, something went wrong!
Change your search query and then try again
S
Books
FREE
Study Help
Expert Questions
Accounting
General Management
Mathematics
Finance
Organizational Behaviour
Law
Physics
Operating System
Management Leadership
Sociology
Programming
Marketing
Database
Computer Network
Economics
Textbooks Solutions
Accounting
Managerial Accounting
Management Leadership
Cost Accounting
Statistics
Business Law
Corporate Finance
Finance
Economics
Auditing
Tutors
Online Tutors
Find a Tutor
Hire a Tutor
Become a Tutor
AI Tutor
AI Study Planner
NEW
Sell Books
Search
Search
Sign In
Register
study help
business
data analytics accounting
Introduction To Data Analytics For Accounting 2nd Edition Vernon Richardson, Katie Terrell And Ryan Teeter - Solutions
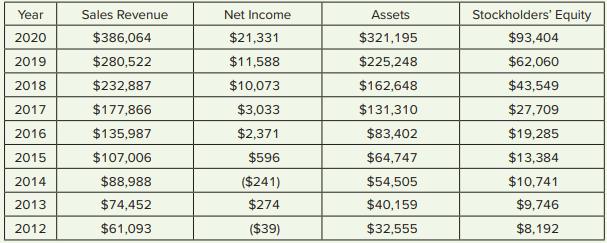
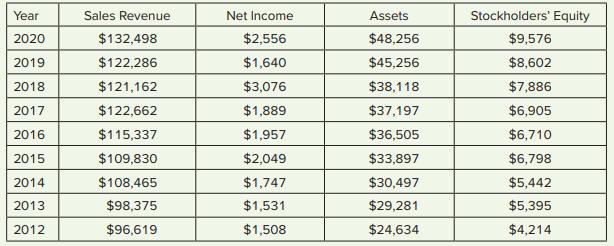
(LO 6-4) Compute the DuPont ratios (profit margin, asset turnover, and financial leverage ratios) for Amazon and Kroger given these numbers for 2012–2020. Check your numbers to make sure that Profit margin × Asset turnover × Financial leverage = Return on equity.The data file, DuPont Analysis
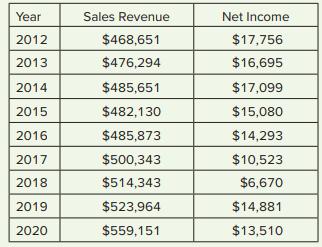
(LO 6-3, LO 6-4) Use the following data to graph the sales revenue and net income for Walmart from 2012–2020 in Excel. Create a bar graph for sales revenue, and create a line graph for net income, formatting the x- and y-axes with year and numbers inserting appropriate chart titles. What trends
(LO 6-3, LO 6-4) Use Excel to graph the past 3–5 years of stock prices of any publicly traded company (traded on NASDAQ, NYSE, or AMEX and listed at https://www.nasdaq.com/screening/company-list.aspx). Go to Yahoo! Finance to get the required stock market information from historical data menu
(LO 6-3, LO 6-4) Use Excel to graph the past 3–5 years of sales and net income of any publicly traded company (traded on NASDAQ, NYSE, or AMEX and listed at https://www.nasdaq.com/screening/company-list.aspx). Go to Yahoo! Finance, SEC EDGAR, or a company’s investor relations site to get the
(LO 6-2) Download the “Accounts Receivable Balances” dataset in Excel from Connect.Required:1. Using the Quartile function in Excel, calculate the minimum and maximum values and the value of the first quartile (25th percentile), second quartile (50th percentile), and third quartile (75th
(LO 6-2, LO 6-3, LO 6-4) Download the “Stock Returns DJIA Nasdaq SP500” dataset in Excel from Connect (Source: https://www.1stock1.com/1stock1_142.htm). Note the annual stock market returns to investment in the various indices from 1975 to 2021.Required:1. Create a clustered column of the
(LO 6-2, LO 6-3, LO 6-4) Download the “Stock Returns DJIA Nasdaq SP500” dataset in Excel from Connect (Source: https://www.1stock1.com/1stock1_142.htm). Note the annual stock market returns to investment in the various indices from 1975 to 2021.Either use the descriptive statistics tool
(LO 6-2, LO 6-3) Which stock return index has a higher return on investment: S&P 500, High-Grade Corporate Bonds, or the U.S. Treasury Bond from 1975 to 2021? Download the “Stock Returns DJIA Nasdaq SP500” Excel dataset from Connect (Source: https://www.1stock1.com/1stock1_142.htm). Note the
(LO 7-2) According to Benford’s law, what is the expectation for the percentage of times that the first digit of a number is a 9?a. 5.12%b. 4.58%c. 5.80%d. 30.10%
(LO 7-2) What is an example of a cash reconciling item for an item recorded in the general ledger but not yet recorded in the bank statement?a. Bank service feeb. Interest earned on notes held by the bankc. Outstanding checksd. NSF checks
(LO 7-2) Which cash reconciling item could potentially affect either the bank statement or the general ledger?a. Errorb. Interest earned on notes held by the bankc. Outstanding checksd. NSF checks
(LO 7-2) Which of the following can potentially find gaps in the check numbers written?a. Fuzzy matchingb. Test of duplicatesc. Benford’s lawd. Sequence check
(LO 7-3) Diagnostic analytics which uncovers previously unknown linkages, patterns, and relationships between variables is known as which of the following?a. outlier/anomaly detectionb. regressionc. drill-down, detailedd. classification
(LO 7-3) The appropriate test to compare one sample to another sample to see if one is greater than another in some way is called a(n) .a. regressionb. two-sample t-test of a difference in meansc. one-sample t-test of a difference in meansd. chi-squared test of a difference in
(LO 7-3) The appropriate test to see if independent variables are related to a dependent variable is called a(n) .a. regressionb. two-sample t-test of a difference in meansc. one-sample t-test of a difference in meansd. chi-squared test of a difference in means
(LO 7-2) is used to help find vendors that might have a similar address as an employee.a. Duplicate testingb. Sequence checkc. Benford’s lawd. Fuzzy matching
(LO 7-2) In fuzzy matching, if an exact match (tolerance = 100%) is required, what is the likely consequence for finding potential matches?a. Too many potential matchesb. Only exactly matches, no potential matchesc. Good mix between exact and potential matches
(LO 7-2) Management accounting uses variance analysis to explain what and why something happened in the cost of producing products. It is done by comparing actual outcomes to expected, or standard, costs. What is the expectation when the price of raw materials unexpectedly increases?a. Unfavorable
(LO 7-3) Where would the company likely get data comparing the salaries of female executives to the salaries of male executives?a. Customer relationship management systemb. Accounting systemc. Human resources systemd. Supply chain system
(LO 7-2) According to Benford’s law, which one of these first digits has a higher probability of occurrence than the first digit 3?a. 9b. 7c. 4d. 2
(LO 7-2) When is Benford’s law analysis not useful?a. Assets only recorded above a certain thresholdb. Cash disbursementsc. Earnings per shared. Large datasets
(LO 7-3) Analysis of the customer that owes the most would be an example of the diagnostic analytics of .a. performing drill-down detailed analyticsb. determining relations/patterns/linkages between variables through statistical analysisc. identifying anomalies/outliers
(LO 7-3) Evaluating the relationship between sales and advertising expense would be an example of the diagnostic analytics of .a. performing drill-down detailed analyticsb. determining relations/patterns/linkages between variables through statistical analysisc. identifying
(LO 7-2) Computing and evaluating price and quantity variances would be an example of the diagnostic analytics of .a. performing drill-down detailed analyticsb. determining relations/patterns/linkages between variables through statistical analysisc. identifying anomalies/outliers
(LO 7-1) Give a few examples of how diagnostic analytics answers the question “Why did it happen?”
(LO 7-2) What kind of testing would we use to finding missing check numbers? What type of testing should be used to see if some checks were double counted?
(LO 7-2) How is management by exception similar to finding and addressing anomalies?
(LO 7-2) What are the consequences of setting the tolerances too high (100% = exact match) or too low (30% = extreme inexact match) for use in the fuzzy match analytics?What tolerance level would you expect would give you about the right mix between exact and inexact matches?
(LO 7-3) Why does the sunk cost fallacy make it difficult to abandon some investments?What type of analytics should be used to get a more rational view?
(LO 7-3) In the chapter and in Lab 7.9, we discuss the possibility of a relation between advertising expenses and sales. Would it also make sense to look at the relation between advertising expenses and earnings since advertising expense is deducted from sales to arrive at earnings? What would you
(LO 7-3) What kind of test could be used to see how the price hike of recent raw materials inputs affects the price of production?
(LO 7-3) Should management decide to stop advertising if they find no connection between advertising expenses and current or future sales?
(LO 1-2) Which is the lowest level of critical thinking skills in Bloom’s Taxonomy?a. Createb. Rememberc. Applyd. Analyze
(LO 1-2) Which is the highest level of critical thinking skills in Bloom’s Taxonomy?a. Createb. Applyc. Analyzed. Understand
(LO 1-2) Which is the appropriate ordering of critical thinking skills in Bloom’s Taxonomy, where the higher order skill is to the left of the “>” symbol?a. Remember > Applyb. Apply > Analyzec. Analyze > Evaluated. Create > Analyze
(LO 1-3) Which step of the AMPS model most appropriately addresses the axiom, “Your data won’t speak unless you ask it the right data analytics questions”?a. Ask the Questionb. Master the Datac. Perform the Analysisd. Share the Story
(LO1-3) Which step of the AMPS model most appropriately addresses the question of the best way to communicate data analytics findings to a decision maker?a. Ask the Questionb. Master the Datac. Perform the Analysisd. Share the Story
(LO 1-3) What type of question is predicting whether a company will go bankrupt in the coming two years?a. What happened? What is happening?b. Why did it happen? What are the root causes of past results?c. Will it happen in the future? What is the probability something will happen? Is it
(LO 1-3) What type of question is choosing to take certain tax deductions based on the way managers believe tax legislation will change in the near future?a. What happened? What is happening?b. Why did it happen? What are the root causes of past results?c. Will it happen in the future? What is the
(LO 1-3) What type of question is finding the detail to more clearly understand why net income is decreasing when revenues are increasing?a. What happened? What is happening?b. Why did it happen? What are the root causes of past results?c. Will it happen in the future? What is the probability
(LO 1-4) What visualization type is most appropriate for evaluating the relationships between values?a. Bar chartb. Pie chartc. Histogramd. Scatterplot
(LO 1-5) Which of the following software tools specialize in data visualizations?a. SPSS and Power Queryb. Alteryx and Tableau Prepc. Power BI and Tableaud. R and Python
(LO 1-1) Why would the computer be better at the skills of remembering, understanding, and applying than the human accountant? In what areas would you say humans have a competitive advantage over a computer?
(LO 1-2) In your intro to financial accounting class, were the skills (noted in Bloom’s Taxonomy) taught more remembering, understanding, and applying or were they more analyzing, evaluating, and creating?
(LO 1-3) In the Master the Data step of the AMPS model, what unique competitive advantage does the accountant hold over computers or other information providers?
(LO 1-3) Which step of the AMPS model would include cleaning and preparing the data for analysis?
(LO 1-3) Why was the recursive nature of the AMPS model compared to peeling an onion? In other words, can we ever just perform the AMPS model and feel like we’ve answered the question/issue/problem/challenge facing the company?
(LO 1-3) According to the text, what would be a potential type of analysis performed for evaluating the revenues and earnings performance of the recent quarter?
(LO 1-4; LO 1-5) How do data acquisition and preparation software tools differ from data visualization software tools?
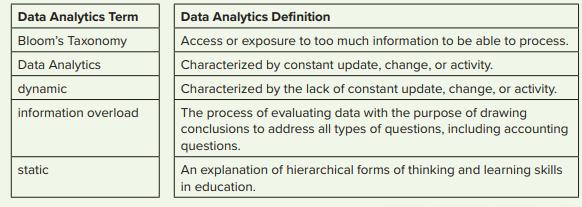
(LO 1-2) Match the data analytics term to its Data Analytics definition: Data Analytics Term Bloom's Taxonomy Data Analytics dynamic information overload static Data Analytics Definition Access or exposure to too much information to be able to process. Characterized by constant update, change, or
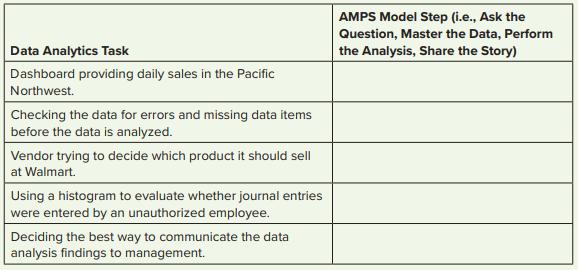
(LO 1-3) Match the step of the AMPS model to Data Analytics tasks. Each model step may be used more than once. Data Analytics Task Dashboard providing daily sales in the Pacific Northwest. Checking the data for errors and missing data items before the data is analyzed. Vendor trying to decide which
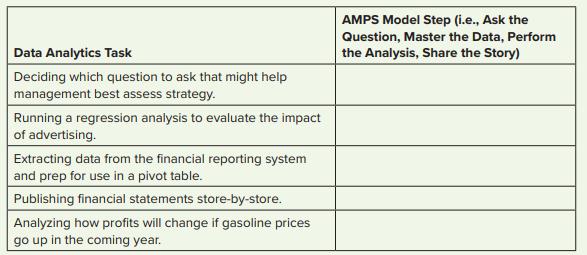
(LO 1-3) Match the step of the AMPS model to Data Analytics tasks. Each model step may be used more than once. Data Analytics Task Deciding which question to ask that might help management best assess strategy. Running a regression analysis to evaluate the impact of advertising. Extracting data
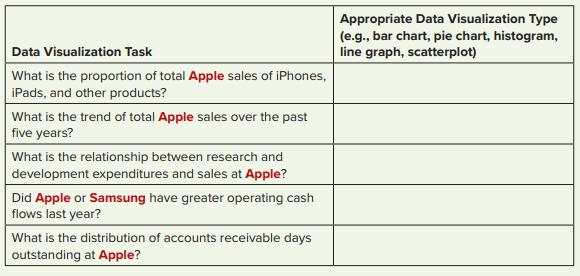
(LO 1-4) Match the data visualization task to the most appropriate data visualization type. Data Visualization Task What is the proportion of total Apple sales of iPhones, iPads, and other products? What is the trend of total Apple sales over the past five years? What is the relationship between
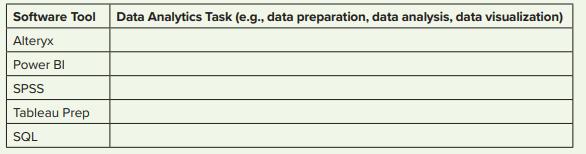
(LO 1-5) Match the software tool to its primary data analytics task. Each Data Analytics Task may be used more than once. Software Tool Data Analytics Task (e.g., data preparation, data analysis, data visualization) Alteryx Power BI SPSS Tableau Prep SQL
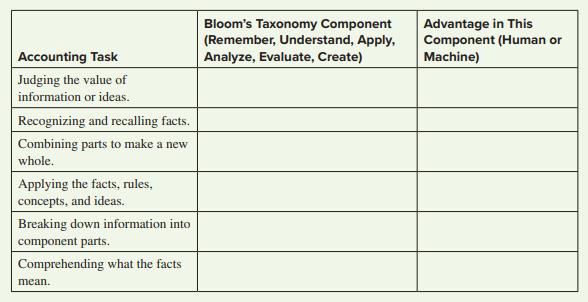
(LO 1-2) Match the components of Bloom’s Taxonomy and report who has the advantage (Human or Machine) to each accounting task. Accounting Task Judging the value of information or ideas. Recognizing and recalling facts. Combining parts to make a new whole. Applying the facts, rules, concepts, and
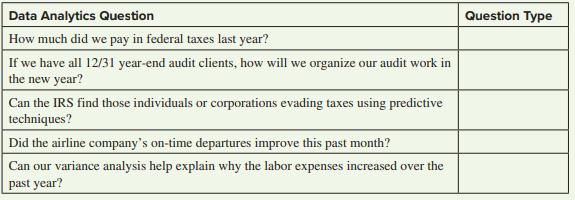
(LO 1-3) For each of the questions below, categorize them as one of the following question types:a. What happened? What is happening?b. Why did it happen? What are the root causes of past results?c. Will it happen in the future? What is the probability something will happen? Is it forecastable?d.
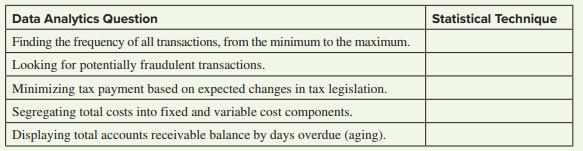
(LO 1-3) For each of the questions below, categorize the appropriate statistical technique that should be used to perform the analysis.a. Regression analysisb. Benford’s lawc. What-if/goal seekd. Histograme. Pivot table Data Analytics Question Finding the frequency of all transactions, from the
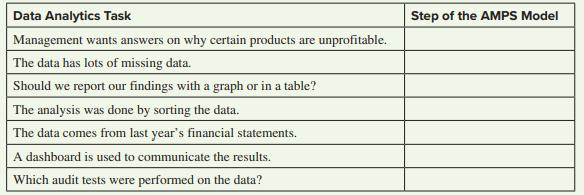
(LO 1-3) Match the following steps of the AMPS model to the data analytics task.a. Ask the Questionb. Master the Datac. Perform the Analysisd. Share the Story Data Analytics Task Management wants answers on why certain products are unprofitable. The data has lots of missing data. Should we report
(LO 1-3, 1-5) Download the Skydio Drone SKU dataset. Note the sales price and cost of each SKU (product). Use Excel to complete address the following questions. You may want to consider completing the Excel tutorial in Appendix A before completing this assignment.a. What is the SKU with the highest
(LO 1-3, 1-5) Download the DJI Mavic Drone SKU dataset. In Excel, calculate the gross margin (Sales Price – Cost), and gross margin percentage (Sales Price – Cost)/Sales Price for each SKU (product). You may want to consider completing the Excel tutorial in Appendix A before completing this
(LO 2-4) What would be most likely to be disclosed in an 8-K filing to the SEC?a. Financial statementsb. Change in auditorc. Management discussion and analysisd. Overview of a company’s main operations
(LO 2-4) What is the computer-based standard used to define and exchange financial information from financial statements preparers to financial statement users?a. SEC EDGARb. XBRLc. Earnings calld. Customer relationship management
(LO 2-5) Which system would be used to manage the hiring process for all potential employees?a. Human resource management systemb. Customer relationship management systemc. Supply chain systemd. Financial reporting system
(LO 2-4) The biggest difference between a 10-K and a 10-Q is the disclosure.a. frequency ofb. agency that receives thec. financial statements included in thed. company providing the
(LO 2-5) The chapter suggested that be used to help evaluate inventory obsolescence and the lower of cost or net realizable value of inventory.a. product reviewsb. inventory countsc. structured datad. supply chain data
(LO 2-3) Whereas would generally be considered to be structured data, would generally be considered to be unstructured data.a. financial statements; product reviewsb. product reviews; financial statementsc. Instagram pictures; product reviewsd. geographic
(LO 2-3) If there were fake news presented by someone trying to sway an opinion (or a vote), that would bring into question which aspect of Big Data?a. Volumeb. Veracityc. Velocityd. Variety
(LO 2-4) An announcement of a new CEO would most likely be reported on which SEC form?a. 10-Kb. 10-Qc. 8-Kd. S-1
(LO 2-2; LO 2-4) There are really very few opportunities to have a question-and-answer session with the CEO of a company and have it recorded for others to use. _____ provides details of the interactive question-and-answer session available to all interested parties.a. The management discussion and
(LO 2-6) The moral responsibility associated with gathering, protecting, and using data is called data _____.a. responsibilityb. stewardshipc. ethicsd. morals
(LO 2-1) Let’s say you have a strategy to book a flight on dates that a flight is oversold.(Oftentimes when a flight is oversold, you can get a free $700 voucher, allowing you to potentially get vouchers for free subsequent travel!) If you could have any data available for your analysis, what
(LO 2-3) How would you rate the velocity of stock price data on the New York Stock Exchange versus an income statement issued quarterly? What are the trade-offs in data generated more frequently and that data generated less frequently?
(LO 2-3) Why would the balance sheet be considered structured data, whereas product reviews would be considered to be unstructured data?
(LO 2-3) Which would have greater veracity: an annual report or a blog post? Why?
(LO 2-3) Which would have greater variety: a set of Instagram posts or a spreadsheet of employee data? Why?
(LO 2-4) Form 10-K, an annual submission to the Securities and Exchange Commission, requires management to explain its results from the most recent time period using their own words. Why would this be valuable data for a data analyst? How would a data analyst use this data?
(LO 2-4) How would a comparison of budgeted and actual data be useful to a data analyst?
(LO 2-4, LO 2-5) How would a data analyst evaluate a conference call to get a feel for the sentiment of management?
(LO 2-5) How would a company use the human resource management system data to evaluate employee turnover?
(LO 2-5) How would a company use customer relationship management data to evaluate whether a customer is able to pay back the receivables owed the company?
(LO 2-5) How would a company use supply chain data to evaluate whether a fraudulent vendor was set up?
(LO 2-5) How would data from a point-of-sale system be useful to a vendor?
(LO 2-6) Is it realistic for a customer to believe their personally identifiable information will be protected by a company and used in an ethical manner?
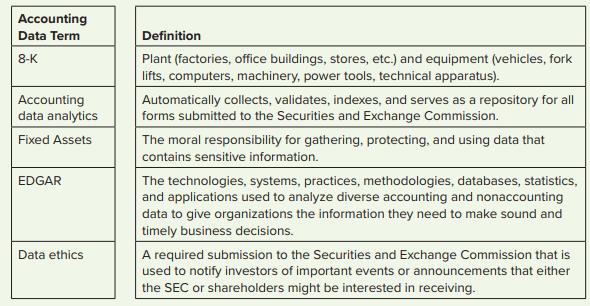
(LO 2-4) Match the accounting data term to the definition provided Accounting Data Term 8-K Accounting data analytics Fixed Assets EDGAR Data ethics Definition Plant (factories, office buildings, stores, etc.) and equipment (vehicles, fork lifts, computers, machinery, power tools, technical
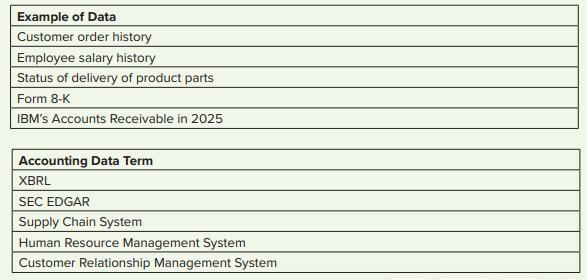
(LO 2-4, LO 2-5) Match the accounting data terms to the example of that data. Example of Data Customer order history Employee salary history Status of delivery of product parts Form 8-K IBM's Accounts Receivable in 2025 Accounting Data Term XBRL SEC EDGAR Supply Chain System Human Resource
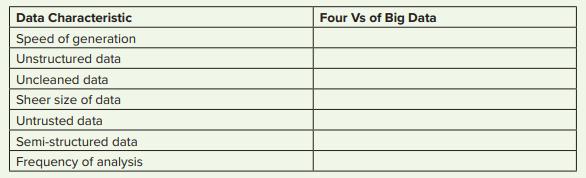
(LO 2-3) Match the data characteristic to one of the Four Vs of Big Data (e.g., velocity, variety, volume, veracity). Data Characteristic Speed of generation Unstructured data Uncleaned data Sheer size of data Untrusted data Semi-structured data Frequency of analysis Four Vs of Big Data
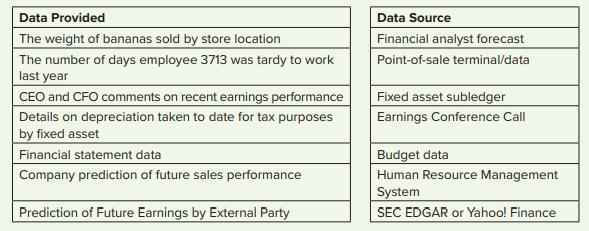
(LO 2-4, LO 2-5) Match the data source to the data provided. Data Provided The weight of bananas sold by store location The number of days employee 3713 was tardy to work last year CEO and CFO comments on recent earnings performance Details on depreciation taken to date for tax purposes by fixed
(LO 2-4) Go to SEC EDGAR (https://www.sec.gov/edgar/searchedgar/companysearch.html) and download the 2021 10-K (dated 01-31-2021) for Walmart (Ticker Symbol =WMT). Enter File Type as “10-K”.Required:1. Take a screenshot of the first page of the 10-K, paste it into a Word document, and label it
(LO 2-4, LO 2-5) Go to Yahoo! Finance (https://finance.yahoo.com/) and search the symbol for the NASDAQ Composite (∧IXIC). Click on Historical Data, and find the close price between November 12, 2020, and November 12, 2021.Required:1. Take a screenshot of the first 20 closing prices, paste it
(LO 2-4, LO 2-5) Go to Yahoo! Finance (https://finance.yahoo.com/) and search the symbol for Tesla (TSLA). Click on Historical Data, and find the close price between October 11, 2021, and November 12, 2021.Required:1. Take a screenshot of all the closing prices between October 11, 2021, and
(LO 2-7) Summarize monthly sales and compute the % Change from one month to the next (as shown in the chapter).Required:1. Download the file “Daily Company Sales.xlsx” in Excel.2. Use a PivotTable to sum sales by month.a. Capture a screenshot of sales by month, paste it into a Word document
(LO 2-7) Summarize sales by month, by sales region (regions 1-4), and by both month and region.Required:1. Download the file “Daily Company Sales.xlsx” in Excel.2. Use a PivotTable to sum sales by month.a. Capture a screenshot of sales by month, paste it into a Word document named"Problem 2-5
(LO 2-7) Download the “DJI Mavic Drone Sales Journal” dataset in Excel. Note the sales price and cost of each sale. In Excel, calculate the gross margin (Sales Price – Cost) for each sale. Use a PivotTable to determine the following. It may be helpful to perform this project after completing
(LO 2-7) Download the “Skydio Drone Sales Journal” dataset in Excel. Note the sales price and cost of each sale. In Excel, calculate the gross margin (Sales Price – Cost) for each line of the invoice. Use a PivotTable to determine the following. It may be helpful to perform this project after
(LO 2-7) Download the “Skydio Drone Sales Journal” dataset in Excel. Note the sales price and cost of each sale. In Excel, calculate the gross margin (Sales Price – Cost) for each line of the invoice. Use a PivotTable to determine the following. It may be helpful to perform this project after
(LO 3-1) Data considering the text in blogs would generally be considered .a. structured datab. interval datac. unstructured datad. ratio data
(LO 3-1) Noting gold, silver, and bronze medals for Olympic athletes would be considered a form of data.a. ratiob. ordinalc. numericald. interval
(LO 3-1) Employee salaries would be considered examples of data.a. intervalb. ratioc. ordinald. unstructured
(LO 3-1) Data stored in relational database tables such as Customers and Sales Orders would be considered .a. structured datab. unstructured datac. numerical datad. ordinal data
(LO 3-1, LO 3-2) Consider a set of 70 transactions categorized by type—sale or return.If there are 20 return transactions and 50 sales transactions, what is the proportion of return transactions?a. = 20/70b. = 20/50c. = 70/20d. = 50/20
Showing 1200 - 1300
of 1576
First
2
3
4
5
6
7
8
9
10
11
12
13
14
15
16
Step by Step Answers