New Semester
Started
Get
50% OFF
Study Help!
--h --m --s
Claim Now
Question Answers
Textbooks
Find textbooks, questions and answers
Oops, something went wrong!
Change your search query and then try again
S
Books
FREE
Study Help
Expert Questions
Accounting
General Management
Mathematics
Finance
Organizational Behaviour
Law
Physics
Operating System
Management Leadership
Sociology
Programming
Marketing
Database
Computer Network
Economics
Textbooks Solutions
Accounting
Managerial Accounting
Management Leadership
Cost Accounting
Statistics
Business Law
Corporate Finance
Finance
Economics
Auditing
Tutors
Online Tutors
Find a Tutor
Hire a Tutor
Become a Tutor
AI Tutor
AI Study Planner
NEW
Sell Books
Search
Search
Sign In
Register
study help
business
data analytics accounting
ISE Data Analytics For Accounting 3rd Edition Ryan A. Teeter, Vernon Richardson, Katie L. Terrell - Solutions
Which job has the highest revenue?
Which other measures might be useful for analyzing job cost variance?
What additional information might a manager want to add to complement this visual?
Why don’t we include revenue in this visualization?
What is the purpose of an IF … THEN … statement for this lab?
Are there more, fewer, or the same number of jobs with a favorable direct labor cost and overhead cost?
Is the job with the highest profit margin Premium or Standard?
How many jobs underperformed on budgeted profit?
How many jobs underperformed on profit margin?
Why do we need to set up calculated fields and measures before we can create a visualization?
What is the calculation for the budgeted direct labor cost? When is a cost favorable?
How much profit as a percentage of revenue does management hope to make from each product?
(LO 7-3) Analysis: Why is Order Fulfillment Cycle Time an appropriate KPI for a company like Wayfair (which sells furniture online)? How long does Wayfair think customers will be willing to wait if Amazon Prime promises items delivered to its customers in two business days? Might this be an
(LO 7-3) Analysis: If Time to Market is considered a key KPI for a company, what would be an appropriate benchmark? The industry’s time to market? The average time to market for the company for the past five years? The competitors’ time to market?How will you know if the company is making
(LO 7-3) Analysis: If ROA is considered a key KPI for a company, what would be an appropriate benchmark? The industry’s ROA? The average ROA for the company for the past five years? The competitors’ ROA?How will you know if the company is making progress?How might Data Analytics help with
(LO 7-4) Analysis: How does Data Analytics help facilitate the use of the Balanced Scorecard and tracking KPIs? Does it make the data more timely? Are you able to access more information easier or faster, or what capabilities does it give?
(LO 7-3) Analysis: From Exhibit 7-8, choose 10 marketing KPIs to answer the following three questions. This URL(https://www.linkedin.com/pulse/20130905053105-64875646-the-75-kpis-everymanager-needs-to-know) provides background information for each individual KPI that may be helpful in understanding
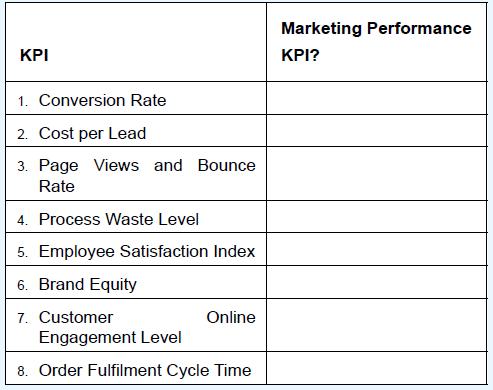
(LO 7-3) Of the list of KPIs shown below, indicate which would be considered to be marketing performance KPIs, and which would not be. 1. Conversion Rate 2. Cost per Lead 3. Page Views and Bounce Rate 4. Process Waste Level 5. Employee Satisfaction Index 6. Brand Equity 7. Customer Engagement Level
(LO 7-3) Analysis: From Exhibit 7-8, choose 10 employee performance KPIs to answer the following three questions. This URL(https://www.linkedin.com/pulse/20130905053105-64875646-the-75-kpis-everymanager-needs-to-know) provides background information for each individual KPI that may be helpful in
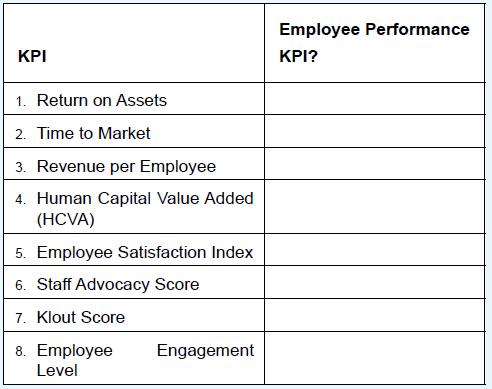
(LO 7-3) Of the list of KPIs shown below, indicate which would be considered to be employee performance KPIs, and which would not be. 1. Return on Assets 2. Time to Market 3. Revenue per Employee 4. Human Capital Value Added (HCVA) 5. Employee Satisfaction Index 6. Staff Advocacy Score 7. Klout
(LO 7-3) Analysis: From Exhibit 7-8, choose five financial performance KPIs to answer the following three questions. This URL(https://www.linkedin.com/pulse/20130905053105-64875646-the-75-kpis-everymanager-needs-to-know) provides background information for each individual KPI that may be helpful in
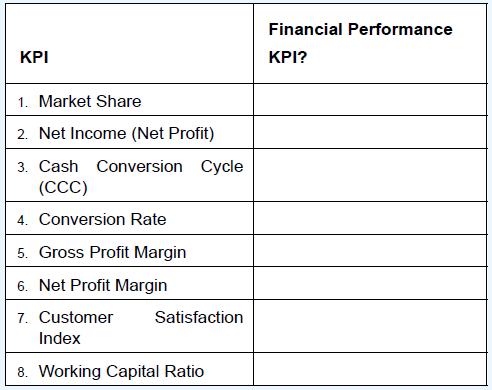
(LO 7-3) Of the list of KPIs shown below, indicate which would be considered to be financial performance KPIs, and which would not be. 1. Market Share 2. Net Income (Net Profit) 3. Cash Conversion Cycle (CCC) 4. Conversion Rate 5. Gross Profit Margin 6. Net Profit Margin 7. Customer Index
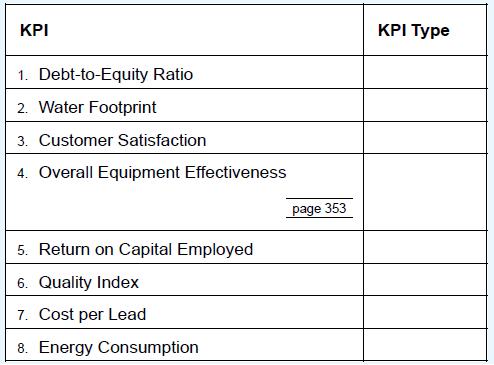
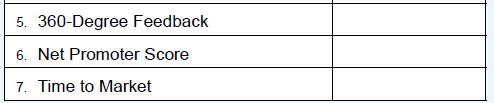
(LO 7-3) Match the following KPIs to one of the following KPI types:Financial Performance Operational Customer Employee Performance Marketing Environmental and Social Sustainability 1. Debt-to-Equity Ratio 2. Water Footprint 3. Customer Satisfaction 4. Overall Equipment Effectiveness KPI Type 5.
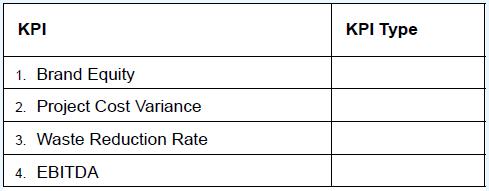
(LO 7-3) Match the following KPIs to one of the following KPI types:Financial Performance Operational Customer Employee Performance Marketing Environmental and Social Sustainability 1. Brand Equity 2. Project Cost Variance 3. Waste Reduction Rate 4. EBITDA KPI Type
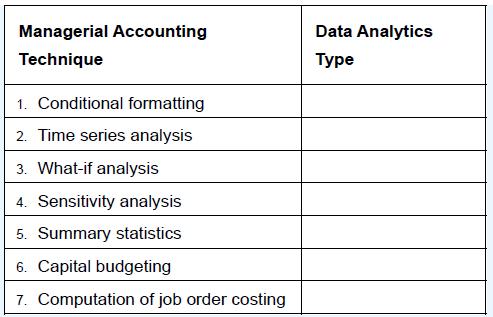
(LO 7-1, 7-2) Match the description of the management accounting technique to the data analytics type:Descriptive analytics Diagnostic analytics Predictive analytics Prescriptive analytics Managerial Accounting Technique 1. Conditional formatting 2. Time series analysis 3. What-if analysis 4.
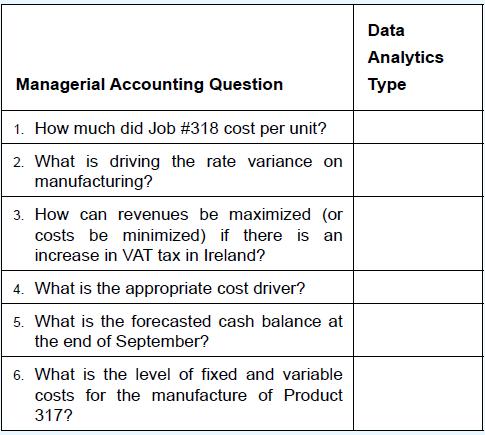
(LO 7-1, 7-2) Match the description of the management accounting question to the data analytics type:Descriptive analytics Diagnostic analytics Predictive analytics Prescriptive analytics Data Managerial Accounting Question 1. How much did Job #318 cost per unit? 2. What is driving the rate
(LO 7-2) In which of the four components of a Balanced Scorecard would you put the Walton College’s diversity initiative? Why do you think this is important for a public institution of higher learning?
(LO 7-5) Assuming you have access to data that are updated in real time, are there situations when you would not want to update your digital dashboard in real time?Why or why not?
(LO 7-3) Why is Customer Retention Rate a great KPI for understanding Tesla’s customers?
(LO 7-3) For a company like Walmart, how would the Balanced Scorecard help balance the desire to be profitable for its shareholders with continuing to develop organizational capacity to compete with Amazon (and other online retailers)?
(LO 7-3) For an accounting firm like PwC, how would the Balanced Scorecard help balance the desire to be profitable for its partners with keeping the focus on its customers?
(LO 7-3) Amazon, in our opinion, has cared less about profitability in the short run but has cared about gaining market share. Arguably, Amazon gains market share by taking care of the customer. Given the 75 KPIs that every manager needs to know in Exhibit 7-8, what would be a natural KPI for the
(LO 7-3, 7-4) We know that a Balanced Scorecard is comprised of four components: financial (or stewardship), customer (or stakeholder), internal process, and organizational capacity (or learning and growth). What would you include in a dashboard for the internal process and organizational capacity
(LO 7-3, 7-4) We know that a Balanced Scorecard is comprised of four components: financial (or stewardship), customer (or stakeholder), internal process, and organizational capacity (or learning and growth). What would you include in a dashboard for the financial and customer components?
(LO 7-1) In the article “The 7 Data Science Skills That Will Change the Accounting Career,” Robert Hernandez suggests that two critical skills are (1) revenue analytics and (2) optimizing costs and revenues. Would these skills represent descriptive, diagnostic, predictive, or prescriptive
(LO 7-1) What would you consider to be a prescriptive analytics technique in management accounting?a. Computation of KPIsb. Capital Budgetingc. Comparison of Actual Performance to Budgeted Performanced. Cash Flow Forecasts
(LO 7-3) What is defined as an interactive report showing the most important metrics to help users understand how a company or an organization is performing?a. KPIb. Performance metricc. Digital dashboardd. Balanced Scorecard
(LO 7-4) Which of the following would be considered to be a diagnostic analytics technique in managerial accounting?a. Summary Statisticsb. Computation of Job Order Costingc. Price and Rate Variance Analysisd. Sales Forecasts
(LO 7-4) On a Balanced Scorecard, which is not included as a component?a. Financial Performanceb. Customer/Stakeholderc. Internal Processd. Employee Capacity
(LO 7-4) The most important KPIs should be placed in the ______ corner of the page even if we are not following a strategy map template.a. bottom rightb. bottom leftc. top leftd. top right
(LO 7-3) What does KPI stand for?a. Key performance indexb. Key performance indicatorc. Key paired indexd. Key paired indicator
(LO 7-3) What would you consider to be an operational KPI?a. Inventory Shrinkage Rateb. Brand Equityc. CAPEX to Sales Ratiod. Revenue per Employee
Consider the opening vignette of the Kenya Red Cross. How do KPIs help the organization prepare and carry out its goal of being the “first in and last out”?
Why are digital dashboards for KPIs an effective way to address and refine results, as well as communicate insights and track outcomes?
Why does the location of individual visuals on a dashboard matter?
How often would you need to see the KPI of Waste Recycling Rate to know if you are making progress? Any different for the KPI of ROA?
How can management identify useful KPIs? How could Data Analytics help with that?
To illustrate what KPIs emphasize in “what gets measured, gets done,”Walmart has a goal of a “zero waste future.”2 How does reporting Walmart’s waste recycling rate help the organization figure out if it is getting closer to its goal? Do you believe it helps the organization accomplish
A bullet chart (as shown in Exhibit 7-3) uses a reference line to show actual performance relative to a benchmark. What advantages does a bullet graph have over a gauge, such as a fan with red, yellow, and green zones and a needle pointing to the current value?
If a manager is trying to decide whether to discontinue a product or division, they would look at the contribution margin of that object. What are some examples of relevant data that would be useful in this calculation? Irrelevant data?
Assess the underlying quality of data used in dashboards as part of management accounting analytics.
Evaluate the use of KPIs as part of a Balanced Scorecard.
Explain typical descriptive and diagnostic analytics in management accounting.
Explain how the IMPACT model applies to management accounting problems.
Understand how to address and refine results to arrive at useful information provided to management and other decision makers.
What other transactions or datasets lend themselves to running Benford’s law analysis?
Why do you think the results of your Chi-Squared Tests for the actual Dillard’s data compared to the fictitious data are so different? What does this mean to you when interpreting the results of Benford’s law analysis and the associated Chi-Squared Tests?
Using an alpha of 0.05, what is your decision regarding the fictitious dataset?
What does your decision (to reject or fail to reject the null) indicate about the actual data in the Dillard’s dataset?
Recall the rules associated with comparing your pvalue to alpha. When your p-value is less than alpha, you reject the null hypothesis. When p-values are large(greater than alpha), you fail to reject the null hypothesis that they are the same distribution. Using an alpha of 0.05, what is your
What is the p-value that you receive for the Dillard’s dataset (the result of the Chi-Squared function)?
How do the distributions of the fictitious data compare to the Benford’s law expected values distribution?
Do any values stand out to you as being anomalies in the actual dataset, as compared to the expected values?
By glancing at the bar charts, how do the two distributions (Expected and Actual) compare in shape?
What is the percentage of total leading digits in the actual observations that begin with 7?
Which of the actual leading digits have more observations than the expected Benford’s law digits?
Is the distribution of actual leading digits similar to the distribution of the Benford’s law expected digits distribution?
If you filter on TRAN_TYPE to remove returns, what is the impact on the sample data?
If you visualize the count of TRANSACTION_ID, what do you notice about the days with the highest revenue?
Which days seem to have the highest revenue across the different years?
In the lab, you assessed the distribution of each attribute and created a visualization using the TRAN_DATE field. What was the range of dates your random sample pulled in?
In previous labs working with Dillard’s data, you have looked at data from specific days instead of pulling a random sample. When do you think it is preferred to pull a random sample?
In previous labs working with Dillard’s data, you have looked at data from specific days instead of pulling a random sample. When do you think it is sufficient to look at data from specific days? When would that even be preferred?
Would the date of the duplicate payments usually be the same or different?
What data items do you need to be able to find duplicate payments?
Before computerization or Data Analytics, how would companies find that they had made duplicate payments?
What data items do you need to combine to be able to find duplicate payments?
How much money could the company recover from the supplier from these duplicate transactions?
What is (are) the invoice number(s) of the duplicate payments?
How many duplicate records did you locate?
As an auditor, why would we be concerned with a high volume of transactions that exceed the Benford Expected value?
What can we learn by looking at an individual’s transactions through the lens of Benford’s law?
What does calculating the Benford Average tell us about individuals?
Hover over the individuals in the Benford Average visualization. Click the bar for the first individual with more than 10 transactions to filter the dashboard. What digit do most of that individual’s transactions begin with?
Hover over the individuals in the Benford Average visualization. What is the average Benford Expected value for the person (round to two decimal places) with the smallest Benford Average who also has more than 10 transactions?
Hover over the individuals in the Benford Average visualization (you could also create a new visualization to show the Benford average and Purchase Order count by user). What is the name of the individual with the smallest Benford Average who also has more than 10 transactions?
Click the bar for the leading digit 4 to filter the transactions. What is the grand total of all transactions that begin with a 4 (rounded to the nearest dollar)?
Look at the Benford visual in the top-left corner of your dashboard. Which digit appears much greater than its expected value?
How does cluster analysis help you easily identify those outliers?
As an auditor, why would transactions by the individuals with highest purchase amounts and highest number of transactions represent potential risk?
In the clusters chart, click the individual with the highest number of transactions. What is the category or supplier group with the highest number of transactions?
In the clusters chart, click the individual with the highest number of transactions. What is the individual’s name?
In the clusters chart, click the individual with the highest purchase amount. What category or supplier group received the most purchases?
In the clusters chart, click the individual (entered by)with the highest purchase amount. What is the individual’s name?
How does showing a table of values in addition to charts and graphs help an auditor interpret the data?
Why is it useful to link filters across multiple visualizations on a dashboard?
Look at the line chart. What patterns do you notice in the transactions? Why would auditors be interested in the dips, or days with low transactions?
As an auditor would you be more likely to find risk in supplier groups with large total amounts and large number of orders or large total amounts and small number of orders? Why?
Move your cursor over the data point on the day with the fewest transactions on the line chart. What is (are)the supplier name(s)? Clear your selection when you are finished.
Click out of the top supplier to reset the filter then click the day with the fewest transactions on the line chart.How many transactions take place on that day?
Showing 400 - 500
of 1576
1
2
3
4
5
6
7
8
9
10
11
12
13
14
15
Last
Step by Step Answers