New Semester
Started
Get
50% OFF
Study Help!
--h --m --s
Claim Now
Question Answers
Textbooks
Find textbooks, questions and answers
Oops, something went wrong!
Change your search query and then try again
S
Books
FREE
Study Help
Expert Questions
Accounting
General Management
Mathematics
Finance
Organizational Behaviour
Law
Physics
Operating System
Management Leadership
Sociology
Programming
Marketing
Database
Computer Network
Economics
Textbooks Solutions
Accounting
Managerial Accounting
Management Leadership
Cost Accounting
Statistics
Business Law
Corporate Finance
Finance
Economics
Auditing
Tutors
Online Tutors
Find a Tutor
Hire a Tutor
Become a Tutor
AI Tutor
AI Study Planner
NEW
Sell Books
Search
Search
Sign In
Register
study help
business
data analytics accounting
Data Analytics for Accounting 1st edition Vernon Richardson - Solutions
How does the systems translator software work? How does it store the merged data into a data warehouse?
Is it possible for multinational firms to have many different financial reporting systems and ERP packages all in use at the same time?
Is it possible for a firm to have general journals from a product like JD Edwards actually reconcile to the general ledger in SAP? Why or why not?
Why has most innovation in Data Analytics originated more in an internal audit than an external audit? Or if not, why not?
In your opinion, is the primary reason that analysts use inappropriate scales for their charts primarily due to an error related to naivete (or ineffective training), or are the inappropriate scales used so the analyst can sway the audience one way or the other?
Datavizcatalogue.com lists seven types of maps in its listing of charts. Which one would you use to assess geographic customer concentration by number? How could you show if some customers buy more than other customers on such a map? Would you use the same chart or a different one?
The Big 4 accounting firms (Deloitte, EY, KPMG, and PwC) dominate the audit and tax market in the United States. What chart would you use to show which accounting firm dominates in each state in terms of audit revenues? Any there other interesting ways you could use to find opportunities within the
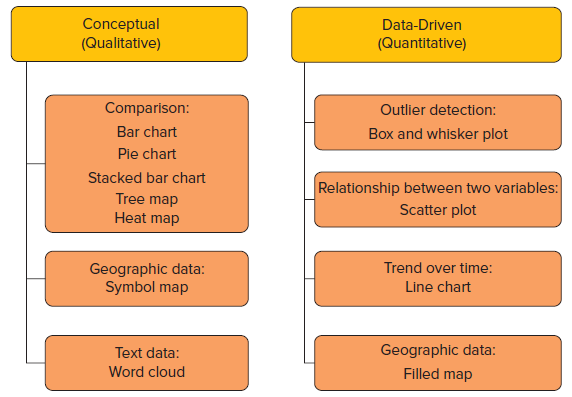
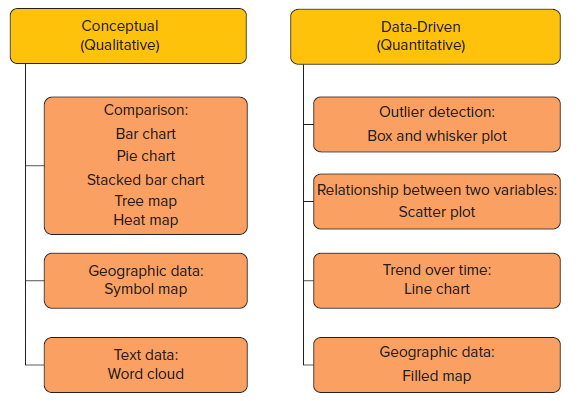
According to Exhibit 4-8, which is the best chart for static composition of a data item of the Accounts Receivable balance at the end of the year? Which is best for showing a change in composition of Accounts Receivable over two or more periods?Exhibit 4-8 Conceptual (Qualitative) Data-Driven
According to Exhibit 4-8, which is the best chart for comparisons of earnings per share over many periods? How about for only a few periods?Exhibit 4-8 Conceptual (Qualitative) Data-Driven (Quantitative) Comparison: Outlier detection: Bar chart Box and whisker plot Pie chart Stacked bar chart
Evaluate the use of multiple colors in the graphic associated with the opening vignette regarding the 2016 presidential election. Would you consider its use effective or ineffective? Why? Can you think of a better way to communicate the extent to which pollsters incorrectly predicted the outcome in
Why was the graphic associated with the opening vignette regarding the 2016 presidential election an effective way to communicate the voter outcome for 50 states? What else could have been used to communicate this, and would it have been more or less effective in your opinion?
According to the text and your own experience, why is Tableau ideal for exploratory data analysis?
The text mentions, “If your data analysis project is more declarative than exploratory, it is more likely that you will perform your data visualization to communicate results in Excel.” In your opinion, why is this true?
What would be the best chart to use to illustrate earnings per share for one company over the past five years?
Based on the data from datavizcatalogue.com, how does a box and whisker plot show if the data are symmetrical?
Based on the data from datavizcatalogue.com, what are some major flaws of using word clouds to communicate the frequency of words in a document?
Based on the data from datavizcatalogue.com, a line graph is best at showing comparisons, relationships, compositions, or distributions? Name the best two.
Box and whisker plots (or box plots) are particularly adept at showing extreme observations and outliers. In what situations would it be important to communicate these data to a reader? Any particular accounts on the balance sheet or income statement?
According to Exhibit 4-8, which is the best chart for showing a distribution of a single variable, like height? How about hair color? Major in college?Exhibit 4-8 Conceptual (Qualitative) Data-Driven (Quantitative) Comparison: Outlier detection: Bar chart Box and whisker plot Pie chart Stacked bar
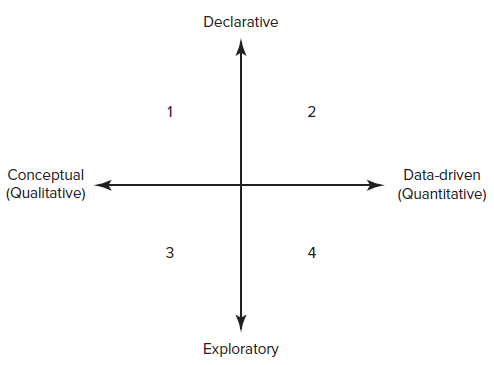
Explain Exhibit 4-2 and why these four dimensions are helpful in describing information to be communicated? Exhibit 4-2 lists conceptual and data-driven as being on two ends of the continuum. Does that make sense, or can you think of a better way to organize and differentiate the different chart
Name three accounts that would be appropriate and interesting to apply Benford’s law in auditing those accounts. Why would an auditor choose those three accounts? When would a departure from Benford’s law encourage the auditor to investigate further?
How could an investor use XBRL to do an analysis of the industry’s inventory turnover?
Why would the use of data reduction be useful to highlight related party transactions (e.g., CEO has her own separate company that the main company does business with)?
How might clustering be used to explain customers that owe us money (accounts receivable)?
An auditor is trying to figure out if the goodwill its client recognized when it purchased a factory has become impaired. What characteristics might be used to help establish a model predicting goodwill impairment?
An auditor is trying to figure out if the inventory at an electronics store chain is obsolete. What characteristics might be used to help establish a model predicting inventory obsolescence?
How could the fuzzy match be used to find undisclosed related party transactions that might need to be disclosed?
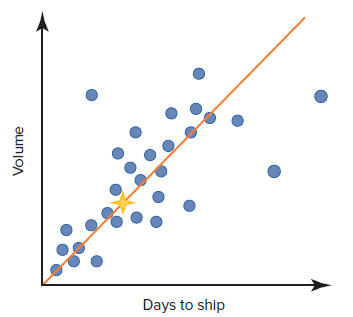
Exhibits 3-1, 3-2, 3-3, and 3-4 suggest that volume and distance are the best predictors of “days to ship” for a wholesale company. Any other variables that would also be useful in predicting the number of “days to ship”?Exhibits 3-4 Days to ship Volume
Compare and contrast the profiling data approach and the development of standard cost for a unit of production at a manufacturing company. Are they substantially the same, or do they have differences?
How does fuzzy match work? Give an accounting situation where it might be most useful.
How is similarity matching different from clustering?
How might classification be used in approving or denying a potential fraudulent credit card transaction?
How might the data reduction approach be used in auditing?
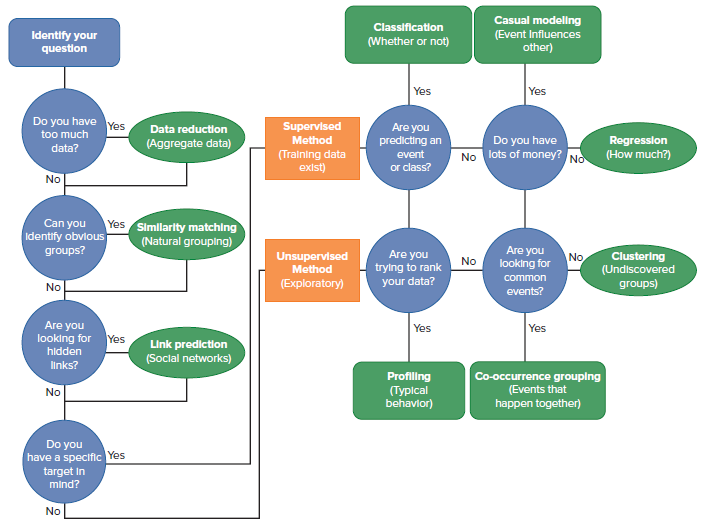
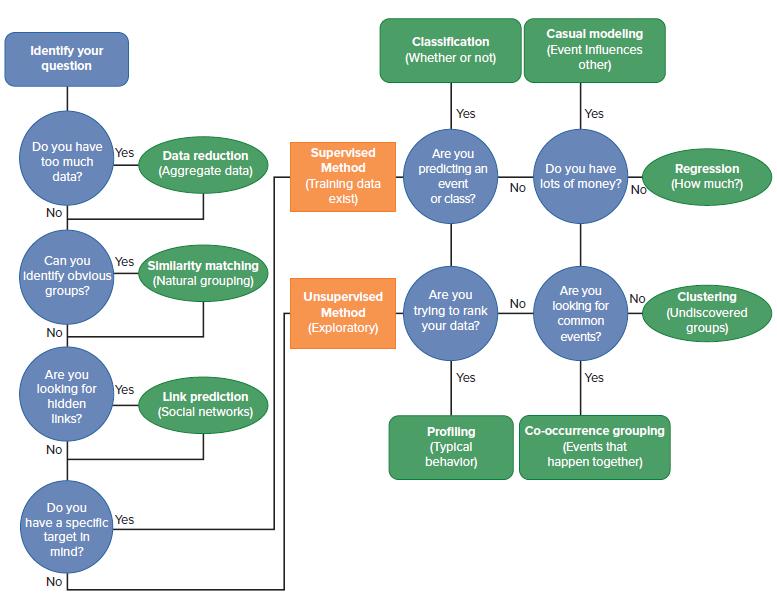
Using Exhibit 3-5 as a guide, what are three data approaches associated with the unsupervised approach?Exhibit 3-5 Casual modellng (Event Influences other) Classification Identify your question (Whether or not) Yes Yes Do you have too much Yes Supervised Method (Tralning data exist) Are you
Using Exhibit 3-5 as a guide, what are three data approaches associated with the supervised approach?Exhibit 3-5 Casual modelling Classification Identify your question (Event Influences other) (Whether or not) Yes Yes Do you have Yes Supervised Method Are you predicting an event or class? Data
What is the difference between training datasets and test (or testing) datasets?
What is the difference between a supervised and an unsupervised approach?
If you were conducting a data analysis in order to compare the percentage of students who receive federal loans at universities above and below the median cost of attendance across all institutions, you would be conducting several steps in your analysis. What question needs to be answered first in
If you were analyzing the levels of diversity across public and private institutions using the College Scorecard data, how would you define diversity in terms of the data provided? Would it be beneficial to combine fields?
Use the College Scorecard data to determine if different regions of the country have significantly different costs of attendance (same as Problem 6 above) and fill out a data request form in order to extract the appropriate data. Use the template from the chapter as a guide.
Which attributes from the College Scorecard data would you need to determine if different regions of the country have significantly different costs of attendance?
Which attributes from the College Scorecard data would you need to compare the percentage of students who receive federal loans at universities above and below the median cost of attendance across all institutions (public, private non-profit, or private for-profit)?
Which attributes from the College Scorecard data would you need to compare completion rate across types of institutions (public, private non-profit, or private for-profit)?
Which attributes from the College Scorecard data would you need to compare levels of diversity across types of institutions (public, private non-profit, or private for-profit)?
Which attributes from the College Scorecard data would you need to compare SAT scores across types of institutions (public, private non-profit, or private for-profit)?
Which attributes from the College Scorecard data would you need to compare cost of attendance across types of institutions (public, private non-profit, or private for-profit)?
In the ETL process, one important step to process when transforming the data is to work with NULL, N/A, and zero values in the dataset. If you have a field of quantitative data (e.g., number of years each individual in the table has held a full-time job), what would be the effect of the
Regarding the data request form, why do you think it is important to the database administrator to know the purpose of the request? What would be the importance of the “To be used in” and “intended audience” fields?
In the ETL process, when an analyst is completing the data request form, there are a number of fields that the analyst is required to complete. Why do you think it is important for the analyst to indicate the frequency of the report? How do you think that would affect what the database
In the ETL process, if the analyst does not have the security permissions to access the data directly, then he or she will need to fill out a data request form. While this doesn’t necessarily require the analyst to know extraction techniques, why does the analyst still need to understand the raw
In the ETL process, the first step is extracting the data. When you are obtaining the data yourself, what are the steps to identifying the data that you need to extract?
What is the purpose of a data dictionary? Identify four different attributes that could be stored in a data dictionary, and describe the purpose of each.
Among the advantages of using a relational database is enforcing business rules. Based on your understanding of how the structure of a relational database helps prevent data redundancy and other advantages, how does the primary key/foreign key relationship structure help enforce a business rule
Even though it is preferable to store data in a relational database, storing data across separate tables can make data analysis cumbersome. Describe three reasons why it is worth the trouble to store data in a relational database.
The advantages of a relational database include integrating business processes. Why is it preferable to integrate business processes in one information system, rather than store different business process data in separate, isolated databases?
The advantages of a relational database include limiting the amount of redundant data that are stored in a database. Why is this an important advantage? What can go wrong when redundant data are stored?
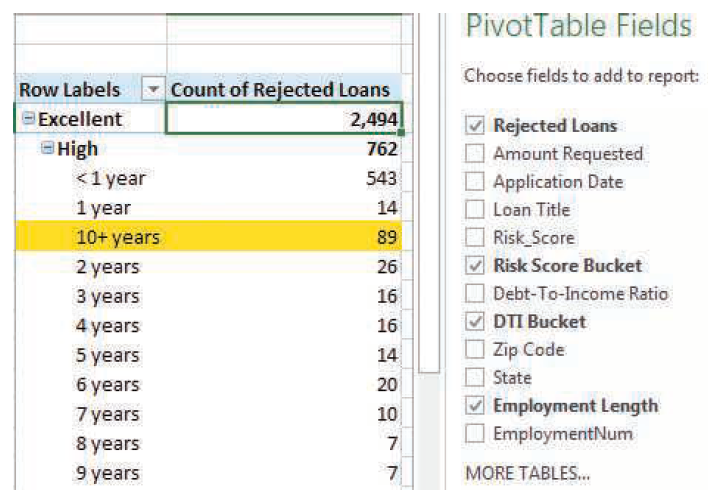
Consider the 2013 declined loan data from LendingClub titled “RejectStatsB2013.” Similar to the analysis done in the chapter, let’s scrub the employment length. Because our analysis requires risk scores, debt-to-income data, and employment length, we need to make sure each of them has valid
Consider the 2013 declined loan data from LendingClub titled “RejectStatsB2013.” Similar to the analysis done in the chapter, let’s scrub the debt-to-income data. Because our analysis requires risk scores, debt-to-income data, and employment length, we need to make sure each of them has valid
Consider the 2013 declined loan data from LendingClub titled “RejectStatsB2013” from the Connect website. Similar to the analysis done in the chapter, let’s scrub the risk score data. First, because our analysis requires risk scores, debt-to-income data, and employment length, we need to make
Download the rejected loans dataset of LendingClub data titled “RejectStatsA Ready” from the Connect website and do an Excel PivotTable by state; then figure out the number of rejected applications for each state. Reorder these and make a graph ordering the states and the number of rejected
Download the rejected loans dataset of LendingClub data titled “RejectStatsA Ready” from the Connect website and do an Excel PivotTable by state; then figure out the number of rejected applications for the state of Arkansas. That is, count the loans by state and compute the percentage of the
Download and consider the rejected loans data set of Lending Club data titled “Reject Stats A Ready.” Given the analysis performed in the chapter, what three items do you believe would be most useful in predicting loan acceptance or rejection? What additional data do you think could be
Download and consider the data dictionary file “LCData Dictionary,” specifically the Loan Stats tab. This represents the data dictionary for the loans that were funded. Seeing all of the data attributes listed there, which attributes do you think might predict which loans will go delinquent and
To address the question “Will I receive a loan from Lending Club?” we had available data to assess the relationship among (1) the debt-to-income ratios and number of rejected loans, (2) the length of employment and number of rejected loans, and (3) the credit (or risk) score and number of
Why might the debt-to-income attribute included in the declined loans data set considered in the chapter be a predictor of declined loans? How about the credit (risk) score?
Which data approach might be used to assess the appropriate level of the allowance for doubtful accounts?
Auditors will frequently use the data reduction approach when considering potentially risky transactions. Provide an example of why focusing on a portion of the total number of transactions might be important for auditors to assess risk.
What data approach mentioned in the chapter might be used by Facebook to find friends?
In the chapter, we mentioned eight different data approaches. Which data approach was used by Alibaba, as mentioned in the chapter-opening vignette?
What is included in mastering the data as part of the IMPACT cycle described in the chapter?
Why is identifying the question such a critical first step in the IMPACT process cycle?
Describe the IMPACT cycle. Why does its order of the processes and its recursive nature make sense?
How might Data Analytics be used in financial reporting? And how might it be used in doing tax planning?
Give an example of how Data Analytics creates value for accounting.
Give an example of how Data Analytics creates value for businesses.
Define Data Analytics and explain how a university might use its techniques to recruit and attract potential students.
Showing 1500 - 1600
of 1576
First
2
3
4
5
6
7
8
9
10
11
12
13
14
15
16
Step by Step Answers