New Semester
Started
Get
50% OFF
Study Help!
--h --m --s
Claim Now
Question Answers
Textbooks
Find textbooks, questions and answers
Oops, something went wrong!
Change your search query and then try again
S
Books
FREE
Study Help
Expert Questions
Accounting
General Management
Mathematics
Finance
Organizational Behaviour
Law
Physics
Operating System
Management Leadership
Sociology
Programming
Marketing
Database
Computer Network
Economics
Textbooks Solutions
Accounting
Managerial Accounting
Management Leadership
Cost Accounting
Statistics
Business Law
Corporate Finance
Finance
Economics
Auditing
Tutors
Online Tutors
Find a Tutor
Hire a Tutor
Become a Tutor
AI Tutor
AI Study Planner
NEW
Sell Books
Search
Search
Sign In
Register
study help
business
data analytics accounting
ISE Data Analytics For Accounting 3rd Edition Ryan A. Teeter, Vernon Richardson, Katie L. Terrell - Solutions
(LO 4-3) Line charts are not recommended for what type of data?a. Normalized datab. Qualitative datac. Continuous datad. Trend lines
(LO 4-2) _____ data would be considered the most sophisticated type of data.a. Ratiob. Intervalc. Ordinald. Nominal
(LO 4-2) _____ data would be considered the least sophisticated type of data.a. Ratiob. Intervalc. Ordinald. Nominal
(LO 4-2) The Fahrenheit scale of temperature measurement would best be described as an example of:a. interval data.b. discrete data.c. nominal data.d. continuous data.
(LO 4-2) Which of the following is not a typical example of nominal data?a. Genderb. SAT scoresc. Hair colord. Ethnic group
(LO 4-5) Justin Zobel suggests that revising your writing requires you to “be egoless—ready to dislike anything you have previously written,” suggesting that it is _____ you need to please.a. yourselfb. the readerc. the customerd. your boss
(LO 4-1) Anscombe’s Quartet suggests that:a. statistics should be used instead of visualizations.b. visualizations should be used instead of statistics.c. visualizations should be used in tandem with statistics.
For the programmers who will be in charge of creating a report that contains the same information that needs to be sent to the CEO on a monthly basis.Progress Checks 5 and 6 display different charts depicting the quantity of beer sold on each day in the Sláinte Sales Subset dataset. If you had
For the CEO of the brewery who is interested in how well the different products are performing.Progress Checks 5 and 6 display different charts depicting the quantity of beer sold on each day in the Sláinte Sales Subset dataset. If you had created those visuals, starting with the data request form
Often, external consultants will use a firm’s color scheme for a data visualization or will use a firm’s logo for points on a scatter plot. While this might be a great approach to support a corporate culture, it is often not the most effective way to create a chart. Why would these methods harm
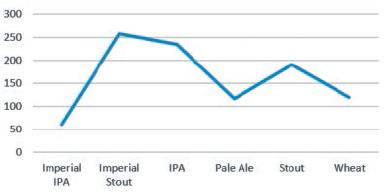
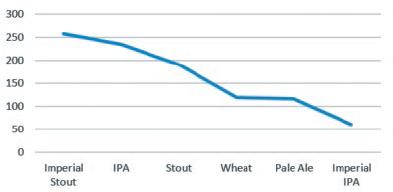
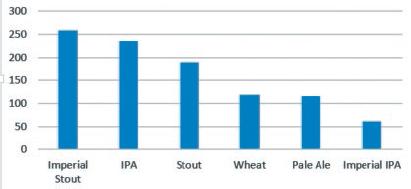
The following four charts represent the exact same data quantity of each beer sold. Which do you prefer, the line chart or the column chart? Whichever you chose, line or column, which of the pair do you think is the easiest to digest?a.b.c.d. 300 250 200 150 100 50 0 Imperial Imperial IPA Pale Ale
The same dataset was consolidated into quarters. This chart was made with the chart wizard feature in Excel, which made the creation of it easy, but something went wrong. Can you identify what went wrong with this chart?
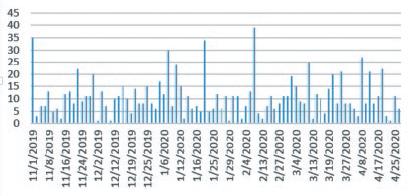
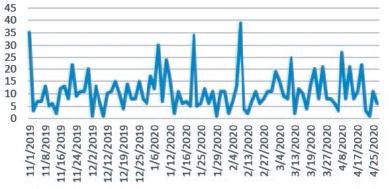
The following two charts represent the exact same data—the quantity of beer sold on each day in the Sláinte Sales Subset dataset. Which chart is more appropriate for working with dates, the column chart or the line chart? Which do you prefer? Why?a.b. 11/1/2019 11/8/2019 11/16/2019 11/24/2019
Identify which type of data scale the following variables are measured on(qualitative nominal, qualitative ordinal, or quantitative):a. Instructor evaluations in which students select excellent, good, average, or poor.b. Weekly closing price of gold throughout a year.c. Names of companies listed on
Using the Internet or other resources (other textbooks, a newspaper, or a magazine), identify an example of a data visualization for each possible quadrant.
What are two ways that complicated concepts were explained to you via categorization and data visualization as you were growing up?
Communicate your results in a written report.
Refine your chart to communicate efficiently and effectively.
Choose the best chart for your dataset.
2. Determine the purpose of your data visualization.
Differentiate between communicating results using statistics and visualizations.
Consider the adjusted r-squared values for both models you created. How would you describe the relative impact of the BANK-dummy variable on the overall model?
How would you interpret the relative impact of the Online-Dummy variable versus the BANK-Dummy variable in plain English?
What is the expected transaction amount for a customer who uses their credit card for an online purchase?
What is the coefficient for the Online-Dummy variable? (Careful—it is not the same as it was in the simple regression output!)
What is the coefficient for the BANK-Dummy variable?
How would you interpret the results of your analysis of Q1 in plain English? What does it imply to have both a very low R Square value and a very low Significance F value or p-value?
Based on the results of this hypothesis test, how would you adjust analyzing transactions based in Arkansas?
Based on the results of this hypothesis test, what would you recommend to Dillard’s regarding online versus in-person sales?
Describe in plain English what the results of this t-test mean.
If you completed the Excel track, what is the Significance F value?
What is the p-value provided for the explanatory variable?
What is the R Square value?
Using the regression formula, what is the predicted amount a customer will spend on an online transaction?
Using an alpha of 0.05 (5 percent), should you reject or fail to reject the null hypothesis?
What is the p-value for the one-tailed test?
What insights can you derive from comparing the two box plots?
What is the median transaction for online transactions?
What is the median transaction for in-person transactions?
What is the highest outlier for online transactions?
What is the highest outlier from the in-person transactions?
Why is the average for TRAN_AMT so much less than the averages for ORIG_PRICE and SALE_PRICE?
What is the maximum for SALE_PRICE?
What is the maximum for ORIG_PRICE?
Which field has the highest average (mean)?
Identifying the cause and effect as you did in Q2 can help you determine the explanatory and response variables. Which variable, SAT average or completion rate, is the explanatory variable?
When determining relationships between variables, one of the criteria for a potential causal relationship is that the cause must happen before the effect. Regarding SAT average and completion rate, which would you determine to be the potential cause? Which would be the effect?
Would you expect SAT average and completion rate to be correlated? If so, would you expect the correlation to be positive or negative?
What is the probability of college completion for a student with an SAT score of 1100?
Does SAT Average appear to be predictive of college completion rate?
What is the value of the coefficient of determination(R2)?
Compare and contrast: If you created clusters in both Power BI and Tableau, were the cluster assignments identical? Why might they be the same or different?
What do you notice about the interest rates assigned to outliers (clusters with only one or two observations)?
Would you expect interest rates to be correlated with loan amount and debt-to-income ratios? Why or why not?
How many clusters have five or more different interest rates assigned to them?
Would you expect interest rates for loans that appear in the bottom-left cluster to be high (closer to 26 percent)or low (closer to 6 percent)?
Interest rates on loans from this period range from 6 percent to 26 percent. Hover over a single value in the top-right cluster. What interest rate is assigned to this value?
If you were the employee committing fraud, what would you try to do with the data to evade detection?
What additional data would be useful to understand the nature of the matched values?
Why is only one of the fuzzy matches in the first match a likely match and not the remaining ones?
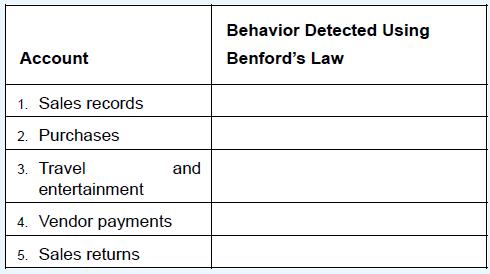
(LO 3-2) Identify the behavior, error, or fraudulent scheme that could be detected when you apply Benford’s law to the following accounts. Account 1. Sales records 2. Purchases Behavior Detected Using Benford's Law 3. Travel entertainment 4. Vendor payments 5. Sales returns and
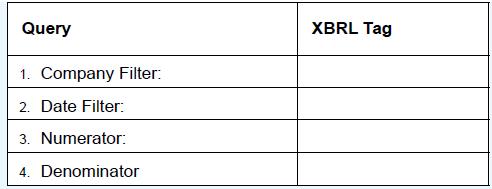
(LO 3-2) An investor wants to do an analysis of the industry’s inventory turnover using XBRL. Indicate the XBRL tags that would be used with an inventory turnover calculation. Query 1. Company Filter: 2. Date Filter: 3. Numerator: 4. Denominator XBRL Tag
(LO 3-2) Analysis: Why would the use of data reduction be useful to highlight related party transactions (e.g., CEO has their own separate company that the main company does business with)?
(LO 3-3) Analysis: How might clustering be used to describe customers who owe money (accounts receivable)?
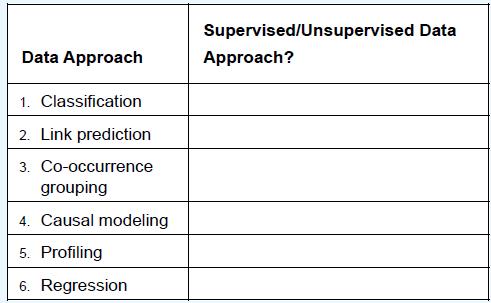
(LO 3-4) An auditor is trying to figure out if the goodwill its client recognized when it purchased another company has become impaired. What characteristics might be used to help establish a model predicting goodwill impairment? Label each of the following as either a Supervised data approach or
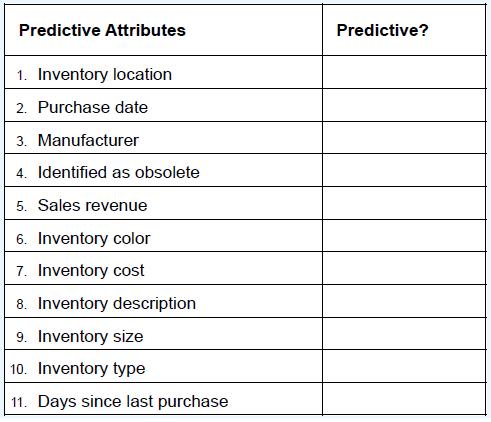
(LO 3-3) An auditor is trying to figure out if the inventory at an electronics store chain is obsolete. From the following list, identify whether each attribute would be useful for predicting inventory obsolescence or not. Predictive Attributes 1. Inventory location 2. Purchase date 3. Manufacturer
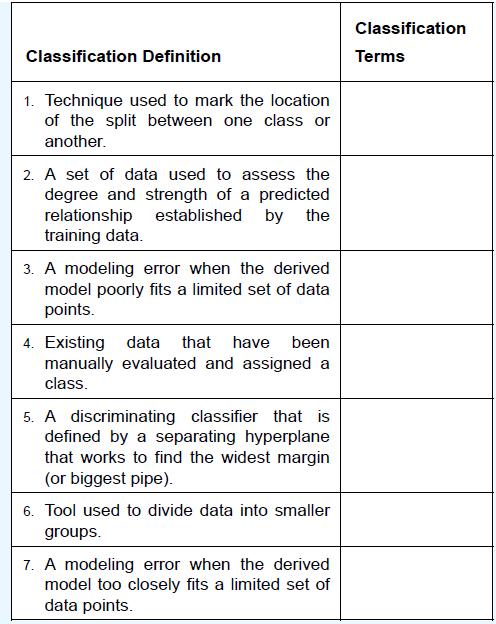
(LO 3-4) Match the classification definitions to the appropriate classification terminology:Training data Test data Decision trees Decision boundaries Support vector machine Overfitting Underfitting Classification Definition 1. Technique used to mark the location of the split between one class or
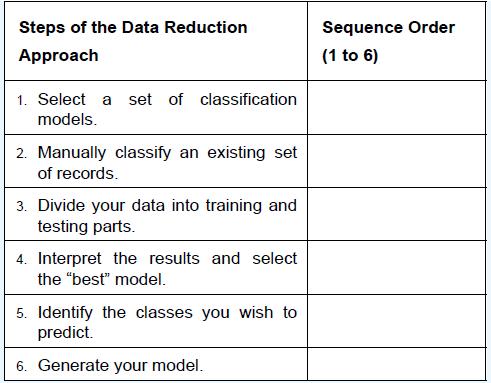
(LO 3-4) Identify the order sequence in the classification approach to descriptive analytics (i.e., 1 is first; 6 is last). Steps of the Data Reduction Approach 1. Select a set of classification models. 2. Manually classify an existing set of records. 3. Divide your data into training and testing
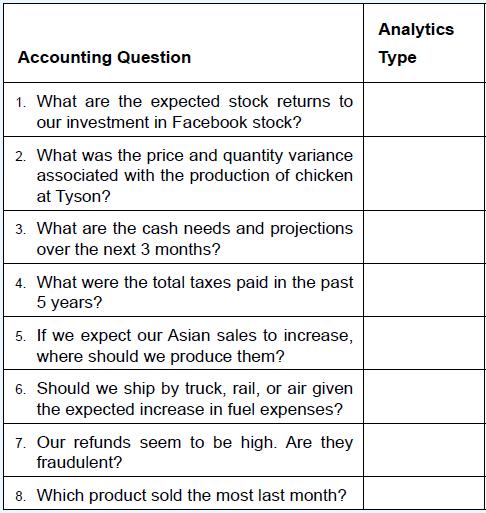
(LO 3-1) Match the accounting question to the appropriate type of Data Analytics:Descriptive analytics Diagnostic analytics Predictive analytics Prescriptive analytics Accounting Question 1. What are the expected stock returns to our investment in Facebook stock? 2. What was the price and quantity
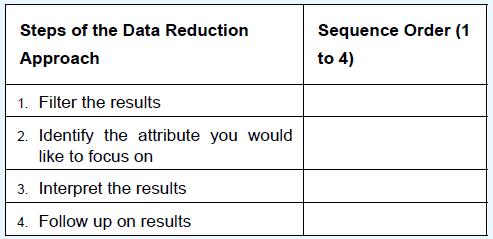
(LO 3-2) Identify the order sequence in the data reduction approach to descriptive analytics (i.e., 1 is first; 4 is last). Steps of the Data Reduction Approach 1. Filter the results 2. Identify the attribute you would like to focus on 3. Interpret the results 4. Follow up on results Sequence Order
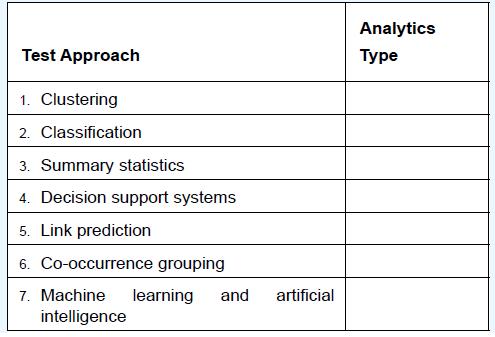
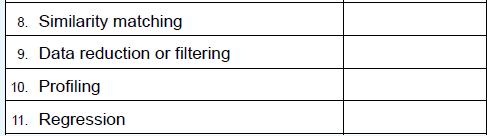
(LO 3-1) Match the test approach to the appropriate type of Data Analytics:Descriptive analytics Diagnostic analytics Predictive analytics Prescriptive analytics Test Approach 1. Clustering 2. Classification 3. Summary statistics 4. Decision support systems 5. Link prediction 6. Co-occurrence
(LO 3-4) Exhibits 3-14, 3-15, and 3-18 suggest that volume and distance are the best predictors of “days to ship” for a wholesale company. What other variables would also be useful in predicting the number of “days to ship”?
(LO 3-3) Compare and contrast the profiling data approach and the development of standard cost for a unit of production at a manufacturing company. Discuss how these approaches are similar and how they are different.
(LO 3-3) How does fuzzy match work? Give an accounting situation where it might be most useful.
(LO 3-3) How is similarity matching different from clustering?
(LO 3-4) How might classification be used in approving or denying a potential fraudulent credit card transaction?
(LO 3-3) How might the data reduction approach be used in auditing?
(LO 3-1) Using Exhibit 3-1 as a guide, what are four data approaches associated with the diagnostic analytics approach?
(LO 3-1) Using Exhibit 3-1 as a guide, what are two data approaches associated with the descriptive analytics approach?
(LO 3-4) What is the difference between training datasets and test (or testing)datasets?
(LO 3-3) What is the difference between a supervised and an unsupervised approach?
(LO 3-4) What is the difference between a target and a class?
(LO 3-1) Which approach to Data Analytics attempts to assign each unit in a population into a small set of classes where the unit belongs?a. Classificationb. Regressionc. Similarity matchingd. Co-occurrence grouping
(LO 3-3) Auditing financial statements, looking for errors, anomalies and possible fraud, is most consistent with which type of analytics?a. Descriptive analyticsb. Diagnostic analyticsc. Predictive analyticsd. Prescriptive analytics
(LO 3-4) In general, the simpler the model, the greater the chance of:a. overfitting the data.b. underfitting the data.c. pruning the data.d. the need to reduce the amount of data considered.
(LO 3-4) In general, the more complex the model, the greater the chance of:a. overfitting the data.b. underfitting the data.c. pruning the data.d. a more accurate prediction of the data.
(LO 3-1) Which approach to Data Analytics attempts to predict a relationship between two data items?a. Similarity matchingb. Classificationc. Link predictiond. Co-occurrence grouping
(LO 3-3) An observation about the frequency of leading digits in many real-life sets of numerical data is called:a. leading digits hypothesis.b. Moore’s law.c. Benford’s law.d. clustering.
(LO 3-4) _____ is a set of data used to assess the degree and strength of a predicted relationship.a. Training datab. Unstructured datac. Structured datad. Test data
How do machine learning and artificial intelligence models improve their recommendations over time?
How might you expect managers to use decision support systems when evaluating employee bonuses?
If we are trying to predict whether a loan will be rejected, would you expect credit score to be positively or negatively associated with loan rejection by a bank such as LendingClub?
If we are trying to predict the extent of employee turnover, do you believe the health of the economy, as measured using GDP, will be positively or negatively associated with employee turnover?
In Exhibit 3-12, Cluster 1 of the group insurance highlighted claims have a long period from death to payment dates. Why would that cluster be of interest to internal auditors?
Name three clusters of customers who might shop at Walmart.
Identify a reason the sales amount of any single product may or may not follow Benford’s law.
How does Benford’s law provide an expectation of any set of naturally occurring collections of numbers?
Explain how XBRL might be used by lenders to focus on specific areas of interest.
Describe how the data reduction approach could be used to evaluate employee travel and entertainment expenses.
What is the main difference between descriptive and diagnostic methods?
Showing 700 - 800
of 1576
1
2
3
4
5
6
7
8
9
10
11
12
13
14
15
Last
Step by Step Answers