New Semester
Started
Get
50% OFF
Study Help!
--h --m --s
Claim Now
Question Answers
Textbooks
Find textbooks, questions and answers
Oops, something went wrong!
Change your search query and then try again
S
Books
FREE
Study Help
Expert Questions
Accounting
General Management
Mathematics
Finance
Organizational Behaviour
Law
Physics
Operating System
Management Leadership
Sociology
Programming
Marketing
Database
Computer Network
Economics
Textbooks Solutions
Accounting
Managerial Accounting
Management Leadership
Cost Accounting
Statistics
Business Law
Corporate Finance
Finance
Economics
Auditing
Tutors
Online Tutors
Find a Tutor
Hire a Tutor
Become a Tutor
AI Tutor
AI Study Planner
NEW
Sell Books
Search
Search
Sign In
Register
study help
business
elementary statistics
Elementary Statistics Using Excel Pearson New 5th Edition Mario F Triola - Solutions
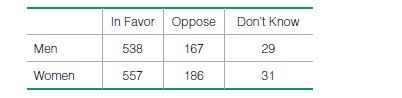
Find the number of degrees of freedom and the critical value.Questions 6–10 refer to the sample data in the following table (based on data from the Pew Research Center). Randomly selected subjects were asked about the use of marijuana for medical purposes. Assume that we want to use a 0.05
Is the hypothesis test left-tailed, right-tailed, or two-tailed?Questions 6–10 refer to the sample data in the following table (based on data from the Pew Research Center). Randomly selected subjects were asked about the use of marijuana for medical purposes. Assume that we want to use a 0.05
What distribution is used to test the stated claim (normal, t, F, chi-square, uniform)?Questions 6–10 refer to the sample data in the following table (based on data from the Pew Research Center). Randomly selected subjects were asked about the use of marijuana for medical purposes. Assume that we
Identify the null and alternative hypotheses corresponding to the stated claim.Questions 6–10 refer to the sample data in the following table (based on data from the Pew Research Center). Randomly selected subjects were asked about the use of marijuana for medical purposes. Assume that we want to
Given that the P-value for the hypothesis test is 0.971, what do you conclude?
If using a 0.05 significance level to test the stated claim, find the number of degrees of freedom and the critical value.
Is the hypothesis test left-tailed, right-tailed, or two-tailed?
When testing the claim in Question 1, what are the observed and expected frequencies for Monday?
What are the null and alternative hypotheses corresponding to the stated claim?
Using Yates’s Correction for Continuity The chi-square distribution is continuous, whereas the test statistic used in this section is discrete. Some statisticians use Yates’s correction for continuity in cells with an expected frequency of less than 10 or in all cells of a contingency table
Equivalent Tests A x2 test involving a 2 * 2 table is equivalent to the test for the difference between two proportions. Using the claim and table in Example 4, verify that the x2 test statistic and the z test statistic (found from the test of equality of two proportions) are related as follows:z2
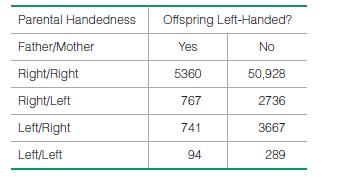
Genetics and Handedness In a study of left-handedness as a possible inherited trait, the data in the table below were obtained (based on data from “Why Are Some People Left-Handed? An Evolutionary Perspective,” by Laurens and Faurie, Philosophical Transactions, Vol.364). Use a 0.01 significance
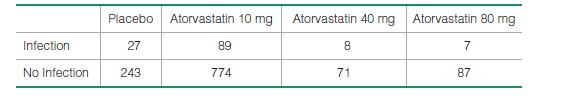
Clinical Trial of Lipitor Lipitor is the trade name of the drug atorvastatin, which is used to reduce cholesterol in patients. (Until its patent expired in 2011, this was the largest-selling drug in the world, with annual sales of $13 billion.) Adverse reactions have been studied in clinical
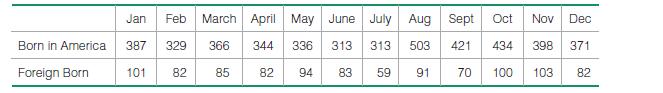
Baseball Player Births In his book Outliers, author Malcolm Gladwell argues that more American-born baseball players have birthdates in the months immediately following July 31 because that was the cutoff date for nonschool baseball leagues. The table below lists months of births for a sample of
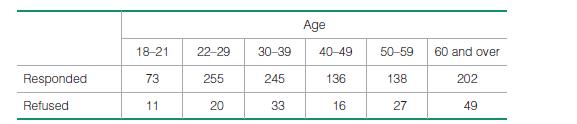
Survey Refusals A study of people who refused to answer survey questions provided the randomly selected sample data shown in the table below (based on data from “I Hear You Knocking But You Can’t Come In,” by Fitzgerald and Fuller, Sociological Methods and Research, Vol. 11, No. 1). At the
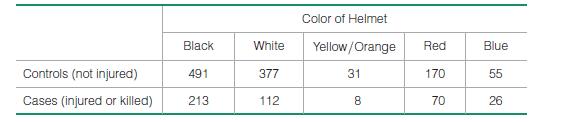
Injuries and Motorcycle Helmet Color A case-control (or retrospective) study was conducted to investigate a relationship between the colors of helmets worn by motorcycle drivers and whether they are injured or killed in a crash. Results are given in the table below (based on data from “Motorcycle
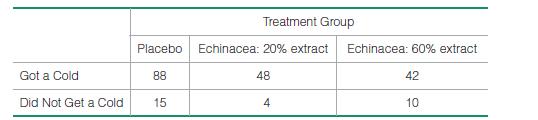
Clinical Trial of Echinacea In a clinical trial of the effectiveness of echinacea for preventing colds, the results in the table below were obtained (based on data from “An Evaluation of Echinacea Angustifolia in Experimental Rhinovirus Infections,” by Turner et al., New England Journal of
Is Seat Belt Use Independent of Cigarette Smoking? A study of seat belt users and nonusers yielded the randomly selected sample data summarized in the given table (based on data from “What Kinds of People Do Not Use Seat Belts?” by Helsing and Comstock, American Journal of Public Health, Vol.
Soccer Strategy In soccer, serious fouls result in a penalty kick with one kicker and one defending goalkeeper. The table below summarizes results from 286 kicks during games among top teams (based on data from “Action Bias Among Elite Soccer Goalkeepers: The Case of Penalty Kicks,” by Bar-Eli
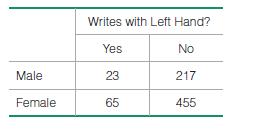
Lefties A random sample of 760 subjects was obtained, and each was tested for left-hand writing. Results are in the table below (based on data from “The Left-Handed: Their Sinister History,” by Elaine Fowler Costas, Education Resources Information Center, Paper 399519).Use a 0.05 significance
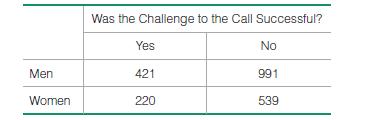
Tennis Challenges The table below shows results since 2006 of challenged referee calls in the U.S. Open. Use a 0.05 significance level to test the claim that the gender of the tennis player is independent of whether the call is overturned. Was the Challenge to the Call Successful? Yes No Men 421
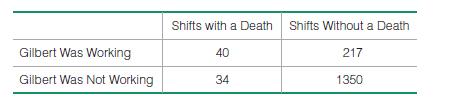
Nurse a Serial Killer? Alert nurses at the Veteran’s Affairs Medical Center in Northampton, Massachusetts, noticed an unusually high number of deaths at times when another nurse, Kristen Gilbert, was working. Those same nurses later noticed missing supplies of the drug epinephrine, which is a
Is Sentence Independent of Plea? Many people believe that criminals who plead guilty tend to get lighter sentences than those who are convicted in trials. The accompanying table summarizes randomly selected sample data for San Francisco defendants in burglary cases(based on data from “Does It Pay
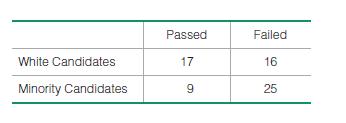
Discrimination The U.S. Supreme Court considered a case involving the exam for firefighter lieutenant in the city of New Haven, Connecticut. Results from the exam are shown in the table below. Is there sufficient evidence to support the claim that results from the test should be thrown out because
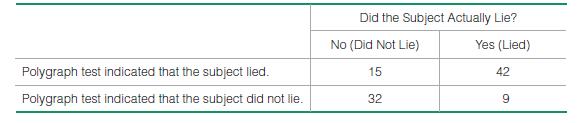
Testing a Lie Detector The table below includes results from polygraph (lie detector)experiments conducted by researchers Charles R. Honts (Boise State University) and Gordon H. Barland (Department of Defense Polygraph Institute). In each case, it was known if the subject lied or did not lie, so
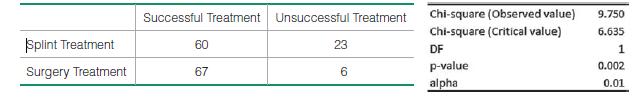
Which Treatment Is Better? A randomized controlled trial was designed to compare the effectiveness of splinting versus surgery in the treatment of carpal tunnel syndrome. Results are given in the table below (based on data from “Splinting vs. Surgery in the Treatment of Carpal Tunnel Syndrome,”
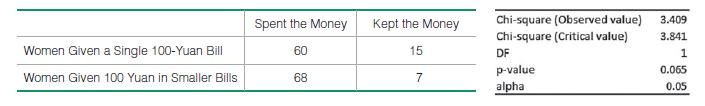
Denomination Effect In a study of the “denomination effect” described in the Chapter Problem, 150 women in China were given either a single 100 Yuan bill or a total of 100 Yuan in smaller bills. The value of 100 Yuan is about $15. The women were given the choice of spending the money on
Right-Tailed, Left-Tailed, Two-Tailed Is the hypothesis test in Exercise 1 right-tailed, left-tailed, or two-tailed? Explain your choice.
Degrees of Freedom and Critical Value For the hypothesis test in Exercise 1, the test statistic is 3.062. Find the number of degrees of freedom used to find the critical value, then find the critical value. Assume a 0.05 significance level.
Terminology The table in Exercise 1 is called a contingency table or two-way table. Why is the term contingency used? Why is the terminology of two-way table used?
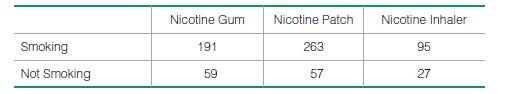
Smoking Cessation The accompanying table summarizes successes and failures when subjects used different methods when trying to stop smoking. The determination of smoking or not smoking was made five months after the treatment was begun, and the data are based on results from the Centers for Disease
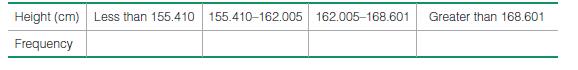
Testing Goodness-of-Fit with a Normal Distribution Refer to Data Set 1 in Appendix:Data Sets for the 40 heights of females.a. Enter the observed frequencies in the preceding table.b. Assuming a normal distribution with mean and standard deviation given by the sample mean and standard deviation,
Author’s Computer Files The author recorded the leading digits of the sizes of the files stored on his computer, and the leading digits have frequencies of 45, 32, 18, 12, 9, 3, 13, 9, and 9 (corresponding to the leading digits of 1, 2, 3, 4, 5, 6, 7, 8, and 9, respectively). Using a 0.05
Tax Cheating? Frequencies of leading digits from IRS tax files are 152, 89, 63, 48, 39, 40, 28, 25, and 27 (corresponding to the leading digits of 1, 2, 3, 4, 5, 6, 7, 8, and 9 respectively, based on data from Mark Nigrini, who sells software for Benford data analysis). Using a 0.05 significance
Author’s Check Amounts Exercise 21 lists the observed frequencies of leading digits from amounts on checks from seven suspect companies. Here are the observed frequencies of the leading digits from the amounts on checks written by the author: 68, 40, 18, 19, 8, 20, 6, 9, 12.(Those observed
Detecting Fraud When working for the Brooklyn district attorney, investigator Robert Burton analyzed the leading digits of the amounts from 784 checks issued by seven suspect companies. The frequencies were found to be 0, 15, 0, 76, 479, 183, 8, 23, and 0, and those digits correspond to the leading
Do World War II Bomb Hits Fit a Poisson Distribution? In analyzing hits by V-1 buzz bombs in World War II, South London was subdivided into regions, each with an area of 0.25 km2. Shown below is a table of actual frequencies of hits and the frequencies expected with the Poisson distribution. Use
M&M Candies Mars, Inc. claims that its M&M plain candies are distributed with the following color percentages: 16% green, 20% orange, 14% yellow, 24% blue, 13% red, and 13% brown. Refer to Data Set 20 in Appendix: Data Sets and use the sample data to test the claim that the color distribution is as
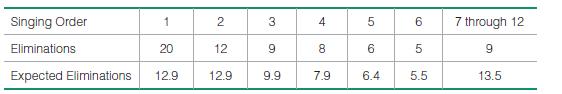
American Idol The contestants on the TV show American Idol try to win a singing contest.At one point, the web site WhatNotToSing.com listed the actual numbers of eliminations for different orders of singing, and the expected number of eliminations was also listed.The results are in the table below.
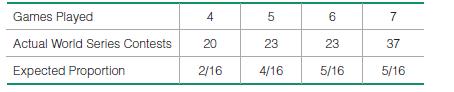
World Series Games The table below lists the numbers of games played in the baseball World Series as of this writing. That table also includes the expected proportions for the numbers of games in a World Series, assuming that in each series, both teams have about the same chance of winning. Use a
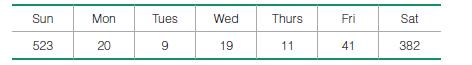
Police Calls Repeat the preceding exercise using these observed frequencies for police calls received during the month of March: Monday (208); Tuesday (224); Wednesday (246); Thursday(173); Friday (210); Saturday (236); Sunday (154). What is a fundamental error with this analysis?
Police Calls The police department in Madison, Connecticut released the following numbers of calls for the different days of the week during a recent February that had 28 days: Monday(114); Tuesday (152); Wednesday (160); Thursday (164); Friday (179); Saturday (196); Sunday(130). Use a 0.01
Win 4 Lottery The author recorded all digits selected in New York’s Win 4 Lottery for two drawings held each day in a recent year. The frequencies of the digits from 0 through 9 are 280, 303, 331, 289, 285, 294, 283, 274, 297, and 284.Use a 0.05 significance level to test the claim of lottery
Kentucky Derby The table below lists the frequency of wins for different post positions in the Kentucky Derby horse race (current as of this writing). A post position of 1 is closest to the inside rail, so that horse has the shortest distance to run. (Because the number of horses varies from year
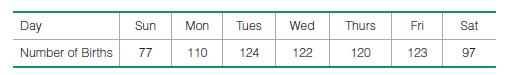
Births Records of randomly selected births were obtained and categorized according to the day of the week that they occurred (based on data from the National Center for Health Statistics). Because babies are unfamiliar with our schedule of weekdays, a reasonable claim is that births occur on the
Baseball Player Births In his book Outliers, author Malcolm Gladwell argues that more baseball players have birthdates in the months immediately following July 31, because that was the cutoff date for nonschool baseball leagues. Here is a sample of frequency counts of months of birthdates of
NYC Homicides For a recent year, the following are the numbers of homicides that occurred each month in New York City: 38, 30, 46, 40, 46, 49, 47, 50, 50, 42, 37, 37.Use a 0.05 significance level to test the claim that homicides in New York City are equally likely for each of the 12 months. Is
Testing a Slot Machine The author purchased a slot machine (Bally Model 809) and tested it by playing it 1197 times. There are 10 different categories of outcomes, including no win, win jackpot, win with three bells, and so on. When testing the claim that the observed outcomes agree with the
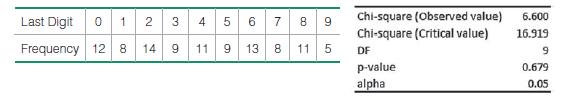
Last Digits of Heights Example 1 in this section involved an analysis of the last digits of weights from a random sample of 100 Californians. Using those same subjects, the last digits of their heights are listed in the table below (based on data from the California Department of Public Health).
Quality Family Time The accompanying XLSTAT display shows results from the claim and data given in Exercise 1.Test that claim.
Goodness-of-Fit Test For the goodness-of-fit test described in Exercise 1, identify the number of degrees of freedom and the critical value of x2, assuming a 0.05 significance level.
Do you expect the value of the x2 test statistic to be large or small? Do you expect the P-value to be large or small? Explain.
X2 Value Without performing actual calculations, examine the frequencies in the table given with Exercise
Expected Value Exercise 1 includes results from a survey of 1005 randomly selected subjects.Consider the claim that when respondents select days of the week, the seven different days have the same chance of being selected. If that claim is true for the 1005 respondents, what is the expected value
Quality Family Time The table below lists days of the week selected by a random sample of 1005 subjects who were asked to identify the day of the week that is best for quality family time (based on results from a Pillsbury survey reported in USA Today). Consider the claim that the days of the week
Multiple Regression with Old Faithful Refer to the sample data given in Exercise 1 and find the multiple regression equation with the response (y) variable of “interval-after”time and predictor (x) variables of duration and “interval-before” time. Identify the value of the multiple
Time and Motion In a physics experiment at Doane College, a soccer ball was thrown upward from the bed of a moving truck. The table below lists the time (sec) that has lapsed from the throw and the height (m) of the soccer ball. What do you conclude about the relationship between time and height?
Old Faithful Refer to the table of data given in Exercise 1 and use the durations and heights.a. Construct a scatterplot. What does the scatterplot suggest about a linear correlation between duration and height?b. Find the value of the linear correlation coefficient and determine whether there is
Old Faithful The table below lists measurements from eight different eruptions of the Old Faithful geyser in Yellowstone National Park. The data consist of the duration (sec) of the eruption, height (ft) of the eruption, time interval (min) before the eruption, and time interval (min) after the
Given that the linear correlation coefficient r is found to be 0.585, what is the proportion of the variation in diastolic blood pressure that is explained by the linear relationship between systolic and diastolic blood pressure?
Repeat the preceding exercise assuming that the linear correlation coefficient is r = 0.989.
The sample data result in a linear correlation coeffient of r = 0.585 and the regression equation yn = -1.99 + 0.698x. What is the best predicted diastolic reading given a systolic reading of 125, and how was it found?
The linear correlation coefficient r is found to be 0.585. What should you conclude?
If you plan to use a 0.05 significance level in a test of a correlation between the systolic and diastolic readings, what are the critical values of r ?
Sum of Squares Criterion In addition to the value of R2, another measurement used to assess the quality of a model is the sum of squares of the residuals. Recall from Section 3 that a residual is the difference between an observed y value and the value of y predicted from the model, which is
Stock Market Repeat the preceding exercise using all of the data values.
Stock Market Listed below in order by row are the annual high values of the Dow Jones Industrial Average for each year beginning with 1990. Use only the first 10 values (for 1990–1999) to find the best model and then predict the value for the year 2010. Is the predicted value close to the actual
Sunspot Numbers Listed below in order by row are annual sunspot numbers beginning with 1980. Is the best model a good model? Carefully examine the scatterplot and identify the pattern of the points. Which of the models fits that pattern?154.6 140.5 115.9 66.6 45.9 17.9 13.4 29.2 100.2 157.6 142.6
Bacteria Growth In a carefully controlled experiment, bacteria are allowed to grow for a week. The number of bacteria are recorded at the end of each day with these results: 20, 40, 80, 160, 320, 640, 1280.
Benford’s Law According to Benford’s law, a variety of different data sets include numbers with leading (first) digits that occur with the proportions listed in the following table. Leading Digit Proportion 1 2 3 4 5 6 7 8 9 0.301 0.176 0.125 0.097 0.079 0.067 0.058 0.051 0.046
Richter Scale The table lists different amounts (metric tons) of the explosive TNT and the corresponding value on the Richter scale used for explosions of the TNT. TNT Richter Scale 23 10 15 50 100 500 3.4 3.9 4.0 4.4 4.6 5.0
Deaths from Motor Vehicle Crashes Listed below are the numbers of deaths in the United States resulting from motor vehicle crashes. Use the best model to find the projected number of such deaths for the year 2020. Year 1975 Deaths 44,525 51,091 43,825 1980 1985 1990 1995 44,599 2000 41,817 41,945
Harry Potter Listed below are the amounts (millions of dollars) grossed during the first three weeks of the movie Harry Potter and the Half Blood Prince. Use the best model to predict the gross amount on the 22nd day of the movie’s release. Is the result close to the actual amount of $2.2
Sound Intensity The table lists intensities of sounds as multiples of a basic reference sound. A scale similar to the decibel scale is used to measure the sound intensity. Sound Intensity 316 500 750 2000 5000 Scale Value 25.0 27.0 28.75 33.0 37.0
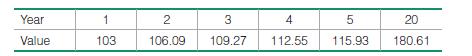
CD Value The table lists the value y (in dollars) of $100 deposited in a certificate of deposit at Bank of New York. Year 1 2 3 4 5 20 Value 103 106.09 109.27 112.55 115.93 180.61
Landscape Material The table lists the cost y (in dollars) of purchasing a volume of red landscaping mulch from the Red Barn Farm and Nursery in Dutchess County, New York.The mulch is sold by the “yard,” which is actually a cubic yard, and the variable x is the length(yd) of each side of a
Dropped Object The table lists the distance d (meters) above the ground for an object dropped in a vacuum from a height of 300 m. The time t (in sec) is the time after the object has been released. t 1 2 3 4 5 d 295.1 280.5 256.1 222.0 178.1
Interpreting a Graph The accompanying graph plots the numbers of points scored in each Super Bowl from 1980 (coded as year 1) to the last Super Bowl at the time of this writing.The graph also shows the graph of the quadratic equation that best fits the data. What feature of the graph justifies the
Interpreting R2 In Exercise 2, the quadratic model results in R2 = 0.103. Identify the percentage of the variation in Super Bowl points that can be explained by the quadratic model relating the variable of year and the variable of points scored. (Hint: See Example 2.) What does the result suggest
Super Bowl and R2 Let x represent years coded as 1, 2, 3, . . . for years starting in 1980, and let y represent the numbers of points scored in each Super Bowl from 1980. Using the data from 1980 to the last Super Bowl at the time of this writing, we obtain the following values of R2 for the
Identifying a Model and R2 A data set is obtained as follows: Squares of different sizes are used, and x represents the length (cm) of a side and y represents the corresponding area(cm2) of the square. What formula best describes the relationship between x and y? Which of the five models describes
Dummy Variable Refer to Data Set 7 in Appendix: Data Sets and use the sex, age, and weight of the bears. For sex, let 0 represent female and let 1 represent male. (In Data Set 7, males are already represented by 1, but for females change the sex values from 2 to 0.) Letting the response ( y)
Confidence Interval for a Regression Coefficient A confidence interval for the regression coefficient b1 is expressed as b1 - E 6 b1 6 b1 + E where E = ta>2sb1 The critical t score is found using n - (k + 1) degrees of freedom, where k, n, and sb1 are as described in Exercise 17.Use the sample data
Testing Hypotheses About Regression Coefficients If the coefficient b1 has a nonzero value, then it is helpful in predicting the value of the response variable. If b1 = 0, it is not helpful in predicting the value of the response variable and can be eliminated from the regression equation. To test
Full IQ Score Refer to Data Set 5 in Appendix: Data Sets and find the best regression equation with IQF (full IQ score) as the response ( y) variable. Use predictor variables of IQV(verbal IQ score) and IQP (performance IQ score). Why is this equation best? Based on these results, can we predict
Predicting IQ Score Refer to Data Set 6 in Appendix: Data Sets and find the best regression equation with IQ score as the response ( y) variable. Use predictor variables of brain volume and/or body weight. Why is this equation best? Based on these results, can we predict someone’s IQ score if we
Predicting Nicotine in Cigarettes Repeat the preceding exercise using the sample data from the menthol cigarettes listed in Data Set 10 from Appendix: Data Sets.
Predicting Nicotine in Cigarettes Refer to Data Set 10 in Appendix: Data Sets and use the tar, nicotine, and CO amounts for the cigarettes that are 100 mm long, filtered, nonmenthol, and nonlight (the last set of measurements). Find the best regression equation for predicting the amount of nicotine
A Honda Civic weighs 2740 lb, it has an engine displacement of 1.8 L, and its highway fuel consumption is 36 mi/gal. What is the best predicted value of the city fuel consumption?Is that predicted value likely to be a good estimate? Is that predicted value likely to be very accurate?
Which regression equation is best for predicting city fuel consumption? Why?
If exactly two predictor (x) variables are to be used to predict the city fuel consumption, which two variables should be chosen? Why?
If only one predictor (x) variable is used to predict the city fuel consumption, which single variable is best? Why?
LDL Cholesterol A female weighs 59.3 kg and she has a measured systolic blood pressure of 122 mm Hg. Use the multiple regression equation to determine the predicted LDL cholesterol amount. Is the result likely to be a good predicted value? Why or why not?
LDL Cholesterol Should the multiple regression equation be used for predicting the LDL cholesterol level based on weight and systolic blood pressure? Why or why not?
LDL Cholesterol Identify the following:a. The P-value corresponding to the overall significance of the multiple regression equationb. The value of the multiple coefficient of determination R2c. The adjusted value of R2
LDL Cholesterol Identify the multiple regression equation that expresses the level of LDL cholesterol in terms of weight (WT) and systolic blood pressure (SYS).
Interpreting R2 For the multiple regression equation given in Exercise 1, we get R2 = 0.928.What does that value tell us?
Adjusted Coefficient of Determination For Exercise 2, why is it better to use values of adjusted R2 instead of simply using values of R2?
Best Multiple Regression Equation For the regression equation given in Exercise 1, the P-value is 0.000 and the adjusted R2 value is 0.925. If we were to include an additional predictor variable of neck size (in.), the P-value becomes 0.000 and the adjusted R2 becomes 0.933. Given that the adjusted
Terminology Using the lengths (in.), chest sizes (in.), and weights (lb) of bears from a data set, we get this regression equation: Weight = -274 + 0.426 Length +12.1 Chest Size. Identify the response and predictor variables.
Showing 2500 - 2600
of 7930
First
19
20
21
22
23
24
25
26
27
28
29
30
31
32
33
Last
Step by Step Answers