New Semester
Started
Get
50% OFF
Study Help!
--h --m --s
Claim Now
Question Answers
Textbooks
Find textbooks, questions and answers
Oops, something went wrong!
Change your search query and then try again
S
Books
FREE
Study Help
Expert Questions
Accounting
General Management
Mathematics
Finance
Organizational Behaviour
Law
Physics
Operating System
Management Leadership
Sociology
Programming
Marketing
Database
Computer Network
Economics
Textbooks Solutions
Accounting
Managerial Accounting
Management Leadership
Cost Accounting
Statistics
Business Law
Corporate Finance
Finance
Economics
Auditing
Tutors
Online Tutors
Find a Tutor
Hire a Tutor
Become a Tutor
AI Tutor
AI Study Planner
NEW
Sell Books
Search
Search
Sign In
Register
study help
business
elementary statistics
Elementary Statistics Using Excel Pearson New 5th Edition Mario F Triola - Solutions
Constructing an s Chart In this section we described control charts for R and based on ranges. Control charts for monitoring variation and center (mean) can also be based on standard deviations. An s chart for monitoring variation is made by plotting sample standard deviations with a centerline at
Boston Rainfall: Constructing an Chart Using the 52 samples of seven values each, construct an chart and determine whether the process mean is within statistical control. If it is not, identify which of the three out-of-control criteria lead to rejection of a statistically stable mean. If not, what
Boston Rainfall: Constructing an R Chart Using the 52 samples of seven values each, construct an R chart and determine whether the process variation is within statistical control. If it is not, identify which of the three out-of-control criteria lead to rejection of statistically stable variation.
Boston Rainfall: Constructing a Run Chart Using only the 52 rainfall amounts for Monday, construct a run chart. Does the process appear to be within statistical control?
Minting Quarters: Constructing an Chart Construct an chart and determine whether the process mean is within statistical control. If it is not, identify which of the three out-of-control criteria lead to rejection of a statistically stable mean. Does this process need corrective action?x x xWeights
Minting Quarters: Constructing an R Chart Construct an R chart and determine whether the process variation is within statistical control. If it is not, identify which of the three out-of-control criteria lead to rejection of statistically stable variation.
Minting Quarters: Constructing a Run Chart Construct a run chart for the 100 values.Does there appear to be a pattern suggesting that the process is not within statistical control? What are the practical implications of the run chart?
On each day of production, seven aluminum cans with thickness 0.0109 in. were randomly selected and the axial loads were measured. The means for the different days are listed below, but they can also be found from the values given in Data Set 20 in Appendix B. Construct an chart and determine
On each day of production, seven aluminum cans with thickness 0.0109 in. were randomly selected and the axial loads were measured. The ranges for the different days are listed below, but they can also be found from the values given in Data Set 20 in Appendix B. Construct an R chart and determine
Energy Consumption: Constructing an Chart Use samples of size 3 by combining the first three values for each year and combining the last three values for each year.Using the eight samples of size 3, construct an chart and determine whether the process mean is within statistical control. If it is
Energy Consumption: Constructing an R Chart Use samples of size 3 by combining the first three values for each year and combining the last three values for each year.Using the eight samples of size 3, construct an R chart and determine whether the process variation is within statistical control. If
Energy Consumption: Constructing a Run Chart Construct a run chart for the 24 values. Does there appear to be a pattern suggesting that the process is not within statistical control? Is there any pattern or variation that can be explained?
a. What are process data?b. What does it mean for a process to be out of statistical control?c. What are the three criteria for determining whether a process is out of statistical control?d. What is the difference between random variation and assignable variation?e. What is the difference between
Defective Aspirin Tablets The Acton Pharmaceutical Company manufactures aspirin tablets that are supposed to contain 325 mg of aspirin. Each day, 100 tablets are randomly selected and the amount of aspirin is measured. A tablet is considered defective if it has obvious physical deformities or the
Energy Consumption: Run Chart Construct a run chart for the 48 values. Does there appear to be a pattern suggesting that the process is not within statistical control?
Energy Consumption: x – Chart Let each subgroup consist of the 6 values within a year.Construct an x chart and determine whether the process mean is within statistical control. If it is not, identify which of the three out-of-control criteria lead to rejection of a statistically stable mean.
Energy Consumption: R Chart Let each subgroup consist of the 6 values within a year.Construct an R chart and determine whether the process variation is within statistical control.If it is not, identify which of the three out-of-control criteria are violated.
Energy Consumption: Notation After finding the values of the mean and range for each year, find the values of x, and R. Then find the values of LCL and UCL for an R chart and find the values of LCL and UCL for an x chart.
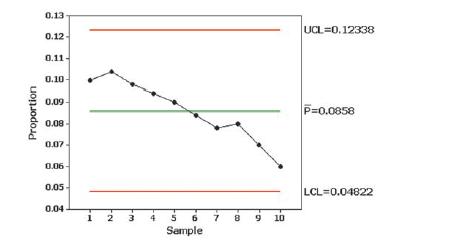
Examine the following p chart for defective car batteries and briefly describe the action that should be taken. Proportion 0.13- 0.12 0.11- 0.10- 0.09 0.08 T UCL=0.12338 P=0.0858 0.07 0.06 0.05 0.04 N. 3 4 5 6 7 8 9 Sample E- 10 LCL=0.04822
What is a p chart?
What is the value of x? In general, how is a value of x found?
Is the process mean within statistical control? Why or why not?
What is the value of R? In general, how is a value of R obtained?
Is the process variation within statistical control? Why or why not?
np Chart A variation of the control chart for p is the np chart in which the actual numbers of defects are plotted instead of the proportions of defects. The np chart has a centerline value of np, and the control limits have values of np + 31np q and np - 31np q. The p chart and the np chart differ
Smart Phone Batteries The SmartBatt company manufactures batteries for smart phones. Listed below are numbers of defects in batches of 200 randomly selected in each of 15 consecutive days of production. What action should be taken?12 11 14 15 9 10 12 16 8 9 15 7 17 5 18
Cola Cans In each of several consecutive days of production of cola cans, 500 cans are tested and the numbers of defects each day are listed below. What action should be taken?20 22 19 17 19 15 16 13 14 14 11 13 12 11 10 9 9 10 7 7
College Enrollment by High School Graduates In each of several recent and consecutive years, 1000 high school graduates were randomly selected and the numbers who enrolled in college were recorded (based on data from the Statistical Abstract of the United States). The data are the latest available
Voting Rate In each of recent and consecutive years of presidential elections, 1000 people of voting age in the United States were randomly selected and the number who voted was determined, with the results listed below. (The data are the latest available as of this writing.)Comment on the voting
Violent Crimes In each of recent and consecutive years, 100,000 people in the United States were randomly selected and the number who were victims of violent crime was determined, with the results listed below. Does the rate of violent crime appear to exhibit acceptable behavior? (The values are
Birth Rate In recent and consecutive years, 100,000 people were randomly selected and the numbers of births they generated were found, with the results given on the next page.(The listed values are based on data from the CIA World Factbook, and they are the most recent values available at the time
Comment on the general quality of the manufacturing process described in Exercise 5 compared to the manufacturing process described in this exercise.
Defective Dimes Repeat Exercise 5 assuming that the size of each batch is 100 instead of 10,000. Compare the control chart to the one found for Exercise
Defective Dimes Consider a process of minting dimes. Listed below are the numbers of defective dimes in successive batches of 10,000 randomly selected on consecutive days of production.32 21 25 19 35 34 27 30 26 33
Interpreting a Control Chart After constructing a control chart for the proportions of defective dimes, it is concluded that the process is within statistical control. Does that imply that almost all of the dimes meet the desired specifications? Explain.
Control Limits In constructing a control chart for the proportions of defective dimes, it is found that LCL = -0.000025. What does “LCL” represent, and how should that value be adjusted?
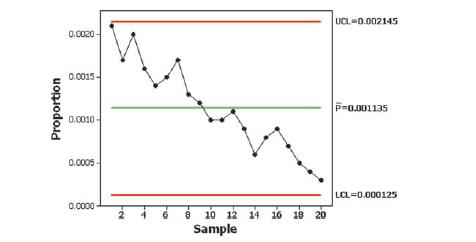
Notation The control chart for Exercise 1 shows a value of p = 0.001135. What does that value denote, and how is it obtained?
Monitoring the Minting of Half Dollars A half dollar is considered to be defective if it deviates substantially from these specifications: The weight is 11.340 g, the diameter is 30.61 mm, the thickness is 2.15 mm, the composition is 8.33% nickel and 91.67% copper, the edge has 150 reeds, and it is
x – Chart Based on Standard Deviations An x chart based on standard deviations(instead of ranges) is made by plotting sample means with a centerline at x and control limits at x + A3s and x - A3s, where A3 is found in Table 2 and s is the mean of the sample standard deviations. Use the data in
s Chart In this section we described control charts for R and x based on ranges.Control charts for monitoring variation and center (mean) can also be based on standard deviations. An s chart for monitoring variation is constructed by plotting sample standard deviations with a centerline at s (the
Global Warming: Run Chart Treat the the 50 consecutive measurements from the 50 years as individual values and construct a run chart. What does the result suggest?
Global Warming: x – Chart Treat the 10 measurements from each decade as a sample and construct an x chart. What does the result suggest?
Global Warming: R Chart Treat the 10 measurements from each decade as a sample and construct an R chart. What does the result suggest?
Global Warming: Notation Find the values of x and R. Also find the values of LCL and UCL for an R chart, then find the values of LCL and UCL for an x chart.
Cola Cans: x – Chart Treat the seven measurements from each day as a sample and construct an x chart. What does the result suggest?
Cola Cans: R Chart Treat the seven measurements from each day as a sample and construct an R chart. What does the result suggest?
Cola Cans: Run Chart Treat the 175 axial loads as a string of consecutive measurements and construct a run chart. What does the result suggest?
Cola Cans: Notation After finding the sample mean and sample range for each of the 25 days, find the values of x and R. Also find the values of LCL and UCL for an R chart, then find the values of LCL and UCL for an x chart.
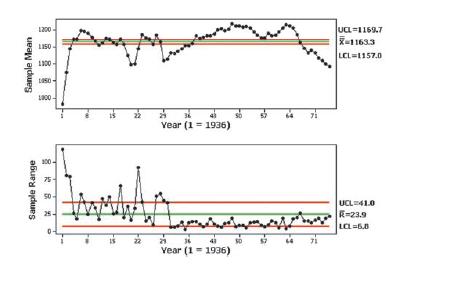
Lake Mead Elevations Shown below are an x chart (top) and an R chart (bottom)obtained by using the monthly elevations of Lake Mead at Hoover Dam (based on data from the U.S. Department of the Interior). The elevations are in feet above sea level. The control charts are based on the 12 monthly
Control Charts When using control charts to monitor a process, why is it necessary to include an x chart and an R chart? Why can’t we use just one of those control charts?
Notation and Terminology Consider process data consisting of the amounts of Coke(in oz) in randomly selected cans of regular Coke. The process is to be monitored with x and R control charts based on samples of 50 cans randomly selected each day for 20 consecutive days of production. What are x and
Product Specs Table 1 lists process data consisting of the weights (g) of quarters, and the United States Mint uses a manufacturing process designed to result in a mean weight equal to 5.670 g. If recent x and R control charts show that the process of manufacturing quarters is within statistical
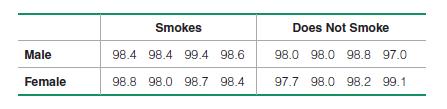
Smoking, Body Temperature, Gender The table below lists body temperatures obtained from randomly selected subjects (based on Data Set 3 in Appendix: Data Sets). The temperatures are categorized according to gender and whether the subject smokes. Using a 0.05 significance level, test for an
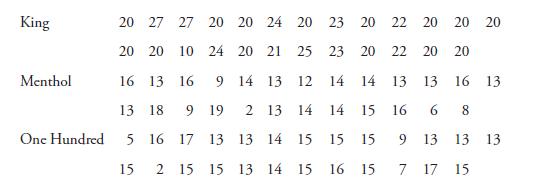
Tar in Cigarettes Data Set 10 in Appendix: Data Sets includes the amounts of tar (mg per cigarette) in the king-size cigarettes, the 100-mm menthol cigarettes, and the 100-mm nonmenthol cigarettes. Please check the changes throughout. The king-size cigarettes are nonfiltered, nonmenthol, and
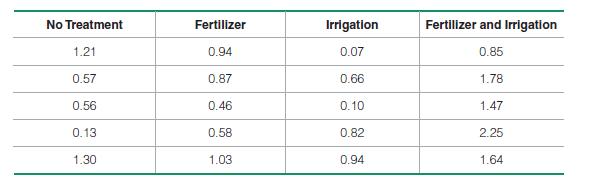
Poplar Tree Experiment Weights (kg) of poplar trees were obtained from trees planted in one region that was rich and moist and a second region that was sandy and dry. The trees were given different treatments as identified in the table below. The data are from a study conducted by researchers at
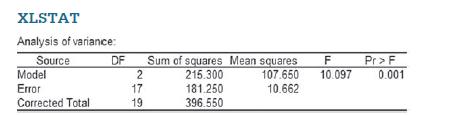
Car Weight and Fuel Consumption Data Set 14 in Appendix:Data Sets includes highway fuel consumption amounts for cars with 4 cylinders, 6 cylinders, and 8 cylinders. (The 5-cylinder Volvo S60 is excluded from this exercise.) Analysis of variance is used with the highway fuel consumption amounts
Using the same results given in Exercise 8, does it appear that the length estimates are affected by the subject’s major?
Using the same results given in Exercise 8, does it appear that the length estimates are affected by the sex of the subject?
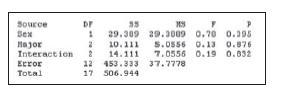
Given below is a display resulting from two-way analysis of variance with sample data consisting of 18 different student estimates of the length of a classroom. The values are categorized according to sex and major (math, business, liberal arts). What do you conclude about an interaction between
The displayed results from Exercise 1 are from one-way analysis of variance. What is it about that test that characterizes it as one-way analysis of variance instead of two-way analysis of variance?
In general, do larger test statistics result in larger P-values, smaller P-values, or P-values that are unrelated to the value of the test statistic?
Identify the value of the test statistic in the display included with Exercise
For the analysis of variance test described in Exercise 1, is that test left-tailed, right-tailed, or two-tailed?
Based on the conclusion from Exercise 1, can electrical appliances be expected to behave the same way when run from the three different power sources? Why or why not?
Measures of Voltage The author measured voltage amounts from three different sources:(1) electricity supplied directly to the author’s home, (2) an independent gas-powered Generac generator (model PP 5000), and (3) an uninterruptible power supply (APC model CS 350) connected to the author’s
Transformations of Data Example 1 illustrated the use of two-way ANOVA to analyze the sample data in Table 3.How are the results affected in each of the following cases?a. The same constant is added to each sample value.b. Each sample value is multiplied by the same nonzero constant.c. The format
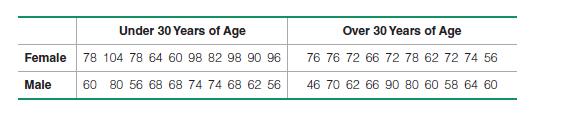
Pulse Rate The following table lists pulse rates obtained from Data Set 1 in Appendix:Data Sets. Use a 0.05 significance level and apply the methods of two-way analysis of variance.What do you conclude? Under 30 Years of Age Female 78 104 78 64 60 98 82 98 90 96 Male 60 80 56 68 68 74 74 68 62 56
Pancake Experiment Listed below are ratings of pancakes made by experts. Different pancakes were made with and without a supplement and with different amounts of whey.The results from two-way analysis of variance are shown. Use the displayed results and a 0.05 significance level. What do you
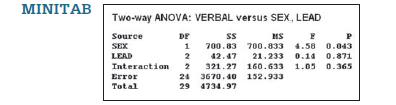
Verbal IQ Scores Example 1 in this section used performance IQ scores from Data Set 5 in Appendix: Data Sets for two-way analysis of variance with the factors of sex (male, female)and measured blood lead level (low, medium, high). If we use the verbal IQ scores with those same factors, we get the
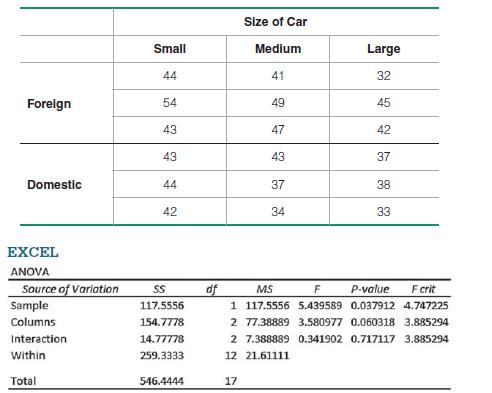
Car Crash Tests The following table lists results from car crash tests. The listed values are measures of chest deceleration (in g) categorized by type (whether the car is foreign or domestic) and car size (small, midsize, large). Results from two-way analysis of variance are also displayed. Use
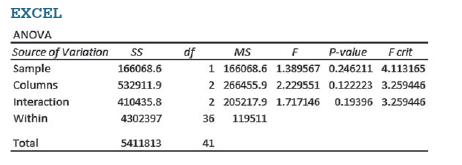
Car Crash Tests If we use the data described in Exercise 1 with two-way analysis of variance, we get the accompanying display. What do you conclude? EXCEL MS F P-value F crit 1 166068.6 1.389567 0.246211 4.113165 2 266455.9 2.229551 0.122223 3.259446 2 205217.9 1.717146 0.19396 3.259446 36 119511
Balanced Design Does the table given in Exercise 1 constitute a balanced design? Why or why not?
Interaction What is an interaction between two factors? In general, when using twoway analysis of variance, if we find that there is an interaction effect, how does that affect the procedure?
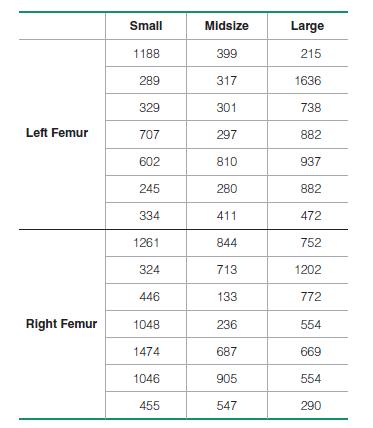
Two-Way ANOVA If we have a goal of using the data described in Exercise 1 to (1) determine whether size of a car has an effect on the load measurements and (2) to determine whether the location of the femur (left or right) has an effect on the load measurements, should we use one-way analysis of
Two-Way ANOVA Data Set 13 in Appendix: Data Sets lists results from car crash tests.Included in results from car crash tests are loads (pounds) on the left femur and right femur, and those values are shown in the following table. What characteristic of the data suggests that the appropriate method
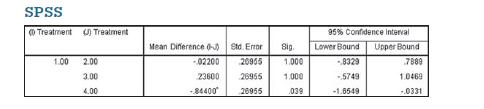
Bonferroni Test Shown below are partial results from using the Bonferroni test with the sample data from Exercise 13.Assume that a 0.05 significance level is being used.a. What do the displayed results tell us?b. Use the Bonferroni test procedure to test for a significant difference between the
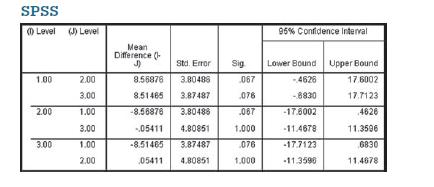
Tukey Test This section included a display of the Bonferroni test results from Table 1 included with the Chapter Problem. Shown here is the SPSS-generated display of results from the Tukey test using the same data. Compare the Tukey test results to those from the Bonferroni test. SPSS Level (J)
Secondhand Smoke Refer to Data Set 9 in Appendix: Data Sets and use the measured serum cotinine levels (in mg/mL) from the three groups of subjects (smokers, nonsmokers exposed to tobacco smoke, and nonsmokers not exposed to tobacco smoke). When nicotine is absorbed by the body, cotinine is
Nicotine in Cigarettes Refer to Data Set 10 in Appendix: Data Sets and use the amounts of nicotine (mg per cigarette) in the king-size cigarettes, the 100-mm menthol cigarettes, and the 100-mm nonmenthol cigarettes. The king-size cigarettes are nonfiltered, nonmenthol, and nonlight. The 100-mm
Poplar Tree Weights Weights (kg) of poplar trees were obtained from trees planted in a sandy and dry region. The trees were given different treatments identified in the table below. The data are from a study conducted by researchers at Pennsylvania State University and were provided by Minitab,
Poplar Tree Weights Weights (kg) of poplar trees were obtained from trees planted in a rich and moist region. The trees were given different treatments identified in the table below. The data are from a study conducted by researchers at Pennsylvania State University and were provided by Minitab,
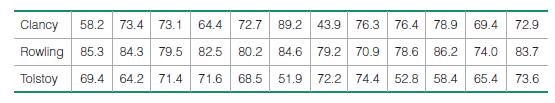
Clancy, Rowling, Tolstoy Readability Pages were randomly selected by the author from The Bear and the Dragon by Tom Clancy, Harry Potter and the Sorcerer’s Stone by J. K. Rowling, and War and Peace by Leo Tolstoy. The Flesch Reading Ease scores for those pages are listed below. Use a 0.05
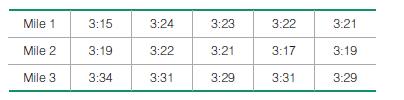
Triathlon Times Jeff Parent is a statistics instructor who participates in triathlons.Listed in the following table are times (in minutes and seconds) he recorded while riding a bicycle for five laps through each mile of a 3-mile loop. Use a 0.05 significance level to test the claim that it takes
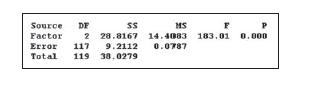
Pelvis Injury Crash Test Data Exercises 1–4 use chest deceleration data for three different size categories (small, midsize, large). The data are from a standard crash test and they are listed in Data Set 13 in Appendix B. If we use the pelvis injury measurements (g) with the same three size
Head Injury Crash Test Data Exercises 1–4 use chest deceleration data for three different size categories (small, midsize, large). The data are from a standard crash test and they are listed in Data Set 13 in Appendix: Data Sets. If we use the head injury measurements(in HIC, which is a standard
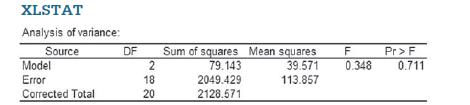
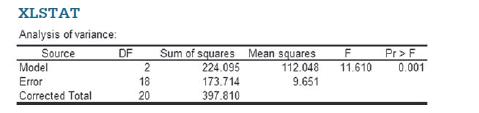
City Fuel Consumption Data Set 14 in Appendix: Data Sets lists city fuel consumption amounts (mi/gal) for cars categorized by size (small, midsize, large). If we use those city fuel consumption amounts arranged into the three separate size categories, we get the XLSTAT results shown here.Using a
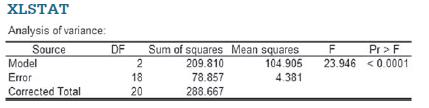
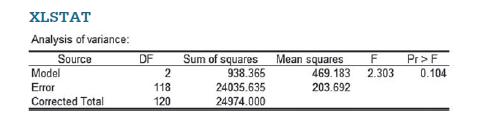
Highway Fuel Consumption Data Set 14 in Appendix: Data Sets lists highway fuel consumption amounts (mi/gal) for cars categorized by size (small, midsize, large). If we use those highway fuel consumption amounts arranged into the three separate size categories, we get the XLSTAT results shown in the
Lead and Full IQ Scores Example 1 used measured performance IQ scores for three different blood lead levels. If we use the same three categories of blood lead levels with the full IQ scores, we get the accompanying XLSTAT display. (The data are listed in Data Set 5 of Appendix: Data Sets.) Using a
Lead and Verbal IQ Scores Example 1 used measured performance IQ scores for three different blood lead levels. If we use the same three categories of blood lead levels with measured verbal IQ scores, we get the accompanying XLSTAT display. (The data are listed in Data Set 5 of Appendix: Data Sets.)
P-Value If we use a 0.05 significance level in analysis of variance with the sample data given in Exercise 1, what is the P-value? What should we conclude?
Test Statistic What is the value of the test statistic? What distribution is used with the test statistic?
Why Not Test Two at a Time? Refer to the sample data given in Exercise 1.If we want to test for equality of the three means, why don’t we use three separate hypothesis tests for m1 = m2, m1 = m3, and m2 = m3?
ANOVAa. What characteristic of the data above indicates that we should use one-way analysis of variance?b. If the objective is to test the claim that the three size categories have the same mean chest deceleration, why is the method referred to as analysis of variance?
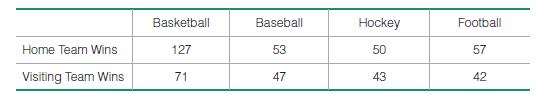
Home Field Advantage Winning-team data were collected for teams in different sports, with the results given in the accompanying table (based on data from “Predicting Professional Sports Game Outcomes from Intermediate Game Scores,” by Copper, DeNeve, and Mosteller, Chance, Vol. 5, No. 3–4).
Flipping and Spinning Pennies Use the data in the table below with a 0.05 significance level to test the claim that when flipping or spinning a penny, the outcome is independent of whether the penny was flipped or spun. (The data are from experimental results given in Chance News.) Does the
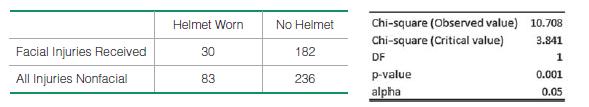
Bicycle Helmets A study was conducted of 531 persons injured in bicycle crashes, and randomly selected sample results are summarized in the accompanying table (based on results from “A Case-Control Study of the Effectiveness of Bicycle Safety Helmets in Preventing Facial Injury,” by Thompson et
Weather-Related Deaths Listed below are the numbers of weather-related deaths in a recent year (based on data from the National Weather Service). Use a 0.01 significance level to test the claim that weather-related deaths occur in the different months with the same frequency.Can you provide an
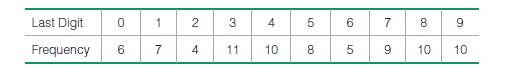
Measuring Weights When certain quantities are measured, the last digits tend to be uniformly distributed, but if they are estimated or reported, the last digits tend to have disproportionately more 0s or 5s. If we use the last digits (decimal portion) of the 80 weights in Data Set 1 from Appendix:
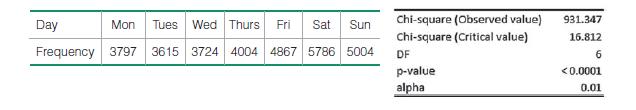
Auto Fatalities The table below lists auto fatalities by day of the week for a recent year(based on data from the Federal Highway Administration). XLSTAT results are also shown.Use a 0.01 significance level to test the claim that auto fatalities occur on the different days of the week with the same
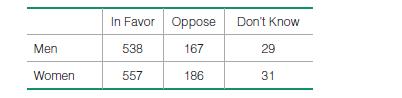
Given that the P-value for the hypothesis test is 0.836, what do you conclude?Questions 6–10 refer to the sample data in the following table (based on data from the Pew Research Center). Randomly selected subjects were asked about the use of marijuana for medical purposes. Assume that we want to
Showing 2400 - 2500
of 7930
First
18
19
20
21
22
23
24
25
26
27
28
29
30
31
32
Last
Step by Step Answers