New Semester
Started
Get
50% OFF
Study Help!
--h --m --s
Claim Now
Question Answers
Textbooks
Find textbooks, questions and answers
Oops, something went wrong!
Change your search query and then try again
S
Books
FREE
Study Help
Expert Questions
Accounting
General Management
Mathematics
Finance
Organizational Behaviour
Law
Physics
Operating System
Management Leadership
Sociology
Programming
Marketing
Database
Computer Network
Economics
Textbooks Solutions
Accounting
Managerial Accounting
Management Leadership
Cost Accounting
Statistics
Business Law
Corporate Finance
Finance
Economics
Auditing
Tutors
Online Tutors
Find a Tutor
Hire a Tutor
Become a Tutor
AI Tutor
AI Study Planner
NEW
Sell Books
Search
Search
Sign In
Register
study help
business
elementary statistics
Elementary Statistics 3rd Edition William Navidi, Barry Monk - Solutions
Are low-fat diets or low-carb diets more effective for weight loss? A sample of 77 subjects went on a low-carbohydrate diet for six months. At the end of that time, the sample mean weight loss was 4.7 kilograms with a sample standard deviation of 7.2 kilograms. A second sample of 79 subjects went
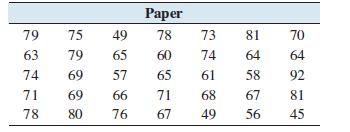
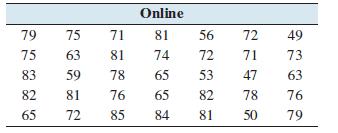
Do you prefer taking tests on paper or online?A college instructor gave identical tests to two randomly sampled groups of 35 students. One group took the test on paper and the other took it online. Following are the test scores.a. Construct a 95% confidence interval for the difference in mean
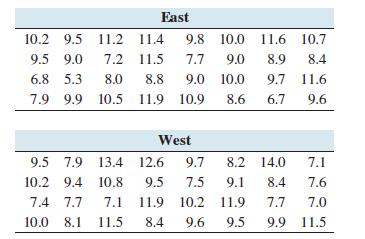
How often does the average driver have an accident? The Allstate Insurance Company determined the average number of years between accidents for drivers in a large number of U.S. cities. Following are the results for 32 cities east of the Mississippi River and 32 cities west of the Mississippi
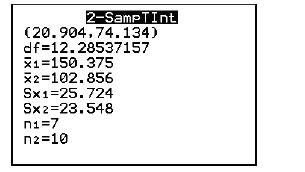
The following TI-84 Plus calculator display presents a 95% confidence interval for the difference between two means. The sample sizes are n1 = 7 and n2 = 10.a. Compute the point estimate of μ1 − μ2.b. How many degrees of freedom did the calculator use?c. Fill in the blanks: We are 95% confident
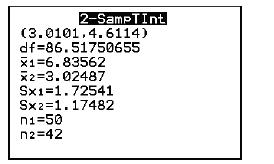
The following TI-84 Plus calculator display presents a 99% confidence interval for the difference between two means. The sample sizes are n1 = 50 and n2 = 42.a. Compute the point estimate of μ1 − μ2.b. How many degrees of freedom did the calculator use?c. Fill in the blanks: We are 99%
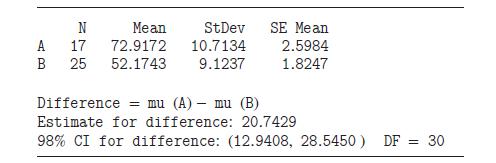
The following MINITAB output display presents a 98% confidence interval for the difference between two means.a. Compute the point estimate of μ1 − μ2.b. How many degrees of freedom did the calculator use?c. Fill in the blanks: We are _______________ confident that the difference between the
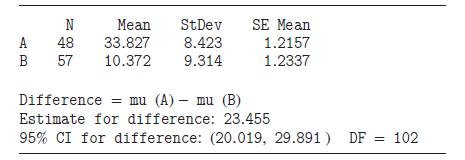
The following MINITAB output display presents a 95% confidence interval for the difference between two means.a. Compute the point estimate of μ1 − μ2.b. How many degrees of freedom did the calculator use?c. Fill in the blanks: We are _______________ confident that the difference between the
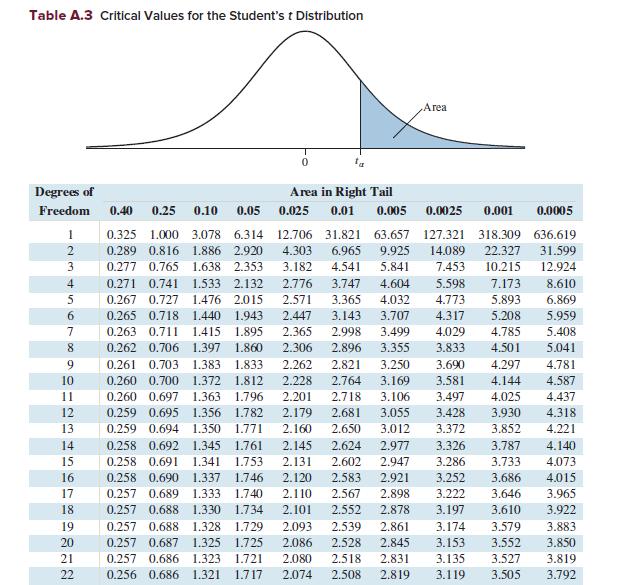
The following TI-84 Plus display presents a 95% confidence interval, using the more accurate formula for the degrees of freedom. The sample sizes are n1 = 12 and n2 = 10.a. Use the simpler method to compute the degrees of freedom as the smaller of n1 − 1 and n2 − 1.b. Find the critical value
What does the P-value represent?
In what ways are hypothesis tests for a population mean different from hypothesis tests for a proportion? In what ways are they similar?
A test will be made of H0: μ = 12 versus H1: μ > 12.Explain why the power will be greater when the true value of μ is 20 than when the true value of μ is 15.
In a simple random sample of 150 cars undergoing emissions testing, 23 failed the test. Can you conclude that the proportion of cars that fail the test is less than 20%?Use the α = 0.05 level of significance.In Exercises 1–4, state which type of parameter is to be tested; then perform the
A simple random sample of size 15 has mean x̄ = 27.72 and standard deviation s = 8.21. The population is approximately normally distributed. Can you conclude that the population mean differs from 35? Use the α = 0.01 level of significance.In Exercises 1–4, state which type of parameter is to be
A simple random sample of size 7 has mean x̄ = 32.5 and standard deviation s = 8.27. The population is normally distributed. Can you conclude that the population standard deviation is greater than 6? Use the α = 0.05 level of significance.In Exercises 1–4, state which type of parameter is to be
A simple random sample of size 65 has mean x̄ = 38.16. The population standard deviation is σ = 5.95. Can you conclude that the mean is less than 40? Use theα = 0.01 level of significance.In Exercises 1–4, state which type of parameter is to be tested; then perform the hypothesis test.
A simple random sample of size 13 has mean x̄ = 7.26 and standard deviation s = 2.45. The population is approximately normally distributed. Can you conclude that the population mean differs from 9? Use the α = 0.01 level of significance.In Exercises 5–12, state which type of parameter is to be
A simple random sample of size 65 has mean x̄ = 57.3. The population standard deviation is σ = 12.6. Can you conclude that the population mean is less than 60? Use the α = 0.05 level of significance.In Exercises 5–12, state which type of parameter is to be tested; then perform the hypothesis
A simple random sample of size 16 has mean x̄ = 4.1 and standard deviation s = 6.2. The population is normally distributed. Can you conclude that the population standard deviation is greater than 5? Use the α = 0.05 level of significance.In Exercises 5–12, state which type of parameter is to be
In a simple random sample of 120 law students, 54 were women. Can you conclude that less than half of law students are women? Use the α = 0.01 level of significance.In Exercises 5–12, state which type of parameter is to be tested; then perform the hypothesis test.
A simple random sample of size 23 has mean x̄ = 41.8. The population standard deviation is σ = 3.72. Can you conclude that the population mean differs from 40? Use the α = 0.05 level of significance.In Exercises 5–12, state which type of parameter is to be tested; then perform the hypothesis
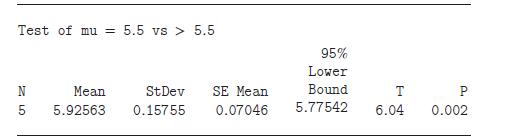
A simple random sample of size 6 has mean x̄ = 5.49 and standard deviation s = 2.37. The population is approximately normally distributed. Can you conclude that the population mean is greater than 4? Use the α = 0.05 level of significance.In Exercises 5–12, state which type of parameter is to
In a simple random sample of 95 families, 70 had one or more pets at home. Can you conclude that the proportion of families with one or more pets differs from 0.6? Use the α = 0.01 level of significance.In Exercises 5–12, state which type of parameter is to be tested; then perform the hypothesis
A simple random sample of size 22 has mean ̄x = 91.7 and standard deviation s = 19.3. The population is normally distributed. Can you conclude that the population standard deviation is greater than 15? Use the α = 0.05 level of significance.In Exercises 5–12, state which type of parameter is to
In a survey of 909 U.S. adults with children conducted by the Financial Industry Regulatory Authority, 309 said that they had saved money for their children’s college education. Can you conclude that more than 30% of U.S. adults with children have saved money for college? Use the α = 0.05 level
The U.S. Census Bureau reported that the mean area of U.S. homes built in 2015 was 2467 square feet. Assume that a simple random sample of 20 homes built in 2017 had a mean area of 2543 square feet, with a standard deviation of 225 square feet. Assume the population of areas is normally
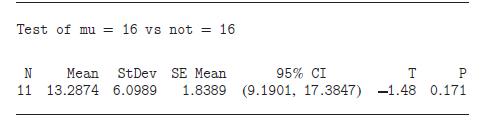
Following are the weights of 8 boxes of cookies, each of which is labeled as containing 16 ounces.Assume that the population of weights is normally distributed.Can you conclude that the population standard deviation is less than 0.1? Use the α = 0.01 level of significance. 15.91 16.06 16.08 15.97
The General Social Survey asked 514 people whether they had ever considered a career in science, and 178 said that they had. Can you conclude that more than 30% of people have considered a career in science? Use theα = 0.05 level of significance.
A random sample of 50 public school teachers in Georgia had a mean annual salary of $48,300.Assume the population standard deviation is σ = $8,000. Can you conclude that the mean salary of public school teachers in Georgia differs from $50,000? Use the α = 0.01 level of significance.
Speeds for a sample of nine cars were measured by radar along a stretch of highway. The results, in miles per hour, were as follows. Assume that the population of speeds is normally distributed.Can you conclude that the population standard deviation is greater than 2? Use the α = 0.05 level of
Mercury is a toxic metal that is used in many industrial applications. Seven measurements, in milligrams per cubic meter, were taken of the mercury concentration in a lake, with the following results. Assume that the population of measurements is approximately normally distributed.Can you conclude
A random sample of 100 pairs of ladies’ shoes had a mean size of 8.3. Assume the population standard deviation is σ = 1.5. Can you conclude that the mean size of ladies’ shoes differs from 8? Use the α = 0.01 level of significance.
For testing the hypotheses H0 : μ = 10 versus H1: μ < 10 at the α = 0.05 level, assume the population standard deviation is σ = 3 and the sample size is n = 50.Find the power against the alternative μ1 = 9.
For testing the hypotheses H0 : μ = 35 versus H1: μ > 35 at the α = 0.01 level, assume the population standard deviation is σ = 10 and the sample size is n = 100.Find the power against the alternative μ1 = 40.
The greater the power, the less likely we are to make a __________________ error.In Exercises 3–5, fill in each blank with the appropriate word or phrase.
The power is the probability of rejecting H0 when it is __________________ .In Exercises 3–5, fill in each blank with the appropriate word or phrase.
If the sample size is increased, the power will ____________________.In Exercises 3–5, fill in each blank with the appropriate word or phrase.
Once the significance level ???? has been chosen, the only way to increase the power of a test is to decrease the sample size.In Exercises 6–8, determine whether the statement is true or false. If the statement is false, rewrite it as a true statement.
The power is the probability of making a Type I error.In Exercises 6–8, determine whether the statement is true or false. If the statement is false, rewrite it as a true statement.
For a test about the population mean, the power of a test depends on a specified value that satisfies the alternate hypothesis.In Exercises 6–8, determine whether the statement is true or false. If the statement is false, rewrite it as a true statement.
A tire company claims that the lifetimes of its tires average 50,000 miles. The standard deviation of tire lifetimes is known to be σ = 5000 miles. You sample 100 tires and will test the hypotheses H0: μ = 50,000 versus H1: μ < 50,000 at the α = 0.05 level of significance.a. Find the power of
Shipments of coffee beans are checked for moisture content. A high moisture content indicates water contamination and will result in the shipment being rejected.Let μ represent the mean water content (in percent by weight)in a shipment. Fifty moisture measurements will be made on beans chosen at
A college admissions officer will draw a simple random sample of 100 mathematics SAT scores from the entering freshman class. The admissions officer will perform a test of the hypotheses H0: μ = 500 versus H1: μ > 500 at theα = 0.05 level of significance. Assume the population standard deviation
An article in the International Journal of Clinical Practice described a study in which a sample of 314 patients took a combination of the drugs ezetimibe and simvastatin in order to reduce their total blood cholesterol levels. A test of the hypotheses H0: μ = 1 versus H1: μ > 1 will be made at
Refer to Exercise 11.A test of the hypotheses H0: μ = 50,000 versus H1: μ ≠ 50,000 will be made at theα = 0.05 level of significance. Assume that the standard deviation of tire lifetimes is σ = 5000 and that the sample size is n = 100.Find the power of the test against the alternative μ1 =
Refer to Exercise 12.A test of the hypotheses H0: ???? = 10 versus H1: μ ≠ 10 will be made at the α = 0.05 level of significance. Assume that the standard deviation of moisture content is σ = 5.0 and that the sample size is n = 50.Find the power of the test against the alternativeμ1 =
Refer to Exercise 13.The admissions officer will perform a test of the hypotheses H0: μ = 500 versus H1: μ ≠ 500 at the α = 0.01 level of significance. Assume that the population standard deviation is σ = 116 and that the sample size is n = 100.Find the power of the test against the
Refer to Exercise 14.A test of the hypotheses H0: μ = 1 versus H1: μ ≠ 1 will be made at theα = 0.01 level of significance. Assume that the population standard deviation is σ = 0.2 and that the sample size is n = 314.Find the power of the test against the alternativeμ1 = 0.98.Exercise 14An
A marketing firm samples 150 residents of a certain town to determine the sample proportion ̂p that have seen a new advertisement. A test of the hypotheses H0: p = 0.4 versus H1: p a. Find the critical value zα.b. Find the value of ̂p whose z-score is −zα. Call this value p∗.Note that the
A hypothesis test results in a P-value of 0.008. Which is the best conclusion?i. H0 is definitely false.ii. H0 is definitely true.iii. H0 is plausible.iv. H0 might be true, but it’s very unlikely.v. H0 might be false, but it’s very unlikely.
True or false: If P = 0.03, thena. The result is statistically significant at the α = 0.05 level.b. The result is statistically significant at the α = 0.01 level.c. The null hypothesis is rejected at the α = 0.05 level.d. The null hypothesis is rejected at the α = 0.01 level.
A null hypothesis is rejected at the α = 0.05 level. True or false:a. The P-value is greater than 0.05.b. The P-value is less than or equal to 0.05.c. The result is statistically significant at the α = 0.05 level.d. The result is statistically significant at the α = 0.10 level.
A sample of size 8 is drawn from a normal population with mean μ, and the population standard deviation is unknown.a. Is it appropriate to perform a z-test? Explain.b. Is it appropriate to perform a t-test? Explain.
A test will be made of H0: μ = 4 versus H1: μ > 4, using a sample of size 25.The population standard deviation is unknown. Find the critical value of the test statistic if the significance level is α = 0.05.
True or false: We never conclude that H0 is true.
In a random sample of 500 people who took their driver’s test, 445 passed. Let p be the population proportion who pass. A test will be made of H0: p = 0.85 versus H1: p > 0.85.a. Compute the value of the test statistic.b. Do you reject H0 at the α = 0.05 level?c. State a conclusion.
For testing H0: μ = 3 versus H1: μ < 3, a P-value of 0.024 is obtained.a. If the significance level is α = 0.05, would you conclude that μ < 3? Explain.b. If the significance level is α = 0.01, would you conclude that μ < 3? Explain.
True or false: When we reject H0, we are certain that H1 is true.
The result of a hypothesis test is reported as follows: ‘‘We reject H0 at the α = 0.05 level.’’ What additional information should be included?
In a test of H0: μ = 5 versus H1: μ > 5, the value of the test statistic is t = 2.96. There are 17 degrees of freedom. Do you reject H0 at the α = 0.05 level?
True or false: We can perform a test for a standard deviation only when the population is almost exactly normal.
A random sample of size 20 from a normal population has sample standard deviation s = 10.Test H0: σ = 15 versus H1: σ < 15.Use the α = 0.05 level.
A test of H0: μ = 50 versus H1: μ > 50 will be made at a significance level of α = 0.05. The population standard deviation is σ = 10 and the sample size is n = 60.Find the power of the test against the alternative μ1 = 55.
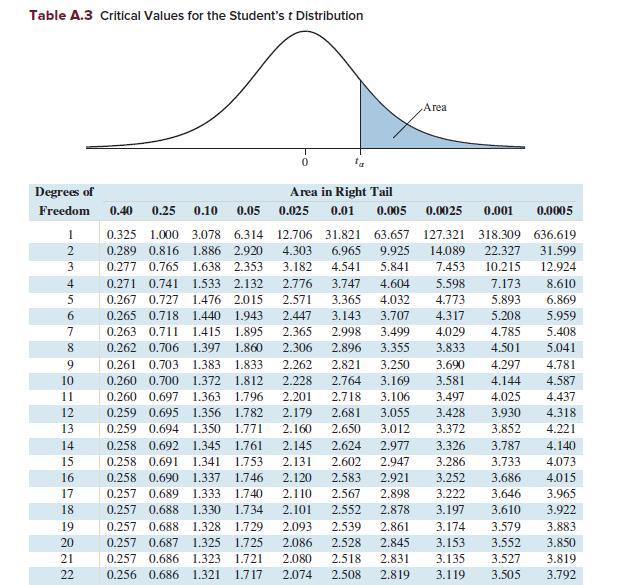
Find the P-value for the following values of the test statistic t, sample size n, and alternate hypothesis H1. If you use Table A.3, you may specify that P is between two values.a. t = 2.584, n = 12, H1: μ > μ0b. t = −1.741, n = 21, H1: μ c. t = 3.031, n = 14, H1: μ ≠ μ0d. t = −2.584,
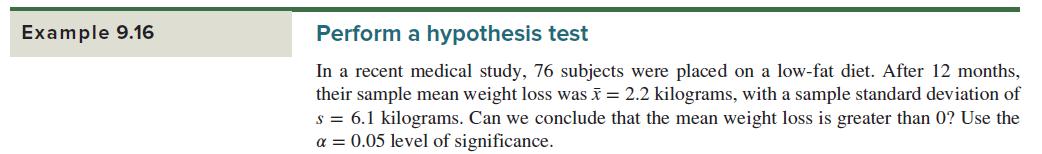
In Example 9.16, the sample size was n = 76, and we observed x̄ = 2.2 and s = 6.1.We tested H0 : μ = 0 versus H1: μ > 0, and the P-value was 0.0012. Assume that the sample size was 41 instead of 76, but that the values of ̄x and s were the same.a. Find the value of the test statistic t.b.
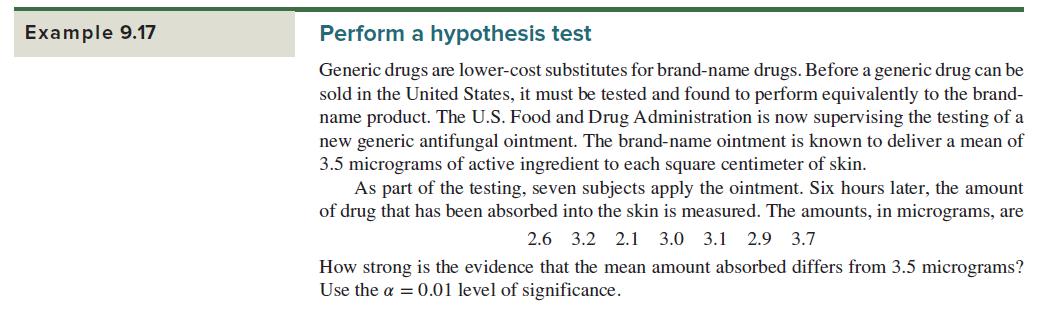
In Example 9.17, the alternate hypothesis was H1: μ ≠ 3.5 and the P-value for the two-tailed test was P = 0.0256. What would the P-value be for the alternate hypothesis H1: μ Example 9.17 Perform a hypothesis test Generic drugs are lower-cost substitutes for brand-name drugs. Before a generic
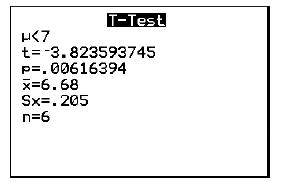
The following TI-84 Plus display presents the results of a t-test.a. What are the null and alternate hypotheses?b. What is the sample size?c. How many degrees of freedom are there?d. What is the value of ̄x?e. What is the value of s?f. What is the value of the test statistic?g. What is the
Refer to the display in Exercise 4.If the sample mean were 6.80 instead of 6.68, what would the P-value be? If you use Table A.3, you may specify that P is between two values.Exercise 4The following TI-84 Plus display presents the results of a t-test. H
Find the critical value or values for the following values of the significance level α, sample size n, and alternate hypothesis H1.a. α = 0.05, n = 3, H1: μ > μ0b. α = 0.01, n = 26, H1: μ ≠ μ0c. α = 0.10, n = 81, H1: μ < μ0d. α = 0.05, n = 14, H1: μ ≠ μ0
To perform a t-test when the sample size is small, the sample must show no evidence of strong ________________ and must contain no __________________ .In Exercises 7 and 8, fill in each blank with the appropriate word or phrase.
The number of degrees of freedom for the Student’s t-test of a population mean is always 1 less than the ____________________ .In Exercises 7 and 8, fill in each blank with the appropriate word or phrase.
A t-test is used when the population standard deviation is unknown.In Exercises 9 and 10, determine whether the statement is true or false. If the statement is false, rewrite it as a true statement.
A t-test is used when the number of degrees of freedom is unknown.In Exercises 9 and 10, determine whether the statement is true or false. If the statement is false, rewrite it as a true statement.
Find the P-value for the following values of the test statistic t, sample size n, and alternate hypothesis H1. If you use Table A.3, you may specify that P is between two values.a. t = 2.336, n = 5, H1: μ > μ0b. t = 1.307, n = 18, H1: μ ≠ μ0c. t = −2.864, n = 51, H1: μ d. t = −2.031,
Find the P-value for the following values of the test statistic t, sample size n, and alternate hypothesis H1. If you use Table A.3, you may specify that P is between two values.a. t = −1.584, n = 19, H1: μ ≠ μ0b. t = −2.473, n = 41, H1: μ c. t = 1.491, n = 30, H1: μ ≠ μ0d. t = 3.635,
Find the critical value or values for the following values of the significance level α, sample size n, and alternate hypothesis H1.a. α = 0.05, n = 27, H1: μ ≠ μ0b. α = 0.01, n = 61, H1: μ > μ0c. α = 0.10, n = 16, H1: μ ≠ μ0d. α = 0.05, n = 11, H1: μ < μ0
Find the critical value or values for the following values of the significance level α, sample size n, and alternate hypothesis H1.a. α = 0.05, n = 39, H1: μ > μ0b. α = 0.01, n = 34, H1: μ < μ0c. α = 0.10, n = 6, H1: μ ≠ μ0d. α = 0.05, n = 25, H1: μ ≠ μ0
The market research firm Salary.com reported that the mean annual earnings of all family practitioners in the United States was $178,258. A random sample of 55 family practitioners in Los Angeles that month had mean earnings of ̄x = $192,340 with a standard deviation of$42,387. Do the data provide
The mean annual tuition and fees for a sample of 14 private colleges in California was $37,900 with a standard deviation of $7,200. A dotplot shows that it is reasonable to assume that the population is approximately normal. Can you conclude that the mean tuition and fees for private institutions
The National Health Statistics Reports described a study in which a sample of 360 one-year-old baby boys were weighed. Their mean weight was 25.5 pounds with standard deviation 5.3 pounds. A pediatrician claims that the mean weight of one-year-old boys is greater than 25 pounds. Do the data provide
The Fair Isaac Corporation (FICO)credit score is used by banks and other lenders to determine whether someone is a good credit risk. Scores range from 300 to 850, with a score of 720 or more indicating that a person is a very good credit risk. An economist wants to determine whether the mean FICO
The American Community Survey sampled 1923 people in Colorado and asked them how long it took them to commute to work each day. The sample mean one-way commute time was 24.5 minutes with a standard deviation of 13.0 minutes. A transportation engineer claims that the mean commute time is less than
The General Social Survey asked a sample of 1298 people how much time they spent watching TV each day.The mean number of hours was 3.09 with a standard deviation of 2.87. A sociologist claims that people watch a mean of 3 hours of TV per day. Do the data provide sufficient evidence to disprove the
In a study to determine whether counseling could help people lose weight, a sample of people experienced a group-based behavioral intervention, which involved weekly meetings with a trained interventionist for a period of six months. The following data are the numbers of pounds lost for 14 people,
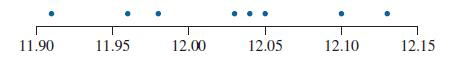
A machine that fills beverage cans is supposed to put 12 ounces of beverage in each can.Following are the amounts measured in a simple random sample of eight cans.a. Following is a dotplot for these data. Is it reasonable to assume that the conditions for performing a hypothesis test are satisfied?
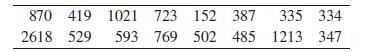
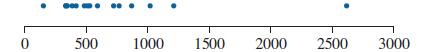
Following are outstanding credit card balances for a sample of 16 college seniors at a large university.a. Following is a dotplot for these data. Is it reasonable to assume that the conditions for performing a hypothesis test are satisfied? Explain.b. According to the report How America Pays for
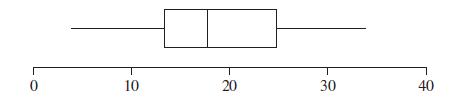
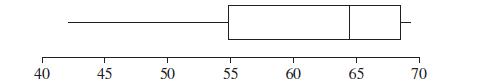
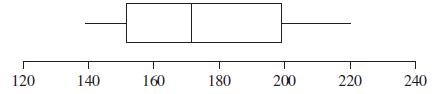
A psychologist is designing an experiment in which rats will navigate a maze. Ten rats run the maze, and the time it takes for each to complete the maze is recorded. The results are as follows.a. Following is a boxplot for these data. Is it reasonable to assume that the conditions for performing a
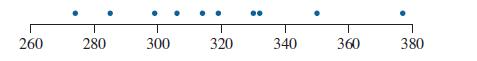
Following are prices, in dollars, of a random sample of ten 7.5-cubic-foot refrigerators.a. Following is a dotplot for these data. Is it reasonable to assume that the conditions for performing a hypothesis test are satisfied? Explain.b. A consumer organization reports that the mean price of
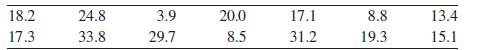
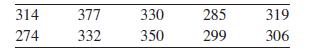
In an attempt to increase business on Monday nights, a restaurant offers a free dessert with every dinner order. Before the offer, the mean number of dinner customers on Monday was 150.Following are the numbers of diners on a random sample of 12 days while the offer was in effect.a. Following is a
When testing a new drug, scientists measure the amount of the active ingredient that is absorbed by the body.In a study done at the Colorado School of Mines, a new antifungal medication that was designed to be applied to the skin was tested. The medication was applied to the skin of eight adult
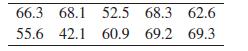
An antifungal medication was applied to the skin of eight adult subjects. One hour later, the amount of active ingredient that had been absorbed into the skin was measured for each subject. The results, in micrograms, werea. Construct a boxplot for these data. Is it appropriate to perform a
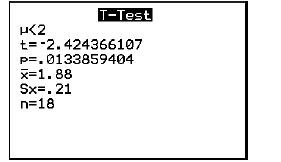
A sample of adults was asked how many hours per day they spend on social media. The following display from a TI-84 Plus calculator presents the results of a hypothesis test regarding the mean number of hours per day spent on social media.a. State the null and alternate hypotheses.b. What is the
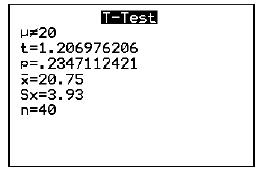
A sample of adults was asked how many hours per week they spend on watching television.The following display from a TI-84 Plus calculator presents the results of a hypothesis test regarding the mean number of hours per week spent watching television.a. State the null and alternate hypotheses.b.
A veterinarian recorded the weights, in grams, for a sample of hamsters. The following MINITAB output presents the results of a hypothesis test regarding the mean weight of hamsters.a. State the null and alternate hypotheses.b. What is the value of ̄x?c. What is the value of s?d. How many degrees
A sample of adults was asked how many miles per day they commute to work. The following MINITAB output presents the results of a hypothesis test regarding the mean number of miles commuted to work.a. State the null and alternate hypotheses.b. What is the value of x̄?c. What is the value of s?d.
In a study of the effectiveness of a certain diet, 100 subjects went on the diet for a period of six months.The sample mean weight loss was 0.5 pound, with a sample standard deviation of 4 pounds.a. Find the t statistic for testing H0: μ = 0 versus H1:μ > 0.b. Find the P-value for testing H0: μ
The study described in Exercise 33 is repeated with a larger sample of 1000 subjects.Assume that the sample mean is once again 0.5 pound and the sample standard deviation is once again 4 pounds.a. Find the t statistic for testing H0: μ = 0 versus H1: μ > 0.Is the value of the t statistic greater
A sociologist wants to test the null hypothesis that the mean number of people per household in a given city is equal to 3.He surveys 50 households on a certain block in the city and finds that the sample mean number of people is 3.4 with a standard deviation of 1.2. Should these data be used to
A health professional wants to test the null hypothesis that the mean length of hospital stay for a certain surgical procedure is 4 days. She obtains records for all the patients who have undergone the procedure at a certain hospital during a given year, and finds that the mean length of stay is
In a study of sleeping habits, a researcher wants to test the null hypothesis that adults in a certain community get a mean of 8 hours of sleep versus the alternative that the mean is not equal to 8.In a sample of 250 adults, the mean number of hours of sleep was 8.2. A second researcher repeated
Juan and Mary want to test the null hypothesis that the mean length of text messages sent by students at their school is 10 characters versus the alternative that it is less. Juan samples 100 text messages and finds the mean length to be 8.4 characters. Mary samples 100 messages and finds the mean
Showing 5800 - 5900
of 7930
First
52
53
54
55
56
57
58
59
60
61
62
63
64
65
66
Last
Step by Step Answers