New Semester
Started
Get
50% OFF
Study Help!
--h --m --s
Claim Now
Question Answers
Textbooks
Find textbooks, questions and answers
Oops, something went wrong!
Change your search query and then try again
S
Books
FREE
Study Help
Expert Questions
Accounting
General Management
Mathematics
Finance
Organizational Behaviour
Law
Physics
Operating System
Management Leadership
Sociology
Programming
Marketing
Database
Computer Network
Economics
Textbooks Solutions
Accounting
Managerial Accounting
Management Leadership
Cost Accounting
Statistics
Business Law
Corporate Finance
Finance
Economics
Auditing
Tutors
Online Tutors
Find a Tutor
Hire a Tutor
Become a Tutor
AI Tutor
AI Study Planner
NEW
Sell Books
Search
Search
Sign In
Register
study help
business
elementary statistics
Elementary Statistics 3rd Edition William Navidi, Barry Monk - Solutions
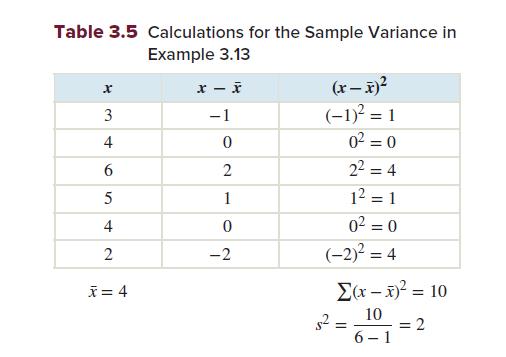
Compute the population variance for the St. Louis temperatures. Compare the result with the variance for the San Francisco temperatures, and interpret the result.
A credit card company is studying the levels of credit card debt held by college students. They select eight students at random. Their balances, in dollars, are 342, 541, 1652, 43, 87, 137, 0, 418.Find the sample variance of the balances.
The average temperatures in Denver, Colorado, for a sample of six days one summer were 77, 80, 78, 80, 83, and 85.Find the sample variance of the temperatures.
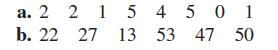
Find the sample variance and standard deviation for the following samples. a. 2 2 1 b. 22 27 54501 13 53 47 50
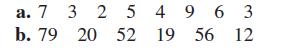
Find the population variance and standard deviation for the population values a. 7 3 2 b. 79 20 20 549 63 52 52 19 56 12
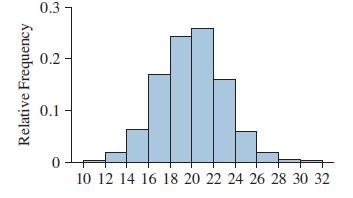
A data set has a mean of 20 and a standard deviation of 3.A histogram is shown here. Is it appropriate to use the Empirical Rule to approximate the proportion of the data between 14 and 26?If so, find the approximation. If not, explain why not. 0.3- Relative Frequency 10 0.1 0.2 20 0 10 12 14 16 18
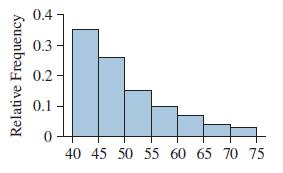
A data set has amean of 50 and a standard deviation of 8.A histogram is shown here. Is it appropriate to use the Empirical Rule to approximate the proportion of the data between 42 and 58? If so, find the approximation. If not, explain why not. Relative Frequency 0.4 0.3 0.2 0.1 0 40 45 50 55 60 65
A group of elementary school students took a standardized reading test. The mean score was 70 and the standard deviation was 10.Someone says that only 50% of the students scored between 50 and 90.Is this possible? Explain.
A certain type of bolt used in an aircraft must have a length between 122 and 128 millimeters in order to be acceptable. The manufacturing process produces bolts whose mean length is 125 millimeters with a standard deviation of 1 millimeter. Can you be sure that more than 85% of the bolts are
Lengths of newborn babies have a mean of 20.1 inches with a standard deviation of 1.9 inches. Find the coefficient of variation of newborn lengths.
If all values in a data set are the same, then the sample variance is equal to__________________.In Exercises 11–14, fill in each blank with the appropriate word or phrase.
The standard deviation is the square root of the ________________.In Exercises 11–14, fill in each blank with the appropriate word or phrase.
For a bell-shaped data set, approximately _______________ of the data will be in the interval μ – σ to μ + σ.In Exercises 11–14, fill in each blank with the appropriate word or phrase.
Chebyshev’s Inequality states that for any data set, the proportion of data within K standard deviations of the mean is at least____________.In Exercises 11–14, fill in each blank with the appropriate word or phrase.
The variance and standard deviation are measures of center.In Exercises 15–18, determine whether the statement is true or false. If the statement is false, rewrite it as a true statement.
The range of a data set is the difference between the largest value and the smallest value.In Exercises 15–18, determine whether the statement is true or false. If the statement is false, rewrite it as a true statement.
In a bell-shaped data set with μ = 15 and σ = 5, approximately 95% of the data will be between 10 and 20.In Exercises 15–18, determine whether the statement is true or false. If the statement is false, rewrite it as a true statement.
For some data sets, Chebyshev’s Inequality may be used but the Empirical Rule should not be.In Exercises 15–18, determine whether the statement is true or false. If the statement is false, rewrite it as a true statement.
Find the sample variance and standard deviation for the following sample: 17 40 24 18 16
Find the sample variance and standard deviation for the following sample:59 25 12 29 16 8 26 30 17
Find the sample variance and standard deviation for the following sample:15 9 5 12 9 21 4 24 18
Find the population variance and standard deviation for the following population:16 6 18 3 25 22
Find the population variance and standard deviation for the following population:20 8 11 23 27 29 62 4
Find the population variance and standard deviation for the following population:26 25 29 23 14 20 12 18 24 31 22 32
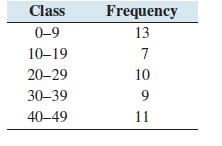
Approximate the sample variance and standard deviation given the following frequency distribution: Class Frequency 0-9 13 10-19 7 20-29 10 30-39 9 40-49 11
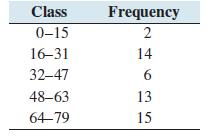
Approximate the sample variance and standard deviation given the following frequency distribution: Class Frequency 0-15 2 16-31 14 32-47 6 48-63 13 64-79 15
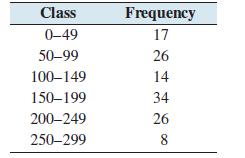
Approximate the population variance and standard deviation given the following frequency distribution: Class Frequency 0-49 50-99 725 17 26 100-149 14 150-199 34 200-249 26 22 250-299 8
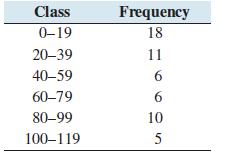
Approximate the population variance and standard deviation given the following frequency distribution: Class Frequency 0-19 18 20-39 11 40-59 6 60-79 6 80-99 10 100-119 5
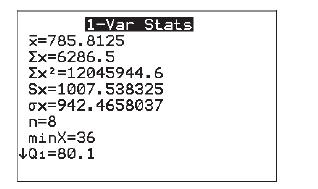
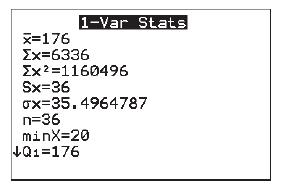
Distances of the eight planets from the sun, in millions of miles, were measured. The following TI-84 Plus display presents some results.a. Is this a population or a sample?b. Find the appropriate standard deviation.c. Find the appropriate variance. 1-Var Stats x=785.8125 =6286.5 Ex2=12045944.6 Sx
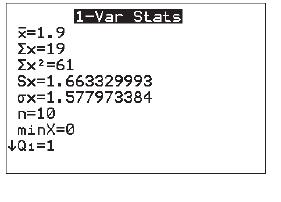
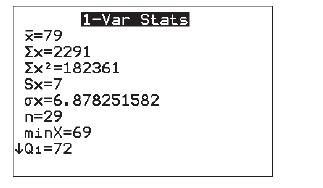
A survey was taken in which people were asked how many siblings they had. The following TI-84 Plus display presents some results.a. Is this a population or a sample?b. Find the appropriate standard deviation.c. Find the appropriate variance. 1-Var Stats x=1.9 =19 =61 Sx 1.663329993 ox=1.577973384
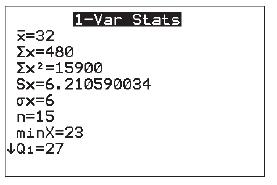
The following TI-84 Plus display presents some population parameters.a. Assume the population is bell-shaped. Approximately what percentage of the population values are between 26 and 38?b. Assume the population is bell-shaped. Between what two values will approximately 95% of the population be?c.
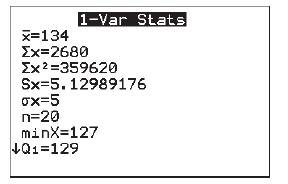
The following TI-84 Plus display presents some population parameters.a. Assume the population is bell-shaped. Approximately what percentage of the population values are between 124 and 144?b. Assume the population is bell-shaped. Between what two values will approximately 68% of the population
The following TI-84 Plus display presents some sample statistics.a. Assume that a histogram of the sample is bell-shaped.Approximately what percentage of the sample values are between 104 and 248?b. Assume that a histogram for the sample is bell-shaped.Between what two values will approximately 68%
The following TI-84 Plus display presents some sample statistics.a. Assume that a histogram of the sample is bell-shaped.Approximately what percentage of the sample values are between 72 and 86?b. Assume that a histogram for the sample is bell-shaped.Between what two values will approximately 95%
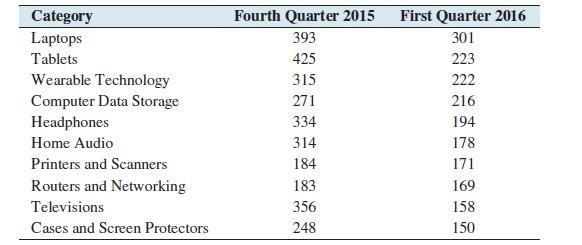
The following table presents the retail sales (in millions of $) for the top 10 electronics categories in the fourth quarter of 2015 and first quarter of 2016.a. Find the sample standard deviation of the online purchases for 2015.b. Find the sample standard deviation of the online purchases for
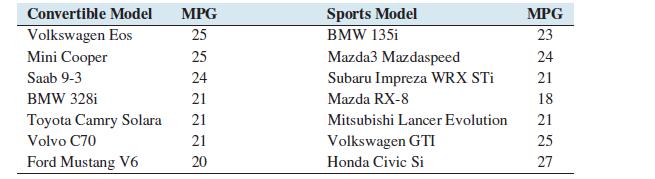
The following table presents the fuel efficiency, in miles per gallon, for a sample of convertibles and a sample of sports cars.a. Find the sample standard deviation of the mileage for the sample of convertibles.b. Find the sample standard deviation of the mileage for the sample of sports cars.c.
Following are the weights, in pounds, for samples of offensive and defensive linemen in the National Football League.a. Find the sample standard deviation for the weights for the offensive linemen.b. Find the sample standard deviation for the weights for the defensive linemen.c. Is there greater
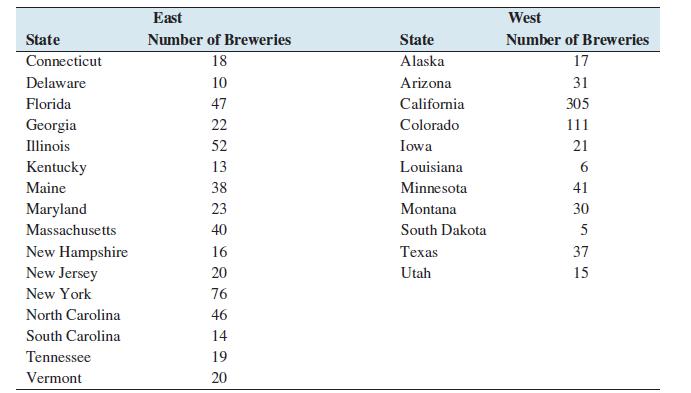
The following table presents the number of active breweries for samples of states located east and west of the Mississippi River.a. Compute the sample standard deviation for the number of breweries east of the Mississippi River.b. Compute the sample standard deviation for the number of breweries
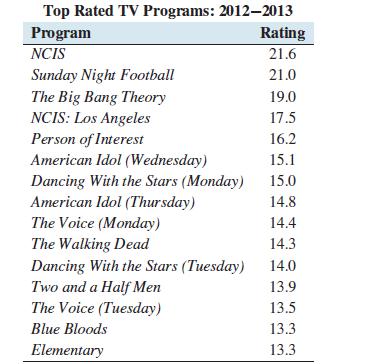
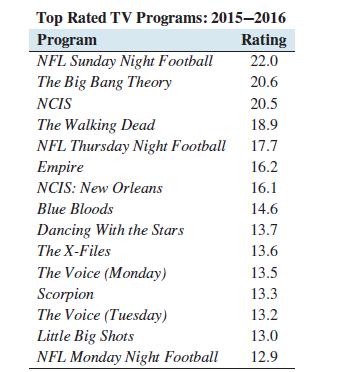
The following tables present the numbers of viewers, in millions for the top 15 prime-time shows for the 2012–2013 and 2015–2016 seasons. The numbers of viewers include those who watched the program on any platform, including time-shifting up to seven days after the original telecast.a. Find
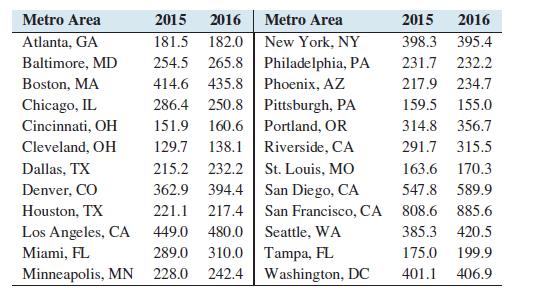
The following table presents prices, in thousands of dollars, of single-family homes for some of the largest metropolitan areas in the United States for the third quarter of 2015 and the third quarter of 2016.a. Find the population standard deviation for 2015.b. Find the population standard
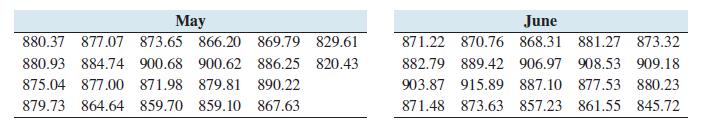
Following are the closing prices of Google stock for each trading day in May and June of a recent year.a. Find the population standard deviation for the prices in May.b. Find the population standard deviation for the prices in June.c. Financial analysts use the word volatility to refer to the
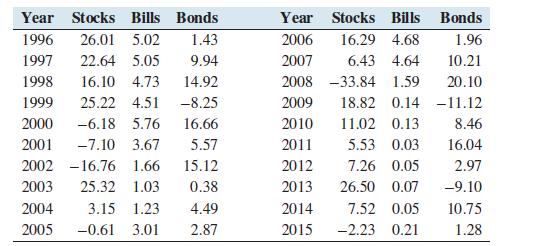
Following are the annual percentage returns for the years 1996–2015 for three categories of investment: stocks, Treasury bills, and Treasury bonds. Stocks are represented by the Dow Jones Industrial Average.a. The standard deviation of the return is a measure of the risk of an investment. Compute
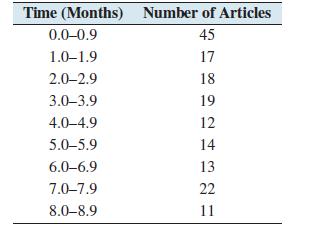
The following table presents the time taken to review articles that were submitted for publication to the journal Technometrics during a recent year. A few articles took longer than 9 months to review; these are omitted from the table. Consider the data to be a population.a. Approximate the
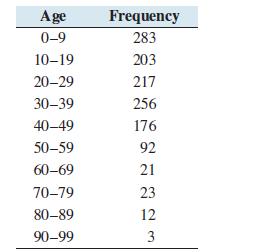
The ages of residents of Banks City, Oregon, are given in the following frequency distribution. Consider these data to be a population.a. Approximate the variance of the ages.b. Approximate the standard deviation of the ages. Age Frequency 0-9 283 10-19 203 20-29 217 30-39 256 40-49 176 50-59 92
In a recent survey of 655 working Americans ages 25–34, the average weekly amount spent on lunch was \($44.60\) with standard deviation \($2.81\). The weekly amounts are approximately bell-shaped.a. Estimate the percentage of amounts that are between \($36.17\) and $53.03.b. Estimate the
In a large sample of customer accounts, a utility company determined that the average number of days between when a bill was sent out and when the payment was made is 32 with a standard deviation of 7 days. Assume the data to be approximately bell-shaped.a. Between what two values will
A study conducted by the Center for Population Economics at the University of Chicago studied the birth weights of 621 babies born in New York. The mean weight was 3234 grams with a standard deviation of 871 grams. Assume that birth weight data are approximately bell-shaped. Estimate the number of
In a survey of 600 homeowners with high-speed Internet, the average monthly cost of a high-speed Internet plan was\($64.20\) with standard deviation \($11.77\). Assume the plan costs to be approximately bell-shaped. Estimate the number of plans that cost betweena. \($40.66\) and $87.74b. \($52.43\)
For the data in Exercise 45, estimate the percentage of amounts that werea. less than $41.79b. greater than $50.22c. between \($44.60\) and $47.41Exercise 45In a recent survey of 655 working Americans ages 25–34, the average weekly amount spent on lunch was \($44.60\) with standard deviation
For the data in Exercise 46, estimate the percentage of bills for which the number of days between when a bill was sent and when payment was made wasa. greater than 39b. less than 18c. between 18 and 32Exercise 46In a large sample of customer accounts, a utility company determined that the average
For the data in Exercise 47, estimate the number of newborns whose weight wasa. less than 4105 gramsb. greater than 1492 gramsc. between 3234 and 4976 gramsExercise 47 A study conducted by the Center for Population Economics at the University of Chicago studied the birth weights of 621 babies born
For the data in Exercise 48, estimate the number of Internet plans whose cost isa. greater than $52.43b. less than $87.74c. between \($52.43\) and $64.20Exercise 48 In a survey of 600 homeowners with high-speed Internet, the average monthly cost of a high-speed Internet plan was\($64.20\) with
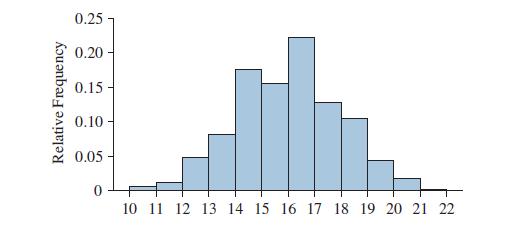
The following histogram presents a data set with a mean of 4.5 and a standard deviation of 2.Is it appropriate to use the Empirical Rule to approximate the proportion of the data between 0.5 and 8.5? If so, find the approximation. If not, explain why not. Relative Frequency 0.25 0.20 0.15 0.10-
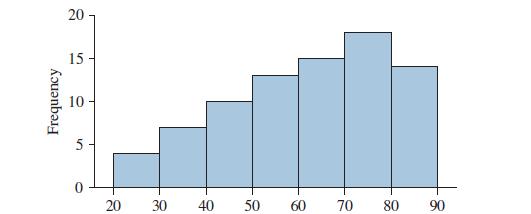
The following histogram presents a data set with a mean of 62 and a standard deviation of 17.Is it appropriate to use the Empirical Rule to approximate the proportion of the data between 45 and 79? If so, find the approximation. If not, explain why not. Frequency 20 20 15 10 S 0 20 30 40 40 50 60
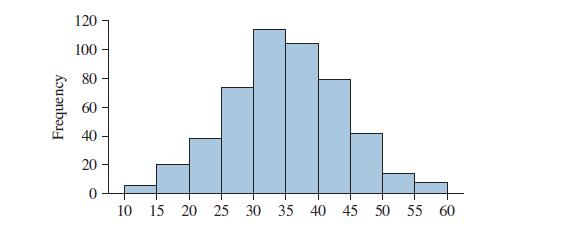
The following histogram presents a data set with a mean of 35 and a standard deviation of 9.Is it appropriate to use the Empirical Rule to approximate the proportion of the data between 26 and 44? If so, find the approximation. If not, explain why not. Frequency 80 60 40 20 288 89 9 120 100 0 10 15
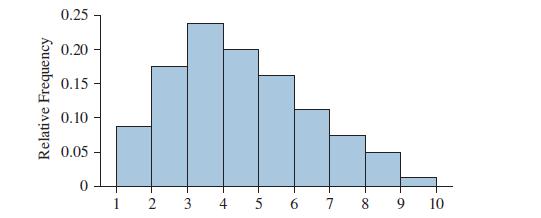
The following histogram presents a data set with a mean of 16 and a standard deviation of 2.Is it appropriate to use the Empirical Rule to approximate the proportion of the data between 12 and 20? If so, find the approximation. If not, explain why not. 0.25 0.20 0.15 Relative Frequency 0.10- 0.05 0
The temperature in a certain location was recorded each day for two months. The mean temperature was 62.4°F with a standard deviation of 3.1°F. What can you determine about these data by using Chebyshev’s Inequality with K = 2?
The National Center for Health Statistics sampled a number of women aged 20–29 and found that the mean height was 64.2 inches and the histogram for the data set was approximately bell-shaped. Assume the heights in the data set ranged from 55 to 74 inches. Is the standard deviation of the data
The National Center for Health Statistics sampled a number of men aged 20–29 and found that the mean height was 69.4 inches and the histogram for the data set was approximately bell-shaped. Assume the heights in the data set ranged from 62 to 78 inches. Is the standard deviation of the data
The Energy Information Administration records the price of electricity in the United States each month.In one recent month, the average price of electricity was 11.92 cents per kilowatt-hour. Suppose that the standard deviation is 2.1 cents per kilowatt-hour. What can you determine about these data
A data set has a mean of 20 and a standard deviation of 5.Which of the following might possibly be true, and which are impossible?a. Less than 50% of the data values are between 10 and 30.b. Only 1% of the data values are greater than 35.c. More than 15% of the data values are less than 5.d. More
A data set has a mean of 50 and a standard deviation of 10.Which of the following might possibly be true, and which are impossible?a. More than 10% of the data values are negative.b. Only 5% of the data values are greater than 70.c. More than 20% of the data values are less than 30.d. Less than 75%
For a list of positive numbers, is it possible for the sample standard deviation to be greater than the mean?If so, give an example. If not, explain why not.
Is it possible for the sample standard deviation of a list of numbers to equal 0? If so, give an example.If not, explain why not.
A National Center for Health Statistics study states that the mean height for adult men in the United States is 69.4 inches with a standard deviation of 3.1 inches, and the mean weight is 194.7 pounds with a standard deviation of 68.3 pounds.a. Compute the coefficient of variation for height.b.
Scores on a statistics exam had a mean of 75 with a standard deviation of 10.Scores on a calculus exam had a mean of 60 with a standard deviation of 9.a. Compute the coefficient of variation for statistics exam scores.b. Compute the coefficient of variation for calculus exam scores.c. Which has
A measure of spread that is an alternative to the standard deviation (SD) is the mean absolute deviation(MAD). For a data set containing values x1, ..., xn, the mean absolute deviation is given bya. Compute the mean ̄x for the data set 1, 3, 4, 7, 9.b. Construct a table like Table 3.5 that
Four employees in an office have annual salaries of \($30,000\), \($35,000\), \($45,000\), and $70,000.a. Compute the sample standard deviation of the salaries.b. Each employee gets a \($1000\) raise. Compute the new standard deviation. Does the standard deviation increase by $1000?c. Each employee
A population has mean μ = 10 and standard deviation σ = 4.a. Find the z-score for a population value of 14.b. Find the z-score for a population value of 8.c. What number has a z-score of 1.5?
A population has mean μ = 30 and standard deviation σ = 6.a. Find the z-score for a population value of 21.b. Find the z-score for a population value of 42.c. What number has a z-score of 0.5?
According to theWall Street Journal, the maximum distance from check-in to the gate at top U.S. airports has a mean of 0.79 miles with a standard deviation of 0.42 miles.a. The maximum distance at the Seattle-Tacoma International Airport is 0.57 miles.What is the z-score for this distance?b. The
Following are final exam scores, arranged in increasing order, for 28 students in an introductory statistics course.a. Find the first quartile of the scores.b. Find the third quartile of the scores.c. Fred got a 73 on the exam. On what percentile is this score?d. Students whose scores are on the
For the years 1882–2015, the 90th percentile of annual snowfall in Denver was 79.1 inches. Approximately what percentage of years had snowfall less than 79.1 inches?
In a recent year, 17% of players in the National Football League weighed less than 200 pounds. On approximately what percentile is a player who weighs 200 pounds?
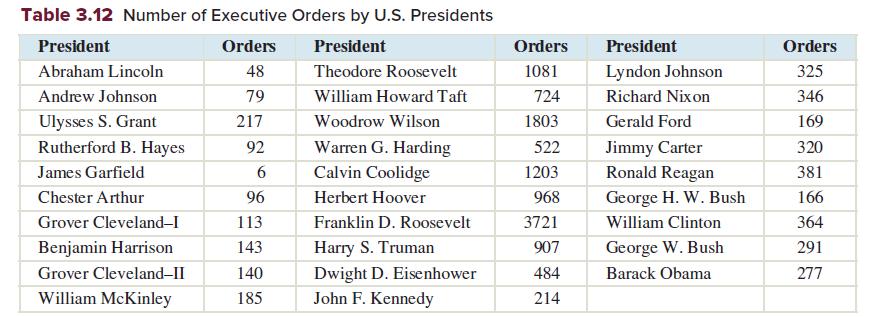
Table 3.12 presents the number of Executive Orders issued by U.S. presidents from March 1861 through January 2017.a. Construct the five-number summary.b. Find the IQR.c. Find the upper and lower outlier boundaries.d. Which values, if any, are outliers? Table 3.12 Number of Executive Orders by U.S.
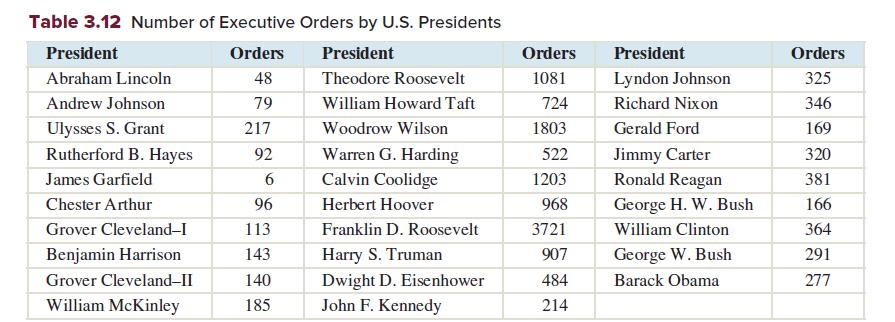
Construct a boxplot for the data in Table 3.12. Table 3.12 Number of Executive Orders by U.S. Presidents President Orders President Orders President Orders Abraham Lincoln 48 Theodore Roosevelt 1081 Lyndon Johnson 325 Andrew Johnson 79 William Howard Taft 724 Richard Nixon 346 Ulysses S. Grant 217
_____________ divide the data set approximately into quarters.In Exercises 9–12, fill in each blank with the appropriate word or phrase.
The median is the same as the ________________ quartile.In Exercises 9–12, fill in each blank with the appropriate word or phrase.
The quantity Q3 − Q1 is known as the ________________.In Exercises 9–12, fill in each blank with the appropriate word or phrase.
A value that is considerably larger or smaller than most of the values in a data set is called an __________________.In Exercises 9–12, fill in each blank with the appropriate word or phrase.
The third quartile, Q3, separates the lowest 25% of the data from the highest 75%.In Exercises 13–16, determine whether the statement is true or false. If the statement is false, rewrite it as a true statement.
The 25th percentile is the same as the first quartile.In Exercises 13–16, determine whether the statement is true or false. If the statement is false, rewrite it as a true statement.
The five-number summary consists of the minimum, the first quartile, the mode, the third quartile, and the maximum.In Exercises 13–16, determine whether the statement is true or false. If the statement is false, rewrite it as a true statement.
In a boxplot, if the lower whisker is much longer than the upper whisker, then the data are skewed to the left.In Exercises 13–16, determine whether the statement is true or false. If the statement is false, rewrite it as a true statement.
A population has mean μ = 7 and standard deviation σ = 2.a. Find the z-score for a population value of 5.b. Find the z-score for a population value of 10.c. What number has a z-score of 2?
A population has mean μ = 25 and standard deviation σ = 4.a. Find the z-score for a population value of 16.b. Find the z-score for a population value of 31.c. What number has a z-score of 2.5?
A rock is weighed five times. The readings in grams are 48.5, 47.2, 4.91, 49.5, and 46.3.In Exercises 19 and 20, identify the outlier. Then tell whether the outlier seems certain to be due to an error, or whether it could conceivably be correct.
A sociologist samples five families in a certain town and records their annual income. The incomes are $34,000, $57,000, $13,000, $1,200,000, and $62,000.In Exercises 19 and 20, identify the outlier. Then tell whether the outlier seems certain to be due to an error, or whether it could conceivably
For the data set 37 82 20 25 31 10 41 44 4 36 68a. Find the first and third quartiles.b. Find the IQR.c. Find the upper and lower outlier boundaries.d. List all the values, if any, that are classified as outliers.
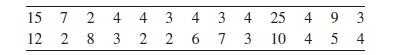
For the data seta. Find the first and third quartiles.b. Find the IQR.c. Find the upper and lower outlier boundaries.d. List all the values, if any, that are classified as outliers. 15 7 2 4 4 3 4 3 4 25 4 93 12 28 3 2 2 6 7 3 10 4 54
For the data seta. Find the 58th percentile.b. Find the 22nd percentile.c. Find the 78th percentile.d. Find the 15th percentile. 2134 2 2 16 29 26 2 19 20 52 5 7 8 8 9 9 14 14 21 22 22 24 24 27 32 33 33 33 34 34 35 35 35 37 38 38 38 40 40 40 41 42 46 47 48 48 48 48 48 49
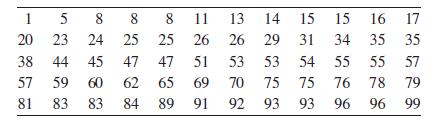
For the data seta. Find the 80th percentile.b. Find the 43rd percentile.c. Find the 18th percentile.d. Find the 65th percentile. 1 20 20 5 00 8 8 23 24 25 81 8 11 13 14 14 15 15 15 15 16 17 25 26 26 29 31 34 35 35 38 44 45 47 47 51 53 53 54 55 55 57 57 59 60 62 65 69 70 75 75 76 78 79 81 83 83 84
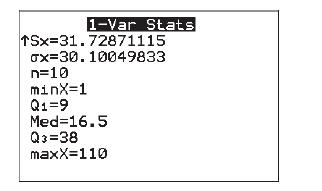
The following TI-84 Plus display presents the five-number summary for a data set. Are there any outliers in this data set? 1-Var Stats TSx 31.72871115 ax=30.10049833 n=10 minX=1 Q1=9 Med=16.5 Q3=38 maxX=110
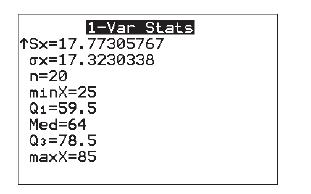
The following TI-84 Plus display presents the five-number summary for a data set. Are there any outliers in this data set? 1-Var Stats 1Sx 17.77305767 ax=17.3239338 n=20 minX=25 Q1=59.5 Med=64 Q3=78.5 maxX=85
In a recent year, the mean score on the ACT test was 21.1 and the standard deviation was 5.2. The mean score on the SAT mathematics test was 514 and the standard deviation was 117.The distributions of both scores were approximately bell-shaped.a. Find the z-score for an ACT score of 27.b. Find the
The mean length of one-year-old spotted flounder, in millimeters, is 126 with standard deviation of 18, and the mean length of two-year-old spotted flounder is 162 with a standard deviation of 28.The distribution of flounder lengths is approximately bell-shaped.a. Anna caught a one-year-old
The three quartiles for systolic blood pressure in a sample of 3179 men were Q1 = 108, Q2 = 116, and Q3 = 127.a. Find the IQR.b. Find the upper and lower outlier boundaries.c. A systolic blood pressure greater than 140 is considered high. Would a blood pressure of 140 be an outlier?
The article referred to in Exercise 29 reported that the three quartiles for systolic blood pressure in a sample of 1213 women between the ages of 20 and 29 were Q1 = 100, Q2 = 108, and Q3 = 115.a. Find the IQR.b. Find the upper and lower outlier boundaries.c. A systolic blood pressure greater than
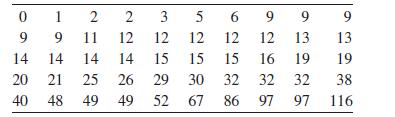
Following is a list of the number of hazardous waste sites in each of the 50 states of the United States in a recent year. The list has been sorted into numerical order.a. Find the first and third quartiles of these data.b. Find the median of these data.c. Find the upper and lower outlier
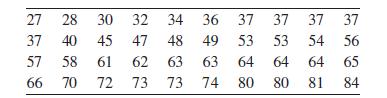
The National Health and Nutrition Examination Survey (NHANES) measured the serum HDL cholesterol levels in a large number of women. Following is a sample of 40 HDL levels (in milligrams per deciliter) that are based on the results of that survey. They have been sorted into numerical order.a. Find
Showing 6900 - 7000
of 7930
First
63
64
65
66
67
68
69
70
71
72
73
74
75
76
77
Last
Step by Step Answers