New Semester
Started
Get
50% OFF
Study Help!
--h --m --s
Claim Now
Question Answers
Textbooks
Find textbooks, questions and answers
Oops, something went wrong!
Change your search query and then try again
S
Books
FREE
Study Help
Expert Questions
Accounting
General Management
Mathematics
Finance
Organizational Behaviour
Law
Physics
Operating System
Management Leadership
Sociology
Programming
Marketing
Database
Computer Network
Economics
Textbooks Solutions
Accounting
Managerial Accounting
Management Leadership
Cost Accounting
Statistics
Business Law
Corporate Finance
Finance
Economics
Auditing
Tutors
Online Tutors
Find a Tutor
Hire a Tutor
Become a Tutor
AI Tutor
AI Study Planner
NEW
Sell Books
Search
Search
Sign In
Register
study help
business
elementary statistics
Elementary Statistics 3rd Edition William Navidi, Barry Monk - Solutions
According to the area principle, if one amount is twice as much as another, its image should have as much area as the other image.
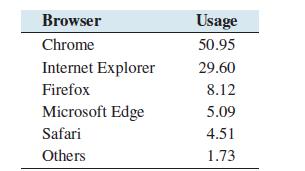
The following relative frequency distribution presents the usage in percent of various Internet browsers worldwide in 2016.a. Construct a relative frequency bar graph.b. Construct a pie chart.c. True or false: There are more than twice as many Chrome users than Internet Explorer users. Browser
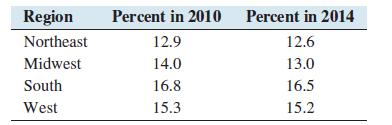
The following table presents the percentage of people who lived in poverty in the various regions of the United States in the years 2010 and 2014.a. Construct a side-by-side bar graph for these data.b. True or false: The poverty rate was lower in 2014 than in 2010 in each region.c. Which region had
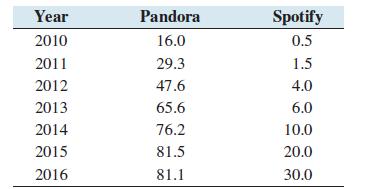
Following are the numbers of subscribers (in millions) to the music streaming services Pandora and Spotify for the years 2010 through 2016:a. Construct a time-series plot for the number of Pandora subscribers.b. Construct a time-series plot for the number of Spotify subscribers.c. Describe the
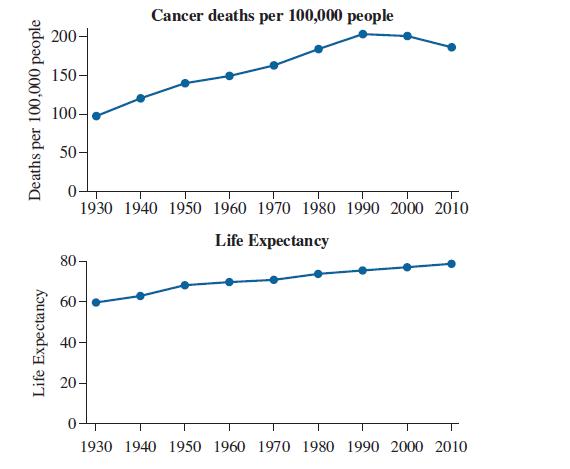
Cancer has long been the second most common cause of death (behind heart disease) in the United States.Cancer risk increases with age, so that older people are much more likely to be diagnosed with cancer than younger people. The following time series plots present the number of deaths from cancer
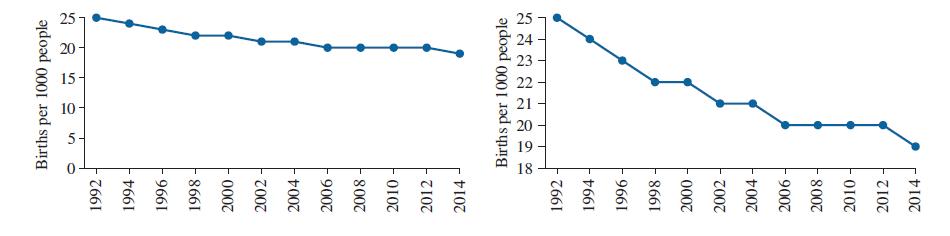
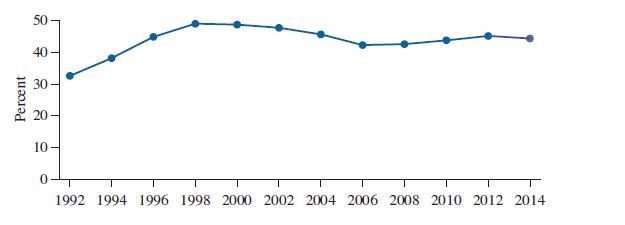
The following time-series plots both present estimates for the number of births per 1000 people worldwide for the years 1992–2014.Which of the following statements is more accurate? Explain your reasoning.(i) The birth rate decreased somewhat between 1992–2014.(ii) The birth rate decreased
In what ways do frequency distributions for qualitative data differ from those for quantitative data?
Provide an example of a data set whose histogram you would expect to be skewed to the right. Explain why you would expect the histogram to be skewed to the right.
Time-series data are discrete when observations are made at regularly spaced time intervals. The time-series data sets in this chapter are all discrete. Time-series data are continuous when there are observations at extremely closely spaced intervals that are connected to provide values at every
Find examples of graphs in newspapers, magazines, or on the Internet that are misleading in some way. Explain how they are misleading. Then find some that present accurate comparisons and explain why you believe they are accurate.
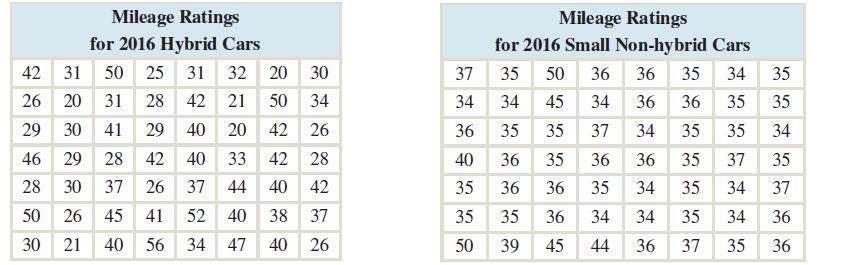
In the chapter introduction, we presented gas mileage data for 2016 model year hybrid and small non-hybrid cars. We will use histograms and back-to-back stem-and-leaf plots to compare the mileages between these two groups of cars. The following tables present the mileages, in miles per gallon.1.
Compute the mean and median of the following sample: 74 87 36 97 60 58 46
Compute the mean and median of the following sample: 69 17 75 96 74 80
Someone surveys the families in a certain town and reports that the mean number of children in a family is 2.1. Someone else says that this must be wrong, because it is impossible for a family to have 2.1 children. Comment.
A data set has a mean of 6 and a median of 4.Would you expect this data set to be skewed to the right, skewed to the left, or approximately symmetric?
A data set has a mean of 5 and a median of 7.Would you expect this data set to be skewed to the right, skewed to the left, or approximately symmetric?
A data set has a mean of 8 and a median of 8.1 Would you expect this data set to be skewed to the left, skewed to the right, or approximately symmetric?
A data set has a mean of 4 and a median of 3.8. Would you expect this data set to be skewed to the left, skewed to the right, or approximately symmetric?
Find the mode or modes, if they exist:a. The sample is 3, 6, 0, 1, 1, 8, 0, 1, 1.b. The sample is 4, 7, 4, 1, 6, 5, 6.c. The sample is 4, 8, 5, 9, 6, 3.
The _______________ is calculated by summing all data values and dividing by how many there are.In Exercises 9–12, fill in each blank with the appropriate word or phrase.
The ______________ is a number that splits the data set in half.In Exercises 9–12, fill in each blank with the appropriate word or phrase.
The median is resistant because it is not affected much by_________________.In Exercises 9–12, fill in each blank with the appropriate word or phrase.
The __________________ is the value in the data set that appears most frequently.In Exercises 9–12, fill in each blank with the appropriate word or phrase.
Every data set contains at least one mode.In Exercises 13–16, determine whether the statement is true or false. If the statement is false, rewrite it as a true statement.
The mean is resistant.In Exercises 13–16, determine whether the statement is true or false. If the statement is false, rewrite it as a true statement.
For most data sets that are skewed to the right, the mean is less than the median.In Exercises 13–16, determine whether the statement is true or false. If the statement is false, rewrite it as a true statement.
A mode is always a value that is in the data set.In Exercises 13–16, determine whether the statement is true or false. If the statement is false, rewrite it as a true statement.
Find the mean, median, and mode for the following data set: 12 27 26 27 25
Find the mean, median, and mode for the following data set: -20 15 21 -20 19
Find the mean, median, and mode for the following data set: 28-31 28 0 31 -23
Find the mean, median, and mode for the following data set: 83 98 22 89 99 98
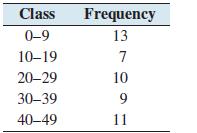
In Exercises 21–24, use the given frequency distribution to approximate the mean. Class Frequency 0-9 13 10-19 7 20-29 10 30-39 9 40-49 11
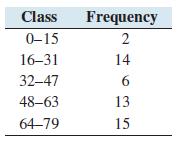
In Exercises 21–24, use the given frequency distribution to approximate the mean. Class Frequency 0-15 2 16-31 32-47 16 14 48-63 13 64-79 15
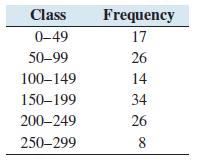
In Exercises 21–24, use the given frequency distribution to approximate the mean. Class Frequency 0-49 17 50-99 26 100-149 14 150-199 34 200-249 26 250-299 8
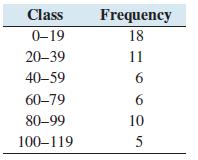
In Exercises 21–24, use the given frequency distribution to approximate the mean. Class Frequency 0-19 18 20-39 11 40-59 6 60-79 6 80-99 10 100-119 5
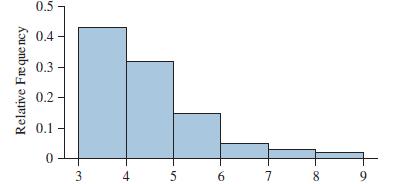
Use the properties of the mean and median to determine which are the correct mean and median for the following histogram.(i) Mean is 4.6; median is 5.0 (ii) Mean is 4.5; median is 4.2 (iii) Mean is 3.5; median is 4.3 (iv) Mean is 6.1; median is 5.6 Relative Frequency 2 % 8 0 3 4 5 9 7 8 9
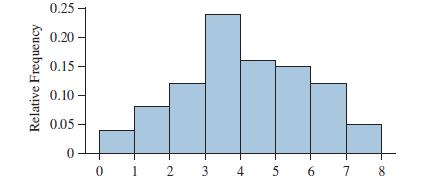
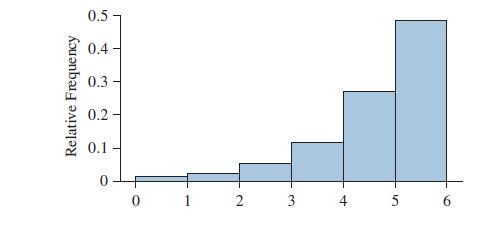
Use the properties of the mean and median to determine which are the correct mean and median for the following histogram.(i) Mean is 3.6; median is 4.8 (ii) Mean is 4.8; median is 3.6 (iii) Mean is 3.5; median is 3.1 (iv) Mean is 4.2; median is 4.1 Relative Frequency 0.25 0.20 0.15 0.10 0.05 0 0 1
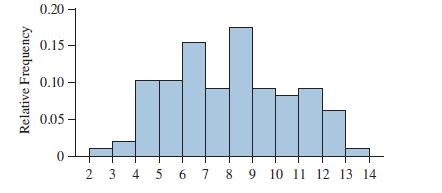
Use the properties of the mean and median to determine which are the correct mean and median for the following histogram.(i) Mean is 8.0; median is 8.1 (ii) Mean is 8.5; median is 6.5 (iii) Mean is 7.0; median is 8.3 (iv) Mean is 6.2; median is 6.1 Relative Frequency 0.20- 0.15- 0.10- 0.05- 2 3 4 5
Use the properties of the mean and median to determine which are the correct mean and median for the following histogram.(i) Mean is 3.0; median is 4.1 (ii) Mean is 4.2; median is 3.2 (iii) Mean is 4.4; median is 5.0 (iv) Mean is 4.3; median is 4.1 9 0 1 2 3 4 0 Relative Frequency
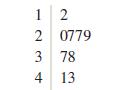
Find the mean, median, and mode of the data in the following stem-and-leaf plot. The leaf represents the ones digit. 1 2 2 0779 3 78 4 13
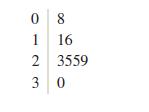
Find the mean, median, and mode of the data in the following stem-and-leaf plot. The leaf represents the ones digit. 08 1 16 2 3559 3 0
In a study of Facebook users conducted by the Pew Research Center, the mean number of Facebook friends per user was 245 and the median was 111.If a histogram were constructed for the numbers of Facebook friends for all Facebook users, would you expect it to be skewed to the right, skewed to the
The National Center for Health Statistics reported in a recent year that the mean height for U.S. women aged 20–29 was 64.3 inches, and the median was 64.2 inches. If a histogram were constructed for the heights of all U.S. women aged 20–29, would you expect it to be skewed to the right, skewed
According to the National Vital Statistics Reports, the mean life expectancy for United States was 78.7 years and the median was 83.5. If a histogram were constructed for the lifespans of all people in the United States, would you expect it to be skewed to the right, skewed to the left, or
The U.S. Census Bureau recently reported that the mean household income in the United States was $72,641 and the median was$53,657. If a histogram were constructed for the incomes of all U.S. households, would you expect it to be skewed to the right, skewed to the left, or approximately symmetric?
An ABC News story reported the number of calories in hamburgers from six fast-food restaurants: McDonald’s, Burger King, Wendy’s, Hardee’s, Sonic, and Dairy Queen. The results area. Find the mean number of calories.b. Find the median number of calories. 250 290 230 310 310 350
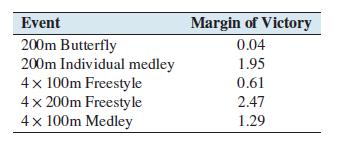
In the 2016 Olympic Games, Michael Phelps won five gold medals in swimming. Following are the events he won, along with his margin of victory, in seconds.a. What was the mean margin of victory?b. What was the median margin of victory?c. Assume the margin of victory in the 200m individual medley was
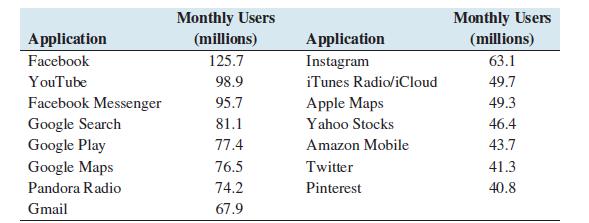
The following table presents the number of monthly users for the 15 most popular mobile apps as of June 2015.a. Find the mean number of monthly users.b. Find the median number of monthly users.c. Would you expect these data to be skewed to the right, skewed to the left, or approximately symmetric?
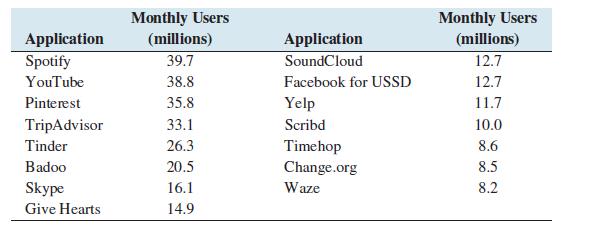
The following table presents the number of monthly users for the 15 most popular Facebook applications as of November 2015.a. Find the mean number of monthly users.b. Find the median number of monthly users.c. Would you expect these data to be skewed to the right, skewed to the left, or
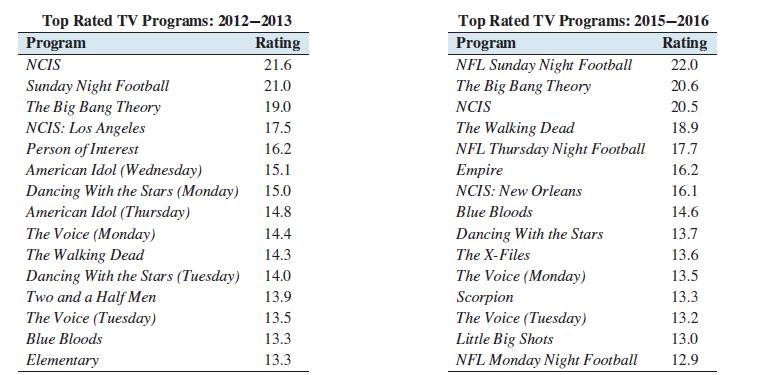
The following tables present the numbers of viewers, in millions for the top 15 prime-time shows for the 2012–2013 and 2015–2016 seasons. The numbers of viewers include those who watched the program on any platform, including time-shifting up to seven days after the original telecast.a. Find
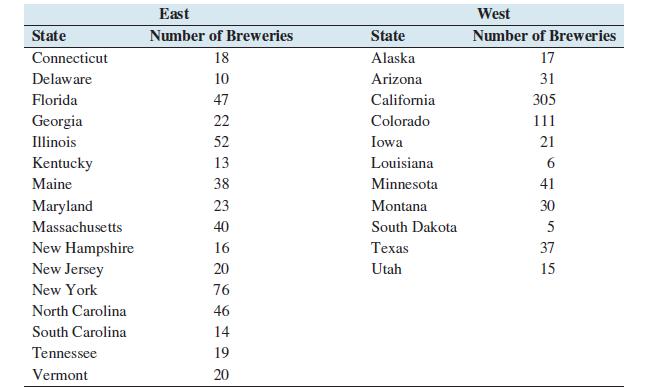
The following table presents the number of active breweries for samples of states located east and west of the Mississippi River.a. Find the mean number of breweries for states east of the Mississippi.b. Find the mean number of breweries for states west of the Mississippi.c. Find the median number
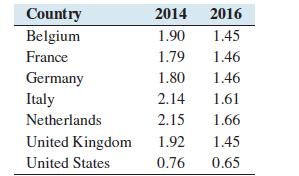
The following table presents the average price, in U.S. dollars per gallon, of unleaded regular gasoline in several countries in the years 2014 and 2016.a. Find the mean and median gas price for 2014.b. Find the mean and median gas price for 2016.c. Which decreased more between 2014 and 2016, the
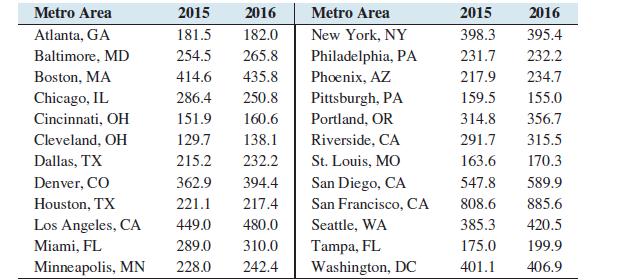
The following table presents prices, in thousands of dollars, of single-family homes for some of the largest metropolitan areas in the United States for the third quarter of 2015 and the third quarter of 2016.a. Find the mean and median price for 2015.b. Find the mean and median price for 2016.c.
Following are the weights, in pounds, for offensive and defensive linemen on the New York Giants National Football League team at the beginning of a recent year.a. Find the mean and median weight for the offensive linemen.b. Find the mean and median weight for the defensive linemen.c. Do offensive
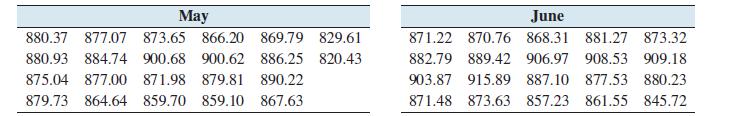
Following are the closing prices of Google stock for each trading day in May and June of a recent year.a. Find the mean and median price in May.b. Find the mean and median price in June.c. Does there appear to be a substantial difference in price between May and June, or are the prices about the
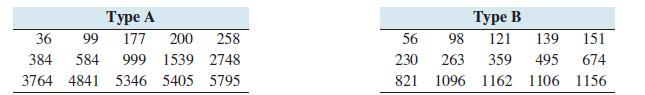
The following tables present the number of specimens that tested positive for Type A and Type B influenza in the United States during the first 15 weeks of a recent flu season.a. Find the mean and median number of Type A cases in the first 15 weeks of the flu season.b. Find the mean and median
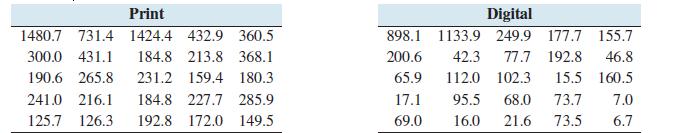
The following table presents the circulation (in thousands) for the top 25 U.S. daily newspapers in both print and digital editions.a. Find the mean and median circulation for print editions.b. Find the mean and median circulation for digital editions.c. The editor of an Internet news source says
Following are the amounts spent (in millions of dollars) on media advertising in the United States by a sample of 10 companies.a. Find the mean amount spent on advertising.b. Find the median amount spent on advertising.c. If the amount of 722.5 was incorrectly listed as 7225, how would this affect
The following data represent the annual costs in dollars, of a sample of 22 popular magazine subscriptions.a. Find the mean annual subscription cost.b. Find the median annual subscription cost.c. What is the mode?d. Which value in this data set is most accurately described as an extreme value?e.
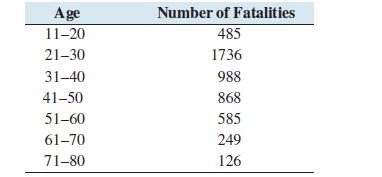
The Insurance Institute for Highway Safety reported that there were 5037 fatalities among drivers in auto accidents in a recent year. Following is a frequency distribution of their ages.a. Approximate the mean age.b. The first class consists of ages 11 through 20, but most drivers are at least 16
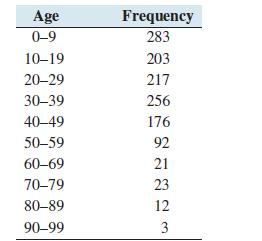
The ages of residents of Banks City, Oregon, are given in the following frequency distribution.a. Approximate the mean age.b. Assume all three people aged 90–99 were in fact 90 years old. Would this tend to make the approximate mean too large or too small?Explain. Age Frequency 0-9 283 10-19 203
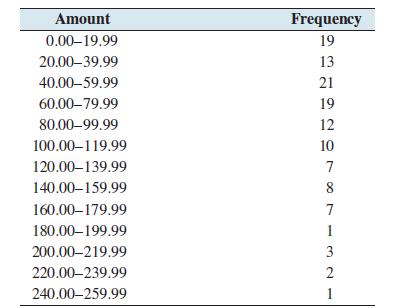
The following frequency distribution presents the amounts, in dollars, spent for Valentine’s Day gifts in a survey of 123 U.S. adults.a. Approximate the mean amount spent on Valentine’s Day gifts.b. If the majority of the people in the category 0.00–19.99 actually didn’t spend any money,
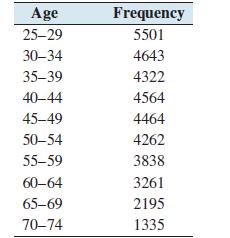
The following frequency distribution presents the number of U.S. adults (in thousands) ages 25 to 74 who have earned a Bachelor’s degree in a recent year.a. Approximate the mean age.b. If the majority of the people ages 70–74 were in fact 74, would this tend to make the approximate mean too
The personal income per capita of a state is the total income of all adults in the state, divided by the number of adults. The following table presents the personal income per capita (in thousands of dollars) for each of the 50 states and the District of Columbia.a. What is the mean state income?b.
The following table presents the weekly attendance, in thousands, at Broadway shows during a recent season.a. Find the mean and median weekly attendance.b. Based on the mean and median, would you expect that a histogram would be skewed to the left, skewed to the right, or approximately symmetric?
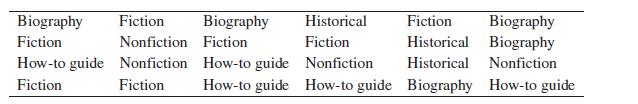
The following data represent the responses of 24 library patrons when asked about their favorite type of book. Which type of book is the mode? Biography Fiction Biography Historical Fiction Biography Fiction Nonfiction Fiction Fiction Historical Biography How-to guide Fiction Nonfiction Fiction
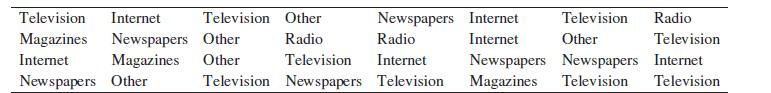
A sample of 32 U.S. adults was surveyed and asked, ‘‘Do you get most of your information about current events from newspapers, magazines, the Internet, television, radio, or some other source?’’ The results are shown below. What is the mode? Television Internet Magazines Newspapers
The National Center for Health Statistics sampled 5844 American women over the age of 20 and found that their median weight was 157.2 pounds. A histogram of the data set was skewed to the right. Which of the following is a possible value for the mean weight: 150 pounds, 155 pounds, or 160 pounds?
According to a recent Current Population Survey, the mean personal income for American adults was $38,337.A histogram for incomes is skewed to the right. Which of the following is a possible value for the median income, $26,000, $40,000, or$50,000?
In a recent year, approximately 1.7 million people took the mathematics section of the SAT. Of these, 42% scored less than 490, 45% scored less than 500, 49% scored less than 510, 52% scored less than 520, and 55% scored less than 530.In what interval is the median score?i. Between 490 and 500 ii.
The National Health and Nutrition Examination Survey measured the heights, in inches, of a large number of American adult men. Of these heights, 33% were less than 68, 42% were less than 69, 59% were less than 70, and 71% were less than 71.In what interval is the median height?i. Between 68 and 69
There are 2500 women and 2000 men enrolled in a certain college. The mean height for the women is 64.4 inches, and the mean height for the men is 69.8 inches.a. Find the sum of the heights of the women.b. Find the sum of the heights of the men.c. Find the mean height for all 4500 people.d. The
There are two sections of an introductory statistics course. Section A has 25 students and section B has 30 students. All students took the same final exam. The mean score in section A was 82 and the mean score in section B was 78.a. Find the sum of the scores in section A.b. Find the sum of the
There are 35 students in a class. Fifteen of them are men and 20 of them are women. The mean height of the men is 69.65 inches and the mean height of all 35 students is 66.85 inches. What is the mean height of the women?
There are two sections of an elementary statistics course. Section A has 25 students and section B has 35 students. All students took the same final exam. The mean score in section A was 72 and the mean score for all 60 students was 79.What was the mean score in section B?
A data set has a median of 17, and six of the numbers in the data set are less than 17.The data set contains a total of n numbers.a. If n is odd, and exactly one number in the data set is equal to 17, what is the value of n?b. If n is even, and none of the numbers in the data set are equal to 17,
A data set has a median of 10, and eight of the numbers in the data set are less than 10.The data set contains a total of n numbers.a. If n is odd, and exactly one of the numbers in the data set is equal to 10, what is the value of n?b. If n is even, and two of the numbers in the data set are equal
Jermaine has entered a bowling tournament. To prepare, he bowls five games each day and writes down the score of each game, along with the mean of the five scores. He is looking at the scores from one day last week and finds that one of the numbers has accidentally been erased. The four remaining
Addison has been told that her average on six homework assignments in her history class is 85.She can find only five of the six assignments, which have scores of 91, 72, 96, 88, and 75.What is the score on the lost homework assignment?
Rachel worked at three part-time jobs last week. At one job, she worked 20 hours at a salary of $12 per hour, at another she worked 10 hours at $15 per hour, and at the third she worked 12 hours at $10 per hour. What was her mean hourly wage?
In Jacob’s statistics class, the final grade is a weighted mean of a homework grade, three midterm exam grades, and a final exam grade. The homework counts for 10% of the final grade, each midterm counts for 20%, and the final exam counts for 30%. Jacob got a score of 70 on the homework, 60, 75,
The Smith family in Example 3.5 had the good fortune to win a million-dollar prize in a lottery. Their annual income for each of the five years leading up to their lottery win are as follows:a. Compute the mean annual income.b. Compute the median annual income.c. Which provides a more appropriate
Make up a data set in which the mean is equal to one of the numbers in the data set.
Make up a data set in which the median is equal to one of the numbers in the data set.
Make up a data set in which the mean is not equal to one of the numbers in the data set.
Make up a data set in which the median is not equal to one of the numbers in the data set.
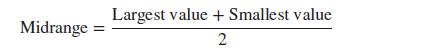
The midrange is a measure of center that is computed by averaging the largest and smallest values in a data set. In other words,Is the midrange resistant? Explain. Largest value + Smallest value Midrange 2
A data set contains only two values. Are the mean, median, and midrange all equal? Explain.
A sample of five college students have heights, in inches, of 65, 72, 68, 67, and 70.a. Compute the sample mean.b. Compute the sample median.c. Convert each of the heights to units of feet, by dividing by 12.d. Compute the sample mean of the heights in feet. Is this equal to the sample mean in
Four employees in an office have annual salaries of $30,000, $35,000, $45,000, and $70,000.a. Compute the mean salary.b. Compute the median salary.c. Each employee gets a $1000 raise. Compute the new mean. Does the mean increase by $1000?d. Each employee gets a 5% raise. Compute the new mean. Does
Consider the following data set:a. Show that the mean and median are both equal to 5.b. Suppose that a value of 26 is added to this data set. Which is affected more, the mean or the median?c. Suppose that a value of 100 is added to this data set. Which is affected more, the mean or the median?d. It
Consider the following data set:a. Compute the mean and median.b. Based on the mean and median, would you expect the data set to be skewed to the left, skewed to the right, or approximately symmetric? Explain.c. Construct a frequency histogram. Does the histogram have the shape you expected? 0 0 0
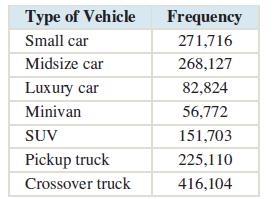
The following table presents a frequency distribution for the number of cars and light trucks sold in a recent month.a. Construct a bar graph.b. Construct a relative frequency distribution.c. Construct a relative frequency bar graph.d. Construct a pie chart. Type of Vehicle Frequency Small car
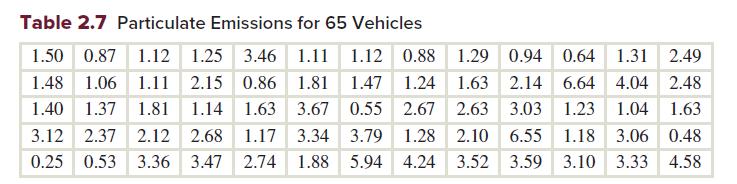
Using the data in Table 2.7, construct a frequency distribution with classes of width 0.5. Table 2.7 Particulate Emissions for 65 Vehicles 1.50 0.87 1.12 1.25 3.46 1.11 1.12 0.88 1.29 0.94 0.64 1.31 2.49 1.48 1.06 1.11 2.15 0.86 1.81 1.47 1.24 1.63 2.14 6.64 4.04 2.48 1.40 1.37 1.81 1.14 1.63 3.67
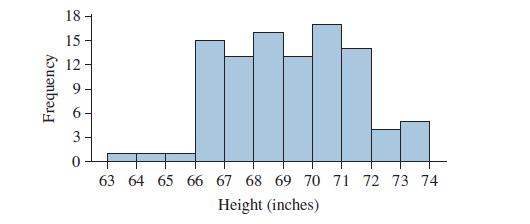
The following frequency histogram presents the heights, in inches, of a random sample of 100 male college students.a. How many classes are there?b. What is the class width?c. Which class has the highest frequency?d. What percentage of students are more than 72 inches tall?e. Is the histogram most
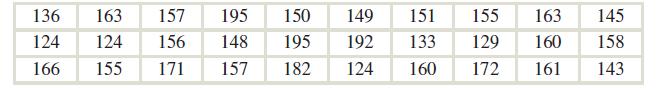
The following table presents weights in pounds for a group of male college freshmen.a. List the stems for a stem-and-leaf plot.b. For each item in the data set, write its leaf next to its stem.c. Rearrange the leaves in numerical order to create a stem-and-leaf plot. 136 163 157 195 150 149 151 155
The National Institute on Drug Abuse surveyed U.S. high school seniors every two years to determine the percentage who said they had used marijuana one or more times. The following time-series plot presents the results.a. During what year was marijuana use among high school students the highest?b.
In a stem-and-leaf plot, the rightmost digit of each data value is the _______________.In Exercises 3–6, fill in each blank with the appropriate word or phrase.
In a back-to-back stem-and-leaf plot, each of the two data sets plotted must have the same _______________.In Exercises 3–6, fill in each blank with the appropriate word or phrase.
A_______________ is useful when the data consist of values measured at different points in time.In Exercises 3–6, fill in each blank with the appropriate word or phrase.
Showing 7200 - 7300
of 7930
First
66
67
68
69
70
71
72
73
74
75
76
77
78
79
80
Step by Step Answers