New Semester
Started
Get
50% OFF
Study Help!
--h --m --s
Claim Now
Question Answers
Textbooks
Find textbooks, questions and answers
Oops, something went wrong!
Change your search query and then try again
S
Books
FREE
Study Help
Expert Questions
Accounting
General Management
Mathematics
Finance
Organizational Behaviour
Law
Physics
Operating System
Management Leadership
Sociology
Programming
Marketing
Database
Computer Network
Economics
Textbooks Solutions
Accounting
Managerial Accounting
Management Leadership
Cost Accounting
Statistics
Business Law
Corporate Finance
Finance
Economics
Auditing
Tutors
Online Tutors
Find a Tutor
Hire a Tutor
Become a Tutor
AI Tutor
AI Study Planner
NEW
Sell Books
Search
Search
Sign In
Register
study help
business
elementary statistics
Elementary Statistics 3rd Edition William Navidi, Barry Monk - Solutions
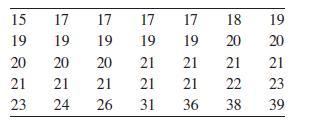
Jamie drives to work every weekday morning. She keeps track of the time it takes, in minutes, for 35 days. The results follow.a. Find the first and third quartiles of these data.b. Find the median of these data.c. Find the upper and lower outlier boundaries.d. Are there any outliers? If so, list
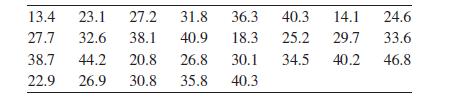
Following are wind speeds (in mph) for 29 randomly selected days in San Francisco.a. Find the first and third quartiles of these data.b. Find the median of these data.c. Find the upper and lower outlier boundaries.d. Are there any outliers? If so, list them.e. Construct a boxplot for these data.f.
Following are the number of grams of carbohydrates in 12-ounce espresso beverages offered at Starbucks.a. Find the first and third quartiles of these data.b. Find the median of these data.c. Find the upper and lower outlier boundaries.d. The beverage with the most carbohydrates is a Peppermint
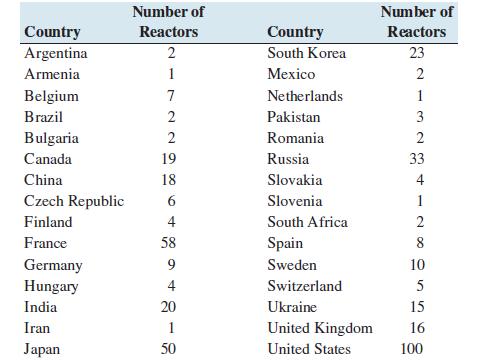
The following table presents the number of nuclear reactors in a recent year, in each country that had one or more reactors.a. Find the first and third quartiles of these data.b. Find the median of these data.c. Find the upper and lower outlier boundaries.d. Which countries are outliers?e.
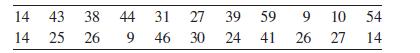
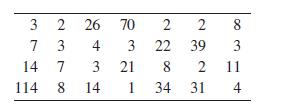
In a recent year, 28 states in the U.S. had one or more tribal gambling casinos. The following table presents the number of tribal casinos in each of those states.a. Find the first and third quartiles of these data.b. Find the median of these data.c. Find the upper and lower outlier boundaries.d.
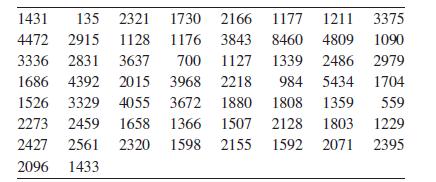
There have been 58 presidential inaugurations in U.S. history. At each one, the president has made an inaugural address. Following are the number of words spoken in each of these addresses.a. Find the first and third quartiles of these data.b. Find the median of these data.c. Find the upper and
There are 151 Generation I Pok´emon characters. Each Pok´emon has a base number of hit points, which determines the health of the Pok´emon.a. Charmander is a Pok´emon with 39 hit points. There are 19 Pok´emon with fewer hit points and 131 Pok´emon with more.On what percentile is Charmander?b.
There are 77 football stadiums (both college and professional) in the United States with seating capacities of 60,000 or more.a. The largest stadium to host an NFL team is MetLife Stadium in East Rutherford, New Jersey, which is the home of the New York Giants and New York Jets. The capacity of
After learning his score on a recent statistics exam, Ed bragged to his friends: ‘‘My score is the first quartile of the class.’’ Did Ed have a good reason to brag? Explain.
On a final exam in a large statistics class, Tom’s score was the tenth percentile, Dick’s was the median, and Harry’s was the third quartile. Which of the three scores was the highest? Which was the lowest?
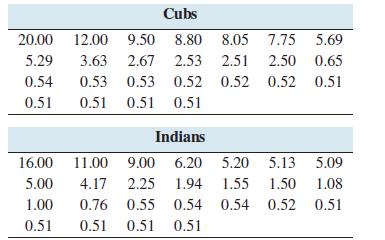
In 2016, the Chicago Cubs defeated the Cleveland Indians to become the champions of Major League Baseball. Following are the salaries, in millions of dollars, of the players on each of these teams.a. Find the median, the first quartile, and the third quartile of the Cubs’ salaries.b. Find the
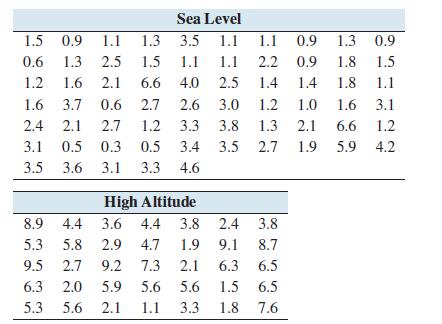
Following are levels of particulate emissions for 65 vehicles driven at sea level, and for 35 vehicles driven at high altitude.a. Find the median, the first quartile, and the third quartile of the sea-level emissions.b. Find the median, the first quartile, and the third quartile of the
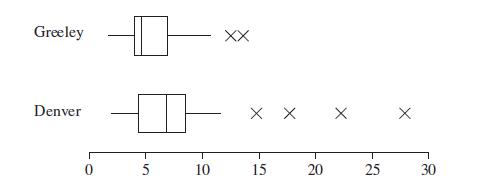
Following are boxplots of the level of fine particle air pollution, in micrograms per cubic meter, in the cities of Denver and Greeley, Colorado, during a recent winter.a. In which city is the pollution level generally higher?b. Approximately what percentage of the values for Greeley are greater
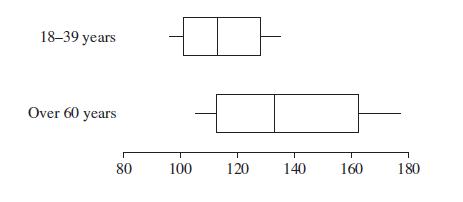
Following are boxplots of diastolic blood pressure, in millimeters, for a sample of people aged 18–39 years, and a sample over 60 years old. The data are consistent with results reported by the National Health Statistics Reports.a. Which group generally has higher blood pressure?b. Approximately
The most recent United States Census reported the per capita incomes for each of the 50 states.The five-number summary, in thousands of dollars, is Minimum: 20.0, Q1: 24.1, Median: 25.7, Q3: 29.0, Maximum: 34.8a. Does the five-number summary provide enough information to construct a boxplot? If so,
Following is the five-number summary for the populations, in millions, for the 50 states of the United States.Minimum: 0.58, Q1: 1.86, Median: 4.49, Q3: 6.90, Maximum: 38.04a. Does the five-number summary provide enough information to construct a boxplot? If so, construct the boxplot. If not,
Ten residents of a town were asked how many children they had. The responses were as follows.a. Explain why the median and first quartile are the same.b. Construct a boxplot for these data.c. Explain why the boxplot has no left whisker. 0 0 3 1 0 0 4 0 7 0
Make up a list of numbers whose boxplot has no whiskers.
Make up a data set in which the mean is greater than the third quartile.
Make up a data set in which the mean is less than the first quartile.
Seven families live on a small street in a certain town. Their annual incomes (in $1000s) are 15, 20, 30, 35, 50, 60, and 150.a. Find the first and third quartiles, and the IQR.b. Show that 150 is an outlier.A big new house is built on the street, and the income (in $1000s) of the family that moves
If we divide a data set into four approximately equal parts, the three dividing points are called quartiles. If we divide a data set into 100 approximately equal parts, the 99 dividing points are called percentiles. In general, if we divide a data set into k approximately equal parts, we can call
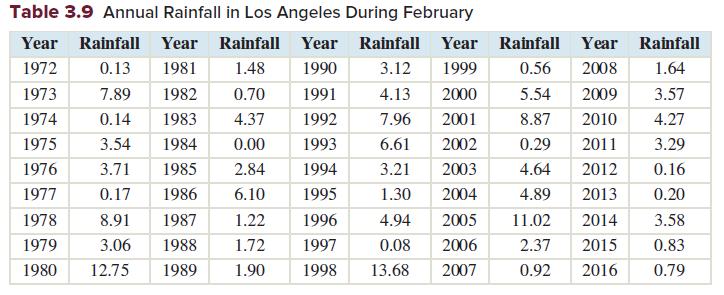
Table 3.9 presents the February rainfalls in Los Angeles for the period 1972–2016.a. Show that the mean of these data is μ = 3.624 and the population standard deviation is σ = 3.410.b. Show that the z-score for a rainfall of 0 (rounded to two decimal places) is z = −1.06.c. Show that the
Of the mean, median, and mode, which must be a value that actually appears in the data set?
The prices (in dollars) for a sample of personal computers are: 550, 700, 420, 580, 550, 450, 690, 390, 350.Calculate the mean, median, and mode for this sample.
If a computer with a price of $2000 were added to the list in Exercise 2, which would be affected more, the mean or the median?
In general, a histogram is skewed to the left if the__________________ is noticeably less than the ___________________ .
A sample of 100 students was asked how many hours per week they spent studying. The following frequency table shows the results:a. Approximate the mean time this sample of students spent studying.b. Approximate the standard deviation of the time this sample of students spent studying. Number of
A sample has a variance of 16.What is the standard deviation?
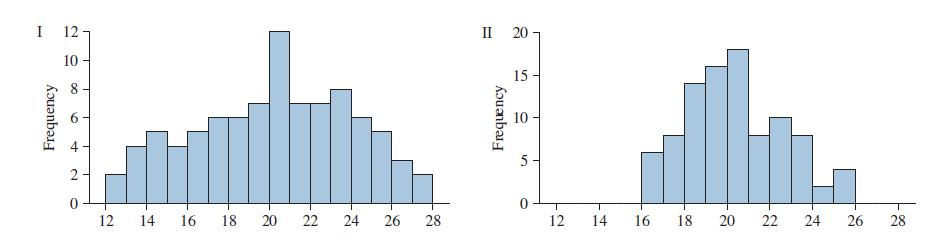
Each of the following histograms represents a data set with mean 20.One has a standard deviation of 3.96 and the other has a standard deviation of 2.28. Which is which? Fill in the blanks: Histogram I has a standard deviation of ___________________ and histogram II has a standard deviation of
Assume that the histogram of starting salaries is approximately bell-shaped. Approximately what percentage of the salaries will be between \($34,680\) and $40,280?In Exercises 8–11, suppose that the mean starting salary of social workers in a specific region is \($37,480\) with a standard
Assume it is not known whether the histogram of starting salaries is bell-shaped. Fill in the blank: At least percent of the salaries will be between \($34,680\) and $40,280.In Exercises 8–11, suppose that the mean starting salary of social workers in a specific region is \($37,480\) with a
John’s starting salary is \($38,180\). What is the z-score of his salary?In Exercises 8–11, suppose that the mean starting salary of social workers in a specific region is \($37,480\) with a standard deviation of $1,400.
Find the coefficient of variation of the salaries.In Exercises 8–11, suppose that the mean starting salary of social workers in a specific region is \($37,480\) with a standard deviation of $1,400.
True or false: If a student’s exam grade is on the 55th percentile, then approximately 45% of the scores are below his or her grade.In Exercises 8–11, suppose that the mean starting salary of social workers in a specific region is \($37,480\) with a standard deviation of $1,400.
The five-number summary for a sample is 7, 18, 35, 62, 85.What is the IQR?In Exercises 8–11, suppose that the mean starting salary of social workers in a specific region is \($37,480\) with a standard deviation of $1,400.
The prices (in dollars) for a sample of coffee makers are:19 22 29 68 35 37 28 22 41 39 28a. Find the first and third quartiles.b. Find the upper and lower outlier boundaries.c. Are there any outliers? If so, list them.In Exercises 8–11, suppose that the mean starting salary of social workers in
Construct a boxplot for the data in Exercise 14.Exercise 14 The prices (in dollars) for a sample of coffee makers are:19 22 29 68 35 37 28 22 41 39 28.In Exercises 8–11, suppose that the mean starting salary of social workers in a specific region is \($37,480\) with a standard deviation of $1,400.
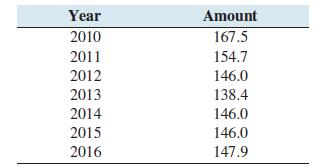
Following are the annual amounts of federal support (in millions of dollars) for National Endowment for the Arts programs for the years 2010 through 2016.a. Find the mean annual amount of federal aid from 2010 through 2016.b. Find the median annual amount of federal aid from 2010 through 2016. Year
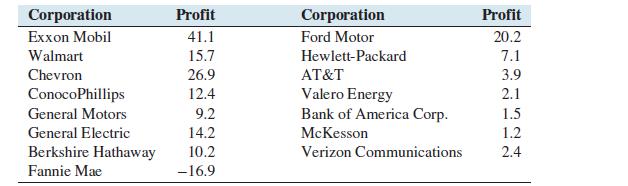
The following table presents the profit, in a recent year, in billions of dollars, for each of the 15 largest U.S. corporations in terms of revenue.a. Find the mean profit.b. Find the median profit.c. Are these data skewed to the right, skewed to the left, or approximately symmetric? Explain.
A manufacturer of cell phone batteries determines that the average length of talk time for one of its batteries is 470 minutes. Suppose that the standard deviation is known to be 32 minutes and that the data are approximately bell-shaped. Estimate the percentage of batteries that have z-scores
Using the data in Exercise 2:a. Find the first and third quartiles of the profit.b. Find the median profit.c. Find the upper and lower outlier boundaries.d. Are there any outliers? If so, list them.e. Construct a boxplot for these data. Exercise 2The following table presents the profit, in a
Percentiles are values that divide a data set into hundredths. The values that divide a data set into tenths are called deciles, denoted D1,D2, ...,D9. Describe the relationship between percentiles and deciles.
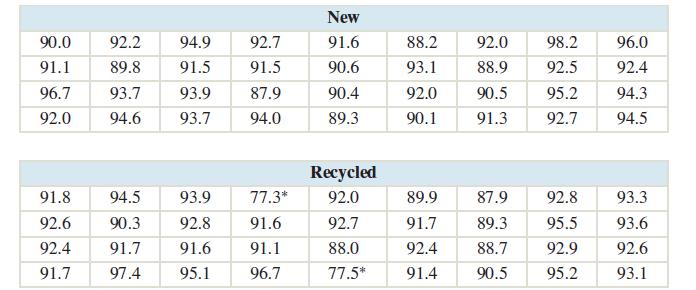
Electronic devices contain electric circuits etched into wafers made of silicon. These silicon wafers are sealed with an ultrathin layer of silicon dioxide, in a process known as oxidation. This can be done with either new or recycled wafers.In a study described in the book Statistical Case Studies
Fill in the blank: If large values of one variable are associated with small values of another, then the two variables have a _______________________ association.
Fill in the blank: If two variables have a positive association, then large values of one variable are associated with __________________ values of the other.
Fill in the blank: If the points on a scatterplot tend to cluster around a straight line, the variables plotted have a ___________________ association.
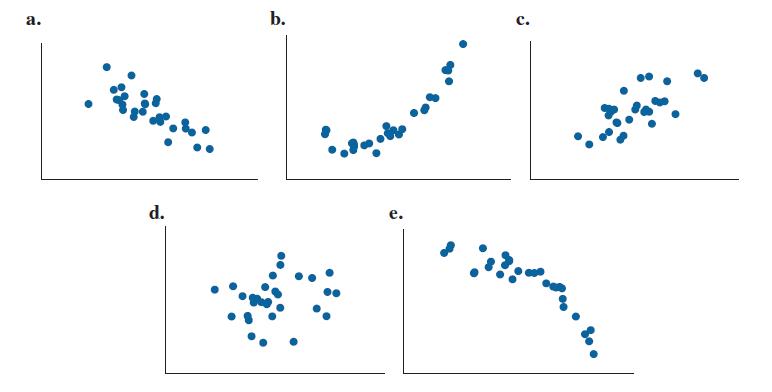
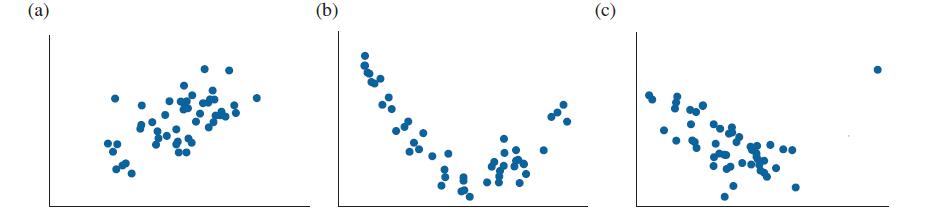
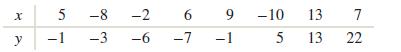
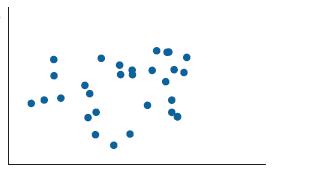
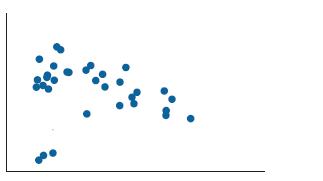
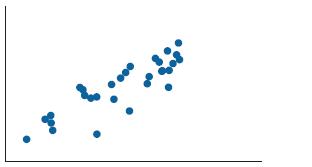
For each of the following scatterplots, state the type of association that is exhibited:Choices: positive linear, negative linear, positive nonlinear, negative nonlinear, weak linear. b. d. e.
For each of the following pairs of variables, determine whether the association is positive or negative, and explain why.a. Would the association between outdoor temperature and consumption of heating oil be positive or negative? Explain.b. The number of years of education a person has and the
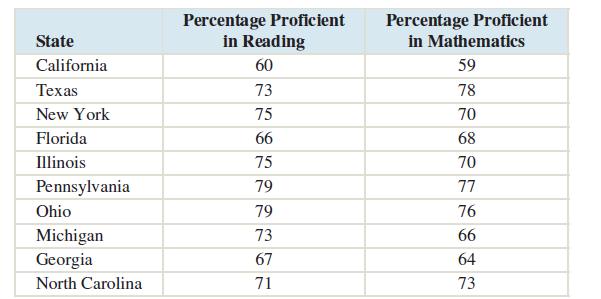
The National Assessment for Educational Progress (NAEP) is a U.S. government organization that assesses the performance of students and schools at all levels across the United States. The following table presents the percentage of eighth-grade students who were found to be proficient in
For which of the following scatterplots is the correlation coefficient an appropriate summary? (a) (b) (c)
An economist discovers that over the past several years, both the salaries of U.S.college professors and the amount of beer consumed in the United States have gone up. Thus, there is a positive correlation between the average salary of college professors and the amount of beer consumed. The
Bivariate data consist of ordered _________________.In Exercises 9–12, fill in each blank with the appropriate word or phrase.
In a ________________, ordered pairs are plotted on a set of axes.In Exercises 9–12, fill in each blank with the appropriate word or phrase.
Two variables have a _________________ relationship if the data tend to cluster around a straight line.In Exercises 9–12, fill in each blank with the appropriate word or phrase.
The correlation coefficient measures only the strength of the _________________ relationship between variables.In Exercises 9–12, fill in each blank with the appropriate word or phrase.
Two variables are negatively associated if large values of one variable are associated with large values of the other.In Exercises 13–16, determine whether the statement is true or false. If the statement is false, rewrite it as a true statement.
If the correlation coefficient r equals 1, then the points on a scatterplot lie exactly on a straight line.In Exercises 13–16, determine whether the statement is true or false. If the statement is false, rewrite it as a true statement.
The correlation coefficient is not resistant.In Exercises 13–16, determine whether the statement is true or false. If the statement is false, rewrite it as a true statement.
When two variables are correlated, changing the value of one variable will cause a change in value of the other variable.In Exercises 13–16, determine whether the statement is true or false. If the statement is false, rewrite it as a true statement.
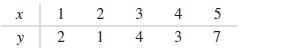
In Exercises 17–20, compute the correlation coefficient. x 1 y 2 2 34 14 4 3 4 5 7
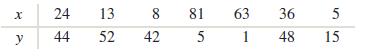
In Exercises 17–20, compute the correlation coefficient. x 24 13 8 81 63 36 5 y 44 52 42 5 1 48 15
In Exercises 17–20, compute the correlation coefficient. x 5.5 4.2 4.7 5.6 6.0 3.9 6.3 5.7 y 4.9 4.8 4.8 4.7 5.5 5.1 5.8 6.5
In Exercises 17–20, compute the correlation coefficient. x 5 -8 -2 y -1 -3 -6 26 6 9 -10 13 7 -7 -1 5 13 22
In Exercises 21–24, determine whether the correlation coefficient is an appropriate summary for the scatterplot and explain your reasoning.
In Exercises 21–24, determine whether the correlation coefficient is an appropriate summary for the scatterplot and explain your reasoning.
In Exercises 21–24, determine whether the correlation coefficient is an appropriate summary for the scatterplot and explain your reasoning.
In Exercises 21–24, determine whether the correlation coefficient is an appropriate summary for the scatterplot and explain your reasoning.
A person’s age and the person’s income.In Exercises 25–30, determine whether the association between the two variables is positive or negative.
The age of a car and its resale value.In Exercises 25–30, determine whether the association between the two variables is positive or negative.
The age of a car and the number of miles on its odometer.In Exercises 25–30, determine whether the association between the two variables is positive or negative.
The number of times a pencil is sharpened and its length.In Exercises 25–30, determine whether the association between the two variables is positive or negative.
The diameter of an apple and its weight.In Exercises 25–30, determine whether the association between the two variables is positive or negative.
Weekly ice cream sales and weekly average temperature.In Exercises 25–30, determine whether the association between the two variables is positive or negative.
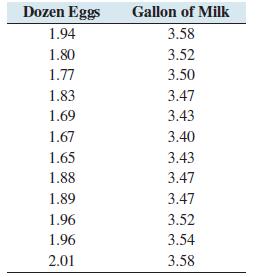
The following table presents the average price in dollars for a dozen eggs and a gallon of milk for each month in a recent year.a. Construct a scatterplot of the price of milk (y) versus the price of eggs (x).b. Compute the correlation coefficient between the price of eggs and the price of milk.c.
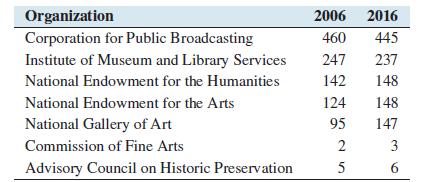
The following table presents the budget (in millions of dollars) for selected organizations that received U.S. government funding for arts and culture in both 2006 and 2016.a. Construct a scatterplot of the funding in 2016 (y) versus the funding in 2006 (x).b. Compute the correlation coefficient
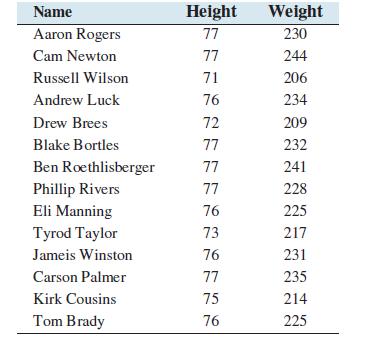
The following table lists the heights (inches) and weights (pounds) of 14 National Football League quarterbacks in the 2016 season.a. Construct a scatterplot of the weight (y) versus the height (x).b. Compute the correlation coefficient between the height and weight of the quarterbacks.c. If a
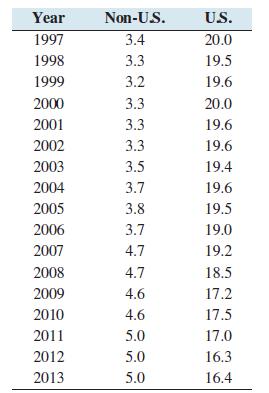
Carbon dioxide (CO2) is produced by burning fossil fuels such as oil and natural gas, and has been connected to global warming. The following table presents the average amounts (in metric tons) of CO2 emissions for the years 1997–2013 per person in the United States and per person in the rest of
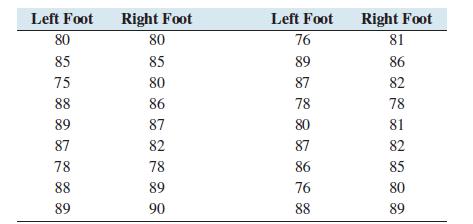
Foot ulcers are a common problem for people with diabetes. Higher skin temperatures on the foot indicate an increased risk of ulcers. In a study performed at the Colorado School of Mines, skin temperatures on both feet were measured, in degrees Fahrenheit, for 18 diabetic patients. The results are
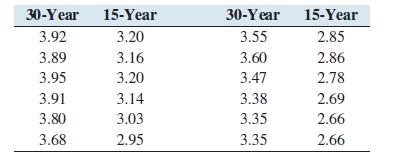
The following table presents monthly interest rates, in percent, for 30-year and 15-year fixed-rate mortgages, for a recent year.a. Construct a scatterplot of the 15-year rate (y) versus the 30-year rate (x).b. Compute the correlation coefficient between 30-year and 15-year rates.c. When the
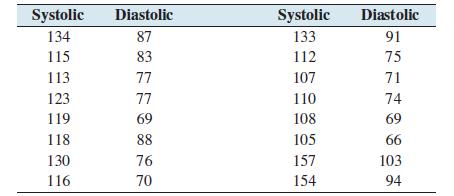
A blood pressure measurement consists of two numbers: the systolic pressure, which is the maximum pressure taken when the heart is contracting, and the diastolic pressure, which is the minimum pressure taken at the beginning of the heartbeat. Blood pressures were measured, in millimeters of
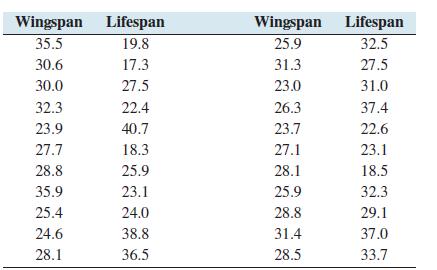
Do larger butterflies live longer? The wingspan (in millimeters) and the lifespan in the adult state (in days) were measured for 22 species of butterfly. Following are the results.a. Construct a scatterplot of the lifespan (y) versus the wingspan (x).b. Compute the correlation coefficient between
In a survey of cities in the United States, it is discovered that there is a positive correlation between the number of police officers hired by the city and the number of crimes committed. Do you believe that increasing the number of police officers causes the crime rate to increase? Why or why
A survey of U.S. adults showed that there is a negative correlation between age and education level. Does this mean that people become less educated as they become older? Why or why not?
In a sample of adults, would the correlation between age and year graduated from high school be closest to −1, −0.5, 0, 0.5, or 1? Explain.
In a sample of adults, would the correlation between year of birth and year graduated from high school be closest to −1, −0.5, 0, 0.5, or 1? Explain.
A small company has five employees. The following table presents the number of years each has been employed (x) and the hourly wage in dollars (y).a. Compute ̄x, ̄y, sx, and sy.b. Compute the correlation coefficient between years of service and hourly wage.c. Each employee is given a raise of
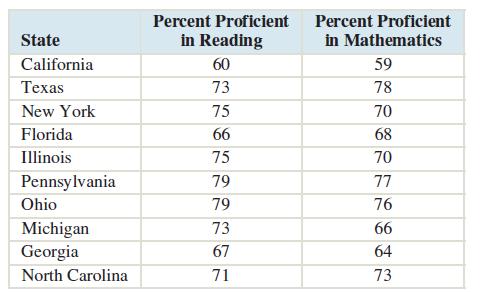
The following table presents the percentage of students who tested proficient in reading and the percentage who tested proficient in math for each of the 10 most populous states in the United States. Compute the least-squares regression line for predicting math proficiency from reading proficiency.
At the final exam in a statistics class, the professor asks each student to indicate how many hours he or she studied for the exam. After grading the exam, the professor computes the least-squares regression line for predicting the final exam score from the number of hours studied. The equation of
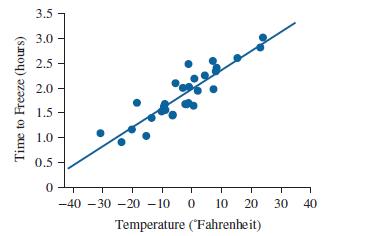
For each of the following plots, interpret the y-intercept of the least-squares regression line if possible. If not possible, explain why not.a. The least-squares regression line is ŷ = 1.98 + 0.039x, where x is the temperature in a freezer in degrees Fahrenheit, and y is the time it takes to
The Sanchez family wants to sell their house, which is 2800 square feet in size.Mr. Sanchez notices that the slope of the least-squares regression line for predicting price from size is 0.0992. He says that if they put a 250-square-foot addition on their house, the selling price will increase by
When we are given the value of the _____________________ variable, we can use the least-squares regression line to predict the value of the ______________________ variable.In Exercises 5–7, fill in each blank with the appropriate word or phrase.
If the correlation coefficient is equal to 0, the slope of the least-squares regression line will be equal to _____________________ .In Exercises 5–7, fill in each blank with the appropriate word or phrase.
If the least-squares regression line has slope b1 = 5, and two x-values differ by 3, the predicted difference in the y-values is _____________________.In Exercises 5–7, fill in each blank with the appropriate word or phrase.
Substituting the value of the explanatory variable for x in the equation of the least-squares regression line results in a prediction for y.In Exercises 8–12, determine whether the statement is true or false. If the statement is false, rewrite it as a true statement.
The least-squares regression line passes through the point of averages (̄x, ̄y).In Exercises 8–12, determine whether the statement is true or false. If the statement is false, rewrite it as a true statement.
In general, the slope of the least-squares regression line is equal to the correlation coefficient.In Exercises 8–12, determine whether the statement is true or false. If the statement is false, rewrite it as a true statement.
The least-squares regression line predicts the result of changing the value of the explanatory variable.In Exercises 8–12, determine whether the statement is true or false. If the statement is false, rewrite it as a true statement.
The y-intercept b0 of a least-squares regression line has a useful interpretation only if the x-values are either all positive or all negative.In Exercises 8–12, determine whether the statement is true or false. If the statement is false, rewrite it as a true statement.
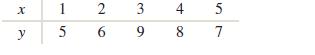
In Exercises 13–16, compute the least-squares regression line for the given data set. xy 1 2 3 5 5 6 9 7
Showing 7000 - 7100
of 7930
First
64
65
66
67
68
69
70
71
72
73
74
75
76
77
78
Last
Step by Step Answers