New Semester
Started
Get
50% OFF
Study Help!
--h --m --s
Claim Now
Question Answers
Textbooks
Find textbooks, questions and answers
Oops, something went wrong!
Change your search query and then try again
S
Books
FREE
Study Help
Expert Questions
Accounting
General Management
Mathematics
Finance
Organizational Behaviour
Law
Physics
Operating System
Management Leadership
Sociology
Programming
Marketing
Database
Computer Network
Economics
Textbooks Solutions
Accounting
Managerial Accounting
Management Leadership
Cost Accounting
Statistics
Business Law
Corporate Finance
Finance
Economics
Auditing
Tutors
Online Tutors
Find a Tutor
Hire a Tutor
Become a Tutor
AI Tutor
AI Study Planner
NEW
Sell Books
Search
Search
Sign In
Register
study help
business
elementary statistics
Elementary Statistics 3rd Edition William Navidi, Barry Monk - Solutions
In a time-series plot, the horizontal axis represents _______________.In Exercises 3–6, fill in each blank with the appropriate word or phrase.
Stem-and-leaf plots and dotplots provide a simple way to display data for small data sets.In Exercises 7–10, determine whether the statement is true or false. If the statement is false, rewrite it as a true statement.
In a stem-and-leaf plot, each stem must be a single digit.In Exercises 7–10, determine whether the statement is true or false. If the statement is false, rewrite it as a true statement.
In a dotplot, the number of dots in a vertical column represents the number of times a certain value appears in a data set.In Exercises 7–10, determine whether the statement is true or false. If the statement is false, rewrite it as a true statement.
In a time-series plot, the vertical axis represents time.In Exercises 7–10, determine whether the statement is true or false. If the statement is false, rewrite it as a true statement.
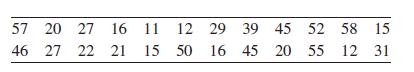
Construct a stem-and-leaf plot for the following data. 57 20 27 16 11 12 29 39 45 52 58 15 46 27 27 22 21 22 21 15 50 16 45 20 55 12 31
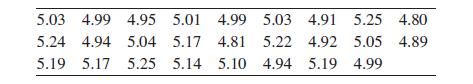
Construct a stem-and-leaf plot for the following data, in which the leaf represents the hundredths digit. 5.03 4.99 4.95 5.01 4.99 5.03 4.91 5.25 4.80 5.24 4.94 5.04 5.17 4.81 5.22 4.92 5.05 4.89 5.19 5.17 5.25 5.14 5.10 4.94 5.19 4.99
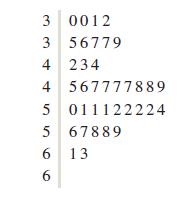
List the data in the following stem-and-leaf plot. The leaf represents the ones digit. 3 0012 3 56779 4 4 33445566 234 567777889 5 011122224 5 67889 6 13
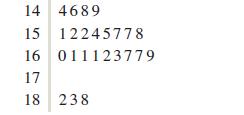
List the data in the following stem-and-leaf plot. The leaf represents the tenths digit. 14 4689 15 12245778 16 011123779 17 18 238
Construct a dotplot for the data in Exercise 11.Exercise 11 Construct a stem-and-leaf plot for the following data. 57 20 27 16 11 12 29 39 45 52 58 15 46 27 27 22 21 22 21 15 50 16 45 20 55 12 31
Construct a dotplot for the data in Exercise 12.Exercise 12Construct a stem-and-leaf plot for the following data, in which the leaf represents the hundredths digit. 5.03 4.99 4.95 5.01 4.99 5.03 4.91 5.25 4.80 5.24 4.94 5.04 5.17 4.81 5.22 4.92 5.05 4.89 5.19 5.17 5.25 5.14 5.10 4.94 5.19 4.99
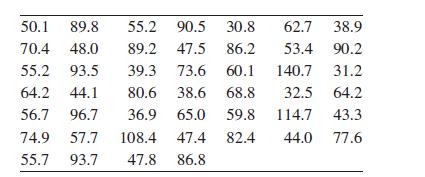
The following table presents the manufacturer’s suggested retail price (in $1000s) for 2003 base models and styles of BMW automobiles.a. Round the data to the nearest whole number (round .5 up)and construct a stem-and-leaf plot, using the numbers 3 through 14 as the stems.b. Repeat part (a), but
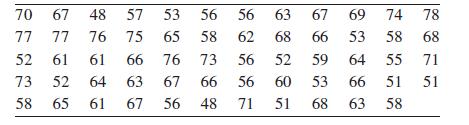
The following table presents the daily high temperatures for the city of Macon, Georgia, in degrees Fahrenheit, for the winter months of January and February, 2013.a. Construct a stem-and-leaf plot, using the digits 4, 5, 6, and 7 as the stems.b. Repeat part (a), but split the stems, using two
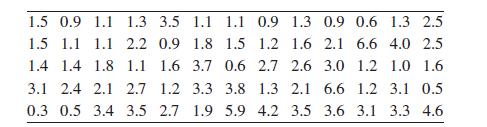
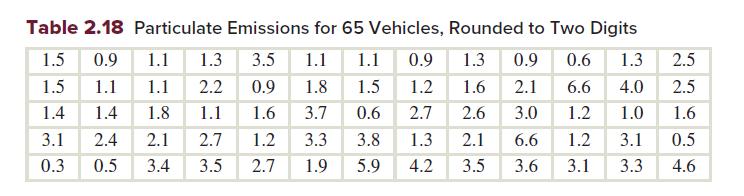
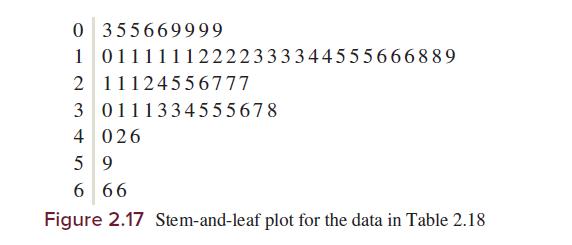
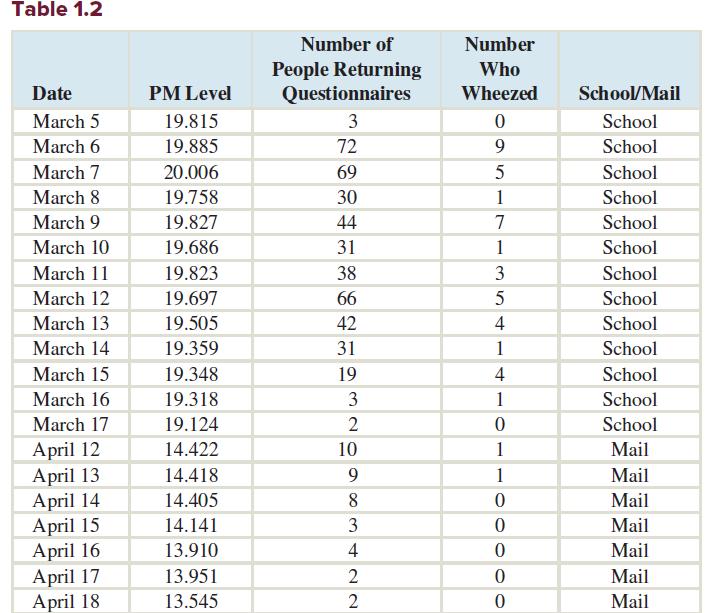
The following table presents amounts of particulate emissions for 65 vehicles. These data also appear in Table 2.18.a. Construct a split stem-and-leaf plot in which each stem appears twice, once for leaves 0–4 and again for leaves 5–9.b. Compare the split stem-and-leaf plot to the plot in
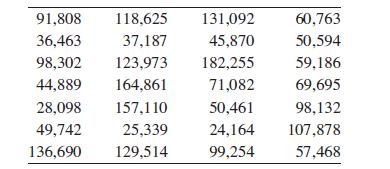
The following table presents the annual salaries for the employees of a small technology firm. Round each number to the nearest thousand, and then construct a stem-and-leaf plot. 91,808 118,625 131,092 60,763 36,463 37,187 45,870 50,594 98,302 123,973 182,255 59,186 44,889 164,861 71,082 69,695
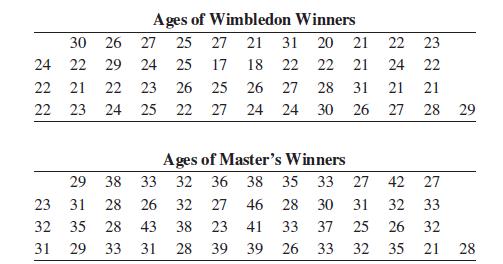
Following are the ages of the winners of the men’s Wimbledon tennis championship and the Master’s golf championship for the years 1969 through 2016.a. Construct back-to-back split stem-and-leaf plots for these data sets.b. How do the ages of Wimbledon champions differ from the ages of
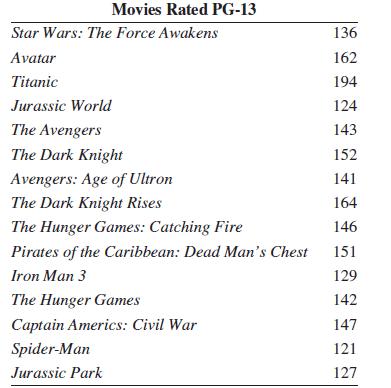
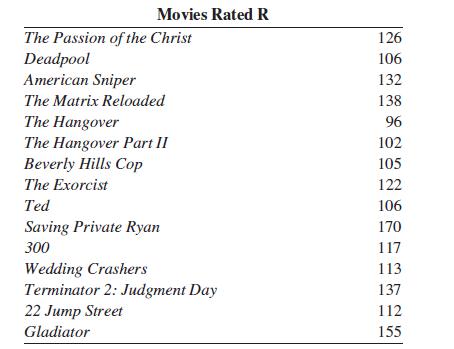
Following are the running times (in minutes)for the top 15 grossing movies of all time rated PG-13, and the top 15 grossing movies of all time rated R.a. Construct back-to-back stem-and-leaf plots for these data sets.b. Do the running times of R-rated movies differ greatly from the running times of
Construct a dotplot for the data in Exercise 18.Are there any gaps in the data?Exercise 18Following are the ages of the winners of the men’s Wimbledon tennis championship and the Master’s golf championship for the years 1969 through 2016. Ages of Wimbledon Winners 30 26 27 25 27 21 31 20 21 22
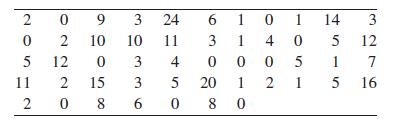
Following are the numbers of hospitals in each of the 50 U.S. states plus the District of Columbia that won Patient Safety Excellence Awards. Construct a dotplot for these data and describe its shape. 20 0 9 3 24 6101 14 3 5 11 222 10 10 11 3 1 4 0 5 12 0 3 4 000 5 1 7 15 3 208 5 20 1 215 6080 16
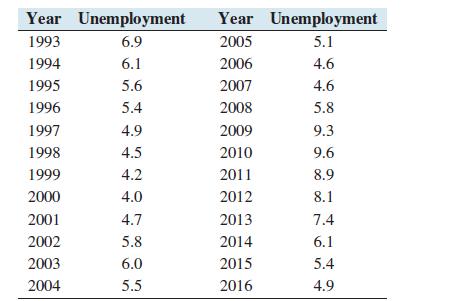
The following table presents the U.S. unemployment rate for each of the years 1993 through 2016.a. Construct a time-series plot of the unemployment rate.b. For which periods of time was the unemployment rate increasing? For which periods was it decreasing? Year Unemployment Year Unemployment 1993
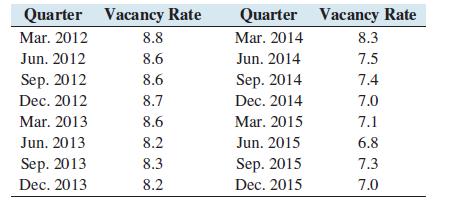
The following table presents the percentage of U.S. residential rental units that were vacant during each quarter from 2012 through 2015.a. Construct a time-series plot for these data.b. From 2012 through 2015, the proportion of Americans who owned a home declined. What was the trend in the vacancy
The following table presents the amount spent, in billions of dollars, on national defense by the U.S.government every other year for the years 1951 through 2017.The amounts are adjusted for inflation, and represent 2017 dollars.a. Construct a time-series plot for these data.b. The plot covers
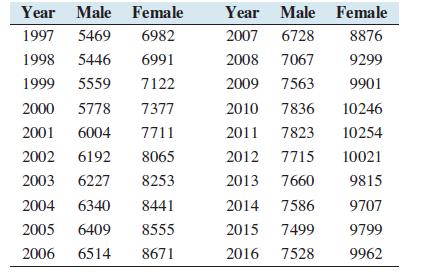
The following table presents the numbers of male and female students (in thousands) enrolled in college in the United States as undergraduates for each of the years 1997 through 2016.a. Construct a time-series plot for the male enrollment; then on the same axes, construct a time-series plot for the
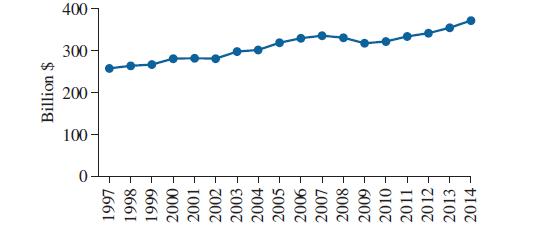
The following time-series plot presents the amount spent, in billions of dollars, on dining out by U.S. residents for the years 1997–2014.a. Estimate the amount spent on dining out in 2003.b. Was the amount spent in 2005 greater than, less than, or about the same as the amount spent in 2009?c.
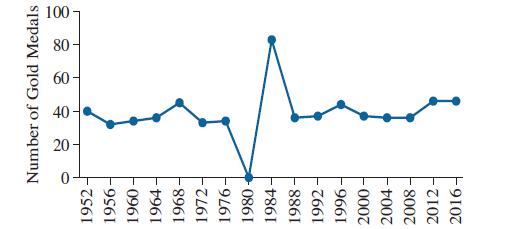
The following time-series plot presents the number of Summer Olympic events in which the United States won a gold medal in each Olympic year from 1952 through 2016.a. In one year, the United States did not participate in Summer games that were held in Moscow, in protest of the invasion of
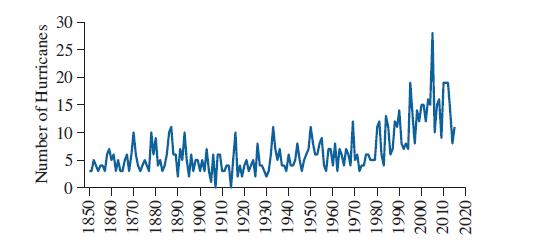
The following time series plot presents the number of hurricanes originating in the Atlantic Ocean for each year from 1850 through 2015.a. Estimate the largest number of hurricanes to occur in a year.b. Was the first year in which 15 or more hurricanes occurred closest to 1970, 1980, or 1990?c.
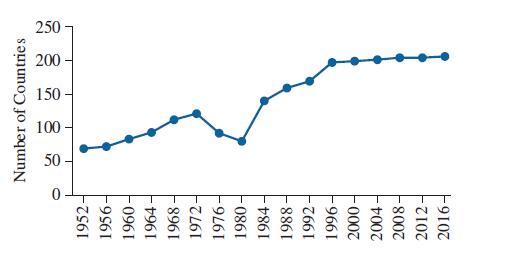
The following time series plot presents the number of countries participating in the Summer Olympic games in each Olympic year from 1952 through 2016.Refer to Exercise 30.Someone says “Although the number of gold medals won by the United States didn’t change much from 1952 to 1972, the
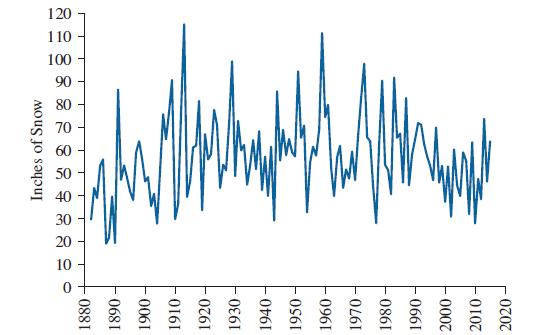
The following time-series plot presents the number of inches of snow falling in Denver each year from 1882 through 2016.a. Estimate the largest annual snowfall ever recorded in Denver.b. Was the year of the largest annual snowfall closest to 1900, 1910, or 1920?c. Was the amount of snowfall in the
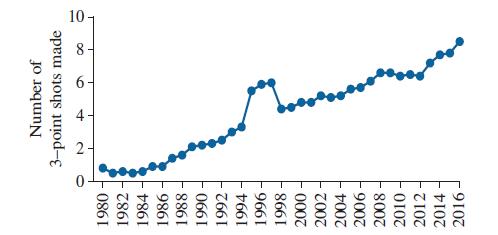
The following time-series plot presents the average number of three-point shots made in a National Basketball Association game for seasons ending in 1980 through 2016.a. In 1997 the average number of three-point shots per game was greater than 6 for the first time. What was the next year that it
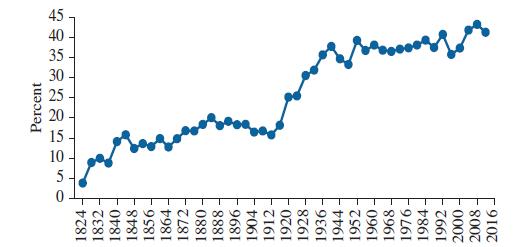
The following time-series plot presents the percentage of the total U.S. population that voted in each presidential election since 1824.a. In 1824, the only people eligible to vote were white men who owned property. Approximately what percentage of the total population voted in 1824?b. In 1828,
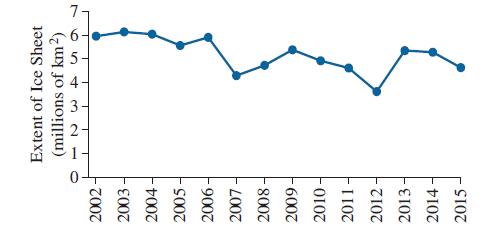
The following table presents the extent of ice coverage (in millions of square kilometers) in the Arctic region in September of each year from 2002 through 2015.a. What was the first year that the coverage dropped below 5 million square kilometers?b. What was the first year that the coverage
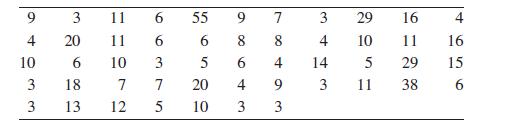
In U.S. presidential elections, each of the 50 states casts a number of electoral votes equal to its number of senators (2) plus its number of members of the House of Representatives.In addition, the District of Columbia casts three electoral votes.Following are the numbers of electoral votes cast
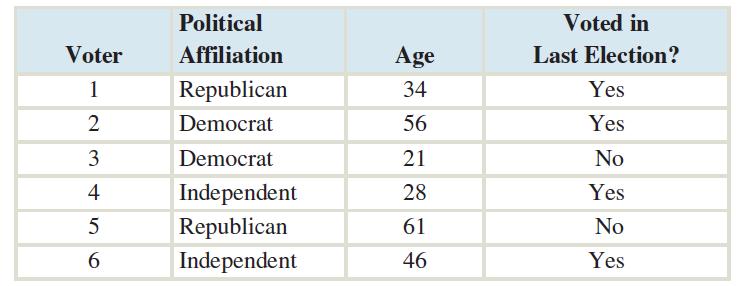
A pollster asks a group of six voters about their political affiliation (Republican, Democrat, or Independent), their age, and whether they voted in the last election. The results are shown in the following table.a. How many individuals are there?b. Identify the variables.c. What are the data for
The number of touchdowns in a football game. In Exercises 15–24, determine whether the data described are qualitative or quantitative.
According to Time magazine, some of the best graphic novels of all time are:Watchmen by Alan Moore and Dave Gibbons Sandman by Neil Gaiman Jimmy Corrigan, the Smartest Kid on Earth by Chris Ware Maus by Art Spiegelman The Adventures of Tintin: The Black Island by Herg´e Miracleman: The Golden Age
To study the effect of air pollution on respiratory health, a group of people in a city with high levels of air pollution and another group in a rural area with low levels of pollution are examined to determine their lung capacity. Is this a randomized experiment or an observational study?
To determine the effectiveness of a new pain reliever, a randomly chosen group of pain sufferers is assigned to take the new drug, and another randomly chosen group is assigned to take a placebo.a. Is this a randomized experiment or an observational study?b. The subjects taking the new drug
Eighty thousand people attending a professional football game filled out surveys asking their opinions on using tax money to upgrade the football stadium. Seventy percent said that they supported the use of tax money. Then a pollster surveyed a simple random sample of 500 voters, and only 30% of
To estimate the prevalence of illegal drug use in a certain high school, the principal interviewed a simple random sample of 100 students and asked them about their drug use. Five percent of the students acknowledged using illegal drugs.In Exercises 9–16, specify the type of bias involved.
In a survey conducted by representatives of the nuclear power industry, people were asked the question: ‘‘Do you favor the construction of nuclear power plants in order to reduce our dependence on foreign oil?’’A group opposed to the use of nuclear power conducted a survey with the
Is the number of points scored in a football game qualitative or quantitative?
Air pollution is a serious problem in many places. One form of air pollution that is suspected to cause respiratory illness is particulate matter (PM), which consists of tiny particles in the air. Particulate matter can come from many sources, most commonly ash from burning, but also from other
One reason that voluntary response sampling is unreliable is that people with stronger views tend to express them more readily.In Exercises 13–16, determine whether the statement is true or false. If the statement is false, rewrite it as a true statement.
In a recent poll, 57% of the respondents supported a school bond issue.In Exercises 17–20, determine whether the number described is a statistic or a parameter.
A pollster wants to estimate the proportion of voters in a certain town who are Democrats. He goes to a large shopping mall and approaches people to ask whether they are Democrats. Is this a simple random sample? Explain.
Provide an example of a qualitative variable and an example of a quantitative variable.
Which are qualitative and which are quantitative?a. The number of patients admitted to a hospital on a given dayb. The model of car last sold by a particular car dealerc. The name of your favorite songd. The seating capacity of an auditorium
Is the color of a smartphone nominal or ordinal?
It is known that drinking alcohol increases the risk of contracting liver cancer.Assume that in an observational study, a group of smokers has a higher rate of liver cancer than a group of nonsmokers. Explain how this result might be due to confounding.
A polling organization placed telephone calls to 1000 people in a certain city to ask them whether they favor a tax increase to build a new school. Two hundred people answered the phone, and 150 of them opposed the tax. Can you conclude that a majority of people in the city oppose the tax, or is it
A telephone company wants to estimate the proportion of customers who are satisfied with their service. They use a computer to generate a list of random phone numbers and call those people to ask them whether they are satisfied. Is this a simple random sample? Explain.
Is the name of your favorite author a qualitative variable or a quantitative variable?
Which are nominal and which are ordinal?a. The names of the streets in a townb. The movie ratings G, PG, PG-13, R, and NC-17c. The winners of the gold, silver, and bronze medals in an Olympic swimming competition
Is the area of a college campus discrete or continuous?
Describe circumstances under which each of the following samples could be used: simple random sample, a sample of convenience, a stratified sample, a cluster sample, a systematic sample.
In a study conducted at the University of Southern California, J. Peters and colleagues studied elementary school students in 12 California communities. Each year for 10 years, they measured the respiratory function of the children and the levels of air pollution in the communities.a. Was this a
_______________are highly unreliable in part because people who have strong opinions are more likely to participate.In Exercises 3–5, fill in each blank with the appropriate word or phrase.
A radio talk show host invites listeners to send an email to express their opinions on an upcoming election. More than 10,000 emails are received. What kind of sample is this?
True or false: Nominal variables do not have a natural ordering.
Which are discrete and which are continuous?a. The number of female members of the U.S. House of Representativesb. The amount of water used by a household during a given monthc. The number of stories in an apartment buildingd. A person’s body temperature
A theater concession stand sells soft drink and popcorn combos that come in sizes small, medium, large, and jumbo. True or false:a. Size is a qualitative variable.b. Size is an ordinal variable.c. Size is a continuous variable.
Suppose that you were asked to collect some information about students in your class for a statistics project. Give some examples of variables you might collect that are ordinal, nominal, discrete, and continuous.
In a study conducted at the University of Colorado, J. Ruttenber and colleagues studied people who had worked at the Rocky Flats nuclear weapons production facility near Denver, Colorado. They studied a group of workers who had contracted lung cancer, and another group who had not contracted lung
People who are asked to participate in a study but refuse to do so are called _______________.In Exercises 3–5, fill in each blank with the appropriate word or phrase.
Every 10 years, the U.S. Census Bureau attempts to count every person living in the United States. To check the accuracy of their count in a certain city, they draw a sample of census districts (roughly equivalent to a city block) and recount everyone in the sampled districts. What kind of sample
_____________________ variables are quantitative variables that can take on any value in some interval.
The characteristics of individuals about which we collect information are called_____________.In Exercises 5–10, fill in each blank with the appropriate word or phrase.
A popular website is interested in conducting a survey of 400 visitors to the site in such a way that 200 of them will be under age 30, 150 will be aged 30–55, and 50 will be over 55.In Exercises 5–8, identify the kind of sample that is described.
Quantitative variables are numerical. Are some qualitative variables numerical as well? If not, explain why not.If so, provide an example.
In________________ a experiment, subjects do not decide for themselves which treatment they will get.In Exercises 5–10, fill in each blank with the appropriate word or phrase.
A large sample is useful only if it is drawn by a method that is likely to represent the_______________ well.In Exercises 3–5, fill in each blank with the appropriate word or phrase.
A public health researcher is designing a study of the effect of diet on heart disease.The researcher knows that the diets of men and women tend to differ, and that men are more susceptible to heart disease. To be sure that both men and women are well represented, the study comprises a simple
True or false: Ideally, a sample should represent the population as little as possible.
Variables that classify individuals into categories are called _____________.In Exercises 5–10, fill in each blank with the appropriate word or phrase.
Viewers of a television show are asked to vote for their favorite performer by sending a text message to the show.In Exercises 5–8, identify the kind of sample that is described.
In________________ a study, neither the investigators nor the subjects know who is getting which treatment.In Exercises 5–10, fill in each blank with the appropriate word or phrase.
The way that a question in a survey is worded rarely has an effect on the responses.In Exercises 6–8, determine whether the statement is true or false. If the statement is false, rewrite it as a true statement.
A college basketball team held a promotion at one of its games in which every twentieth person who entered the arena won a free basketball. What kind of sample do the winners represent?
A utility company sends surveys to 200 of its customers in such a way that 100 surveys are sent to customers who pay their bills on time, 50 surveys are sent to customers whose bills are less than 30 days late, and 50 surveys are sent to customers whose bills are more than 30 days late. Which type
________________ variables are always numerical.In Exercises 5–10, fill in each blank with the appropriate word or phrase.
A researcher selects 4 of 12 high schools in a certain region and surveys all of the administrative staff members in each school about a potential change in the ordering of supplies. Which type of sample does this represent?In Exercises 5–8, identify the kind of sample that is described.
What are the advantages of a double-blind study? Are there any disadvantages?
A study in which the assignment to treatment groups is not made by the investigator is called _________________.In Exercises 5–10, fill in each blank with the appropriate word or phrase.
Surveys with many nonresponders often provide misleading results.In Exercises 6–8, determine whether the statement is true or false. If the statement is false, rewrite it as a true statement.
The entire collection of individuals about which information is sought is called a _______.In Exercises 7–12, fill in each blank with the appropriate word or phrase.
A sample of convenience is when it is _____________________ reasonable to believe that there is no systematic difference between the sample and the population. (Choices: acceptable, not acceptable)
Qualitative variables can be divided into two types: and __________________.In Exercises 5–10, fill in each blank with the appropriate word or phrase.
A pollster obtains a list of registered voters and uses a computer random number generator to choose 100 of them to ask which candidate they prefer in an upcoming election.In Exercises 5–8, identify the kind of sample that is described.
A_________________ is a variable related to both the treatment and the outcome.In Exercises 5–10, fill in each blank with the appropriate word or phrase.
Large samples usually give reasonably accurate results, no matter how they are drawn.In Exercises 6–8, determine whether the statement is true or false. If the statement is false, rewrite it as a true statement.
A _______ is a subset of a population.In Exercises 7–12, fill in each blank with the appropriate word or phrase.
The manager of a restaurant walks around and asks selected customers about the service they have received. Which type of sample does this represent?
A ___________________ variable is a quantitative variable whose possible values can be listed.In Exercises 5–10, fill in each blank with the appropriate word or phrase.
Researchers examine the association between the fluoridation of water and the prevention of tooth decay by comparing the prevalence of tooth decay in countries that have fluoridated water with the prevalence in countries that do not.a. Is this a randomized experiment or an observational study?b.
In a _________________study, the subjects are followed over time.In Exercises 5–10, fill in each blank with the appropriate word or phrase.
A bank sent out questionnaires to a simple random sample of 500 customers asking whether they would like the bank to extend its hours. Eighty percent of those returning the questionnaire said they would like the bank to extend its hours.Of the 500 questionnaires, 20 were returned.In Exercises
A _______ is a type of sample that is analogous to a lottery.In Exercises 7–12, fill in each blank with the appropriate word or phrase.
True or false: An experiment where neither the investigators nor the subjects know who has been assigned to which treatment is called a double-blind experiment.
_______________variables can take on any value in some interval.In Exercises 5–10, fill in each blank with the appropriate word or phrase.
A taxi company in a large city put a new type of tire with a special tread on a random sample of 50 cars, and the regular type of tire on another random sample of 50 cars. After a month, the gas mileage of each car was measured.a. Is this a randomized experiment or an observational study?b. Assume
Showing 7300 - 7400
of 7930
First
66
67
68
69
70
71
72
73
74
75
76
77
78
79
80
Step by Step Answers