New Semester
Started
Get
50% OFF
Study Help!
--h --m --s
Claim Now
Question Answers
Textbooks
Find textbooks, questions and answers
Oops, something went wrong!
Change your search query and then try again
S
Books
FREE
Study Help
Expert Questions
Accounting
General Management
Mathematics
Finance
Organizational Behaviour
Law
Physics
Operating System
Management Leadership
Sociology
Programming
Marketing
Database
Computer Network
Economics
Textbooks Solutions
Accounting
Managerial Accounting
Management Leadership
Cost Accounting
Statistics
Business Law
Corporate Finance
Finance
Economics
Auditing
Tutors
Online Tutors
Find a Tutor
Hire a Tutor
Become a Tutor
AI Tutor
AI Study Planner
NEW
Sell Books
Search
Search
Sign In
Register
study help
business
elementary statistics
Elementary Statistics 3rd Edition William Navidi, Barry Monk - Solutions
The Health Resources and Services Administration reported that 5% of people who received kidney transplants were under the age of 18.How large a sample of kidney transplant patients needs to be drawn so that the sample proportion p̂ of those under the age of 18 is approximately normally
The General Social Survey reported that 91% of people who bought a car in the past five years were satisfied with their purchase. How large a sample of car buyers needs to be drawn so that the sample proportion p̂ who are satisfied is approximately normally distributed?
There are two hospitals in a town. Hospital A has 200 births per month, and Hospital B has 50.a. At which hospital is it more likely that 55% or more of the births will be boys?b. At which hospital is it more likely the percentage of boys will be between 45% and 55%?
There are two elementary schools in a town.School A has 500 students, and school B has 1000 students.a. At which school is it more likely that 55% or more of the students will be girls?b. At which school is it more likely the percentage of girls will be between 45% and 55%?
A new process has been designed to make ceramic tiles. The goal is to have no more than 5% of the tiles be nonconforming due to surface defects. A random sample of 1000 tiles is inspected. Let p̂ be the proportion of nonconforming tiles in the sample.a. If 5% of the tiles produced are
X is a binomial random variable with n = 50 and p = 0.15. Should the normal approximation be used to find P(X > 10)? Why or why not?
X is a binomial random variable with n = 72 and p = 0.90. Should the normal approximation be used to find P(X ≤ 60)? Why or why not?
Let X have a binomial distribution with n = 64 and p = 0.41. If appropriate, use the normal approximation to find P(X ≤ 20). If not, explain why not.
Let X have a binomial distribution with n = 379 and p = 0.09. If appropriate, use the normal approximation to find P(X > 40). If not, explain why not.
If X is a binomial random variable and if np ≥ 10 and n(1 − p) ≥ 10, then X is approximately normal withμX = ____________________ and σX = ___________________ .In Exercises 5 and 6, fill in each blank with the appropriate word or phrase.
The adjustment made when approximating a discrete random distribution with a continuous one is called the __________________ correction.In Exercises 5 and 6, fill in each blank with the appropriate word or phrase.
If technology is to be used, exact binomial probabilities can be calculated and the normal approximation is not necessary.In Exercises 7 and 8, determine whether the statement is true or false. If the statement is false, rewrite it as a true statement.
If X is a binomial random variable with n trials and success probability p, then as n gets larger, the distribution of X becomes more skewed.In Exercises 7 and 8, determine whether the statement is true or false. If the statement is false, rewrite it as a true statement.
n = 78, p = 0.43; P(X > 40)In Exercises 9–14, n is the sample size, p is the population proportion of successes, and X is the number of successes in the sample. Use the normal approximation to find the indicated probability.
n = 538, p = 0.86; P(X ≤ 470)In Exercises 9–14, n is the sample size, p is the population proportion of successes, and X is the number of successes in the sample. Use the normal approximation to find the indicated probability.
n = 99, p = 0.57; P(X ≥ 55)In Exercises 9–14, n is the sample size, p is the population proportion of successes, and X is the number of successes in the sample. Use the normal approximation to find the indicated probability.
n = 442, p = 0.54; P(X < 243)In Exercises 9–14, n is the sample size, p is the population proportion of successes, and X is the number of successes in the sample. Use the normal approximation to find the indicated probability.
n = 106, p = 0.14; P(14 < X < 18)In Exercises 9–14, n is the sample size, p is the population proportion of successes, and X is the number of successes in the sample. Use the normal approximation to find the indicated probability.
n = 61, p = 0.34; P(20 ≤ X ≤ 24)In Exercises 9–14, n is the sample size, p is the population proportion of successes, and X is the number of successes in the sample. Use the normal approximation to find the indicated probability.
According to a report of the Nielsen Company, 76% of Internet searches in November 2016 used the Google search engine. A sample of 100 searches is studied.a. Approximate the probability that more than 70 of the searches used Google.b. Approximate the probability that 75 or fewer of the searches
The Centers for Disease Control and Prevention reports that 25% of baby boys 6–8 months old in the United States weigh more than 20 pounds. A sample of 150 babies is studied.a. Approximate the probability that more than 40 weigh more than 20 pounds.b. Approximate the probability that 35 or fewer
The National Health and Nutrition Examination Survey reported that 30% of adults in the United States have hypertension (high blood pressure). A sample of 300 adults is studied.a. Approximate the probability that 85 or more have hypertension.b. Approximate the probability that fewer than 80 have
In a poll conducted by the General Social Survey, 81% of respondents said that their jobs were sometimes or always stressful. Two hundred workers are chosen at random.a. Approximate the probability that 160 or fewer find their jobs stressful.b. Approximate the probability that more than 150 find
A pollster will interview a sample of 200 voters to ask whether they support a proposal to increase the sales tax to build a new light rail system. Assume that in fact 55% of the voters support the proposal.a. Approximate the probability that 100 or fewer of the sampled voters support the
A gardener buys a package of seeds. Eighty percent of seeds of this type germinate. The gardener plants 90 seeds.a. Approximate the probability that fewer than 75 seeds germinate.b. Approximate the probability that 80 or more seeds germinate.c. Approximate the probability that the number of seeds
Among automobiles of a certain make, 23% require service during a one-year warranty period. A dealer sells 87 of these vehicles.a. Approximate the probability that 25 or fewer of these vehicles require repairs.b. Approximate the probability that more than 17 vehicles require repairs.c. Approximate
Pea plants contain two genes for seed color, each of which may be Y (for yellow seeds) or G (for green seeds).Plants that contain one of each type of gene are called heterozygous. According to the Mendelian theory of genetics, if two heterozygous plants are crossed, each of their offspring will
Airlines often sell more tickets for a flight than there are seats, because some ticket holders don’t show up for the flight. Assume that an airplane has 100 seats for passengers and that the probability that a person holding a ticket appears for the flight is 0.90. If the airline sells 105
A small college has enough space to enroll 300 new students in its incoming freshman class. From past experience, the admissions office knows that 65% of students who are accepted actually enroll. If the admissions office accepts 450 students, what is the probability that there will be enough space
A fair coin is tossed 100 times. Use the normal approximation to approximate the probability that the coin comes up heads exactly 50 times.
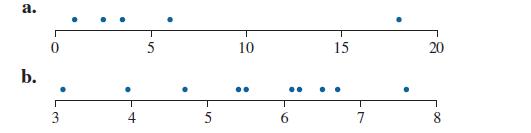
For each of the following dotplots, determine whether it is reasonable to treat the sample as coming from an approximately normal population. a. b. . 3 5 10 15 20 + 5 6 7 8
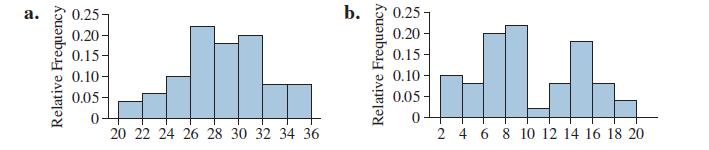
For each of the following histograms, determine whether it is reasonable to treat the sample as coming from an approximately normal population. a. Relative Frequency 0.25- 0.20- 0.15- 0.10- 0.05- 0 20 22 24 26 28 30 32 34 36 b. Relative Frequency 0.25 0.20 0.15- 0.10- 0.05 0 h 2 4 6 8 10 12 14 16
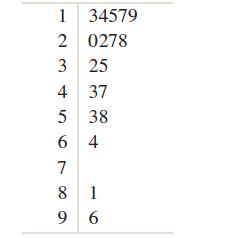
The following stem-and-leaf plot represents a sample from a population. Is it reasonable to assume that this population is approximately normal? 1 34579 2 0278 3 25 4 37 5 38 64 7 8 1 96
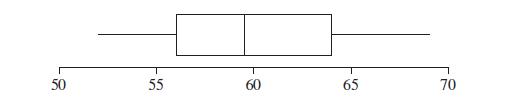
The following boxplot represents a sample from a population. Is it reasonable to assume that this population is approximately normal? 50 50 55 60 00 55 65 70 10
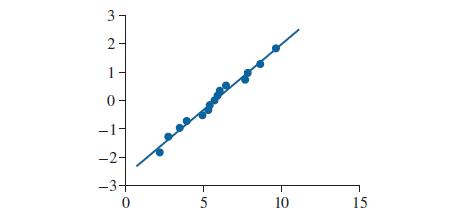
Is it reasonable to treat the sample in the following normal quantile plot as coming from an approximately normal population? Explain. 3 2- 1- 0 -1- -2- -3- 0 5 10 15
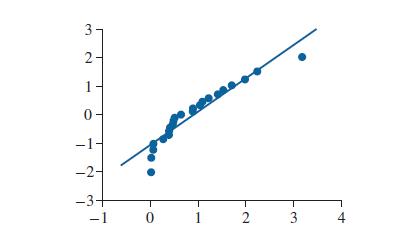
Is it reasonable to treat the sample in the following normal quantile plot as coming from an approximately normal population? Explain. -2- 2 1 0 3 -1 0 1 2 3 4
A population is rejected as being approximately normal if the sample contains an _______________ , if the sample contains a large degree of _______________ , or if the sample has more than one distinct _________________.In Exercise 7, fill in each blank with the appropriate word or phrase.
If the points in a normal quantile plot deviate from a straight line, then the population can be treated as approximately normal.In Exercise 8, determine whether the statement is true or false.If the statement is false, rewrite it as a true statement.
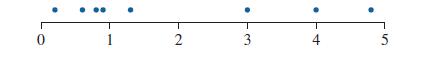
The following dotplot illustrates a sample. Is it reasonable to treat this as a sample from an approximately normal population? Explain. 0 2 3 4 5
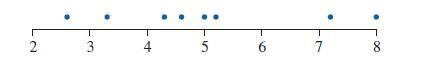
The following dotplot illustrates a sample. Is it reasonable to treat this as a sample from an approximately normal population? Explain. 2 3 4 5 6 7 8
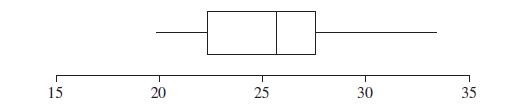
The following boxplot illustrates a sample. Is it reasonable to treat this as a sample from an approximately normal population? Explain. 15 20 25 30 35
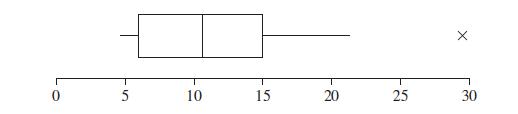
The following boxplot illustrates a sample. Is it reasonable to treat this as a sample from an approximately normal population? Explain. 5 10 15 20 25 30
The following histogram illustrates a sample. Is it reasonable to treat this as a sample from an approximately normal population? Explain. Relative Frequency 0.35 0.30 0.25 0.20 0.15 0.10 0.05 0 6 7 89 9 10 11 12 13 14
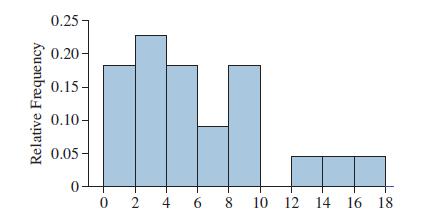
The following histogram illustrates a sample. Is it reasonable to treat this as a sample from an approximately normal population? Explain. Relative Frequency 0.25 0.20 0.15- 0.10- 0.05 0 02 4 6 8 10 12 14 16 18
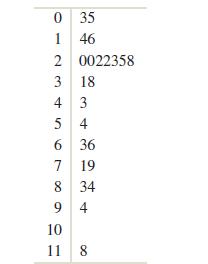
The following stem-and-leaf plot illustrates a sample. Is it reasonable to treat this as a sample from an approximately normal population? Explain. 0 35 1 46 2 0022358 3 18 4 3 54 6 36 7 19 8 34 94 10 11 8
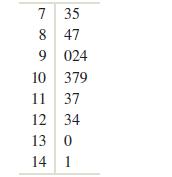
The following stem-and-leaf plot illustrates a sample. Is it reasonable to treat this as a sample from an approximately normal population? Explain. 789 35 8 47 9 024 10 379 11 37 12 34 13 0 14 1
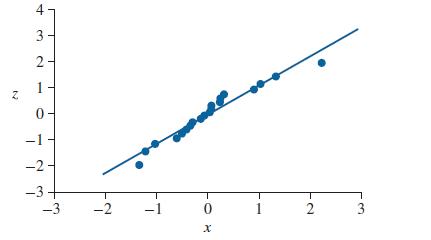
The following normal quantile plot illustrates a sample. Is it reasonable to treat this as a sample from an approximately normal population? Explain. 2 2 1 0 4 3 -1 -2 -3 -2 -1 0 1 2 3 x
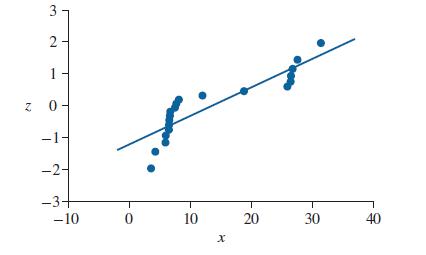
The following normal quantile plot illustrates a sample. Is it reasonable to treat this as a sample from an approximately normal population? Explain. 3 2 1 Z 0- -1- -2- -3+ -10 0 10 x 20 30 40
A sample of 10 people ingested a new formulation of a drug. Six hours later, the concentrations in their bloodstreams, in nanograms per milliliter, were as follows.Construct a dotplot for this sample. Is it reasonable to treat the sample as coming from an approximately normal population?Explain.
A random sample of eight elementary school children were given a standardized reading test. Following are their scores.Construct a dotplot for this sample. Is it reasonable to treat the sample as coming from an approximately normal population?Explain. 72 77 65 85 68 83 73 79
The number of minutes needed to complete a certain spreadsheet task was measured for 20 clerical workers.The results were as follows.Construct a boxplot for this sample. Is it reasonable to treat the sample as coming from an approximately normal population?Explain. 4.5 5.8 3.7 4.9 4.3 4.7 5.8 3.2
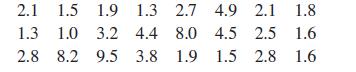
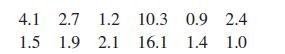
A manufacturer of aluminum cans measured the level of impurities in 24 cans. The amounts of impurities, in percent, were as follows.Construct a boxplot for this sample. Is it reasonable to treat the sample as coming from an approximately normal population?Explain. 2.1 1.5 1.9 1.3 2.7 4.9 2.1 1.8
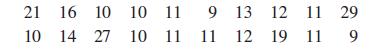
The number of defective items produced on an assembly line during an hour is counted for a random sample of 20 hours. The results are as follows.Construct a stem-and-leaf plot for this sample. Is it reasonable to treat the sample as coming from an approximately normal population? Explain. 21 16 10
A fish hatchery raises trout to stock streams and lakes. The weights, in ounces, of a sample of 18 trout at their time of release are as follows.Construct a stem-and-leaf plot for this sample. Is it reasonable to treat the sample as coming from an approximately normal population? Explain. 9.9 11.3
Construct a histogram for the data in Exercise 21.Explain how the histogram shows whether it is appropriate to treat this sample as coming from an approximately normal population. Exercise 21The number of minutes needed to complete a certain spreadsheet task was measured for 20 clerical workers.The
Construct a histogram for the data in Exercise 22.Explain how the histogram shows whether it is appropriate to treat this sample as coming from an approximately normal population.Exercise 22A manufacturer of aluminum cans measured the level of impurities in 24 cans. The amounts of impurities, in
Construct a normal quantile plot for the data in Exercise 23.Explain how the plot shows whether it is appropriate to treat this sample as coming from an approximately normal population.Exercise 23The number of defective items produced on an assembly line during an hour is counted for a random
Construct a normal quantile plot for the data in Exercise 24.Explain how the plot shows whether it is appropriate to treat this sample as coming from an approximately normal population.Exercise 24A fish hatchery raises trout to stock streams and lakes. The weights, in ounces, of a sample of 18
Consider the following data set:a. Show that this data set does not come from an approximately normal population.b. Take the square root of each value in the data set. This is called a square-root transformation of the data. Show that the square roots may be considered to be a sample from an
Consider the following data set:a. Show that this data set does not come from an approximately normal population.b. Take the reciprocal of each value in the data set (the reciprocal of x is 1∕x). This is called a reciprocal transformation of the data. Show that the reciprocals may be considered
Consider the following data set:a. Is it reasonable to treat it as a sample from an approximately normal population?b. Perform a square-root transformation. Is it reasonable to treat the square-root-transformed data as a sample from an approximately normal population?c. Perform a reciprocal
Consider the following data set:a. Is it reasonable to treat it as a sample from an approximately normal population?b. Perform a square-root transformation. Is it reasonable to treat the square-root-transformed data as a sample from an approximately normal population?c. Perform a reciprocal
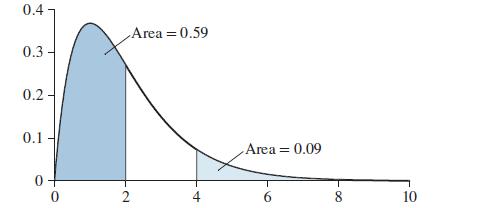
Following is a probability density curve for a population.a. What proportion of the population is between 2 and 4?b. If a value is chosen at random from this population, what is the probability that it will be greater than 2? 0.4 0.3 Area = 0.59 0.2 0.1 Area = 0.09 0 0 2 4 6 8 10
Find the area under the standard normal curvea. To the left of z = 1.77b. To the right of z = 0.41c. Between z = −2.12 and z = 1.37
Find the z-score that hasa. An area of 0.33 to its leftb. An area of 0.79 to its right
Find z0.15.
The running time for videos submitted to YouTube in a given week is normally distributed with μ = 390 seconds and standard deviation σ = 148 seconds.a. If a single video is randomly selected, what is the probability that the running time of the video exceeds 6 minutes(360 seconds)?b. Suppose that
On a certain television channel, 18% of commercials are local advertisers. A sample of 120 commercials is selected.a. What is the probability that more than 20% of the commercials in the sample are local advertisers?b. Would it be unusual for more than 25% of the commercials to be local advertisers?
Let X have a binomial distribution with n = 240 and p = 0.38. Use the normal approximation to find:a. P(X > 83)b. P(75 ≤ X ≤ 95)c. P(X < 96)
Is it reasonable to treat the following sample as coming from an approximately normal population? Explain.5.5 8.7 9.3 10.1 15.2 3.5 11.9 7.6 13.7 8.7 14.3 5.8
Explain why P(a < X
Describe the information you must know to compute the area under the normal curve over a given interval.
Describe the information you must know to find the value corresponding to a given proportion of the area under a normal curve.
Suppose that in a large class, the instructor announces that the average grade on an exam is 75.Which is more likely to be closer to 75:i. The exam grade of a randomly selected student in the class?ii. The mean exam grade of a sample of 10 students?Explain.
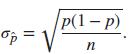
Consider the formula for the standard deviation of the sampling distribution of ̂p given byWhat happens to the standard deviation as n gets larger and larger? Explain what this means in terms of the spread of the sampling distribution. p(1 - p) n
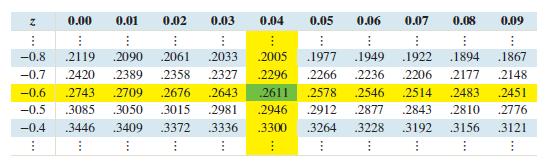
Use Table A.2 to find the area to the right of z = 2.31. Z 0.00 0.01 0.02 0.03 0.04 0.05 0.06 0.07 0.08 0.09 -0.8 -0.7 .2119 .2090 .2420 2389 -0.6 .2743 .2061 .2033 2358 .2327 .2709 .2676 .2643 .2611 -0.5 .3085 .3050 .3015 .2981 .2946 .2005 1977 .2296 .2266 .2578 .2912 .1949 .1922 .1894 .1867 .2236
Use any method to find the z-score with an area of 0.09 to its right.
If X is a continuous random variable, then P(X = a) = ___________________ for any number a.In Exercises 9–14, fill in each blank with the appropriate word or phrase.
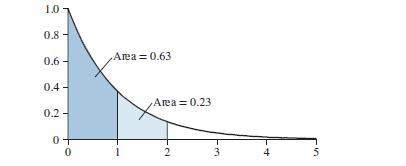
Following is a probability density curve with the area between 0 and 1 and the area between 1 and 2 indicated.a. What proportion of the population is between 0 and 1?b. What is the probability that a randomly selected value will be between 1 and 2?c. What proportion of the population is between 0
λ = 2, t = 4, P(More than 9)In Exercises 9–18, determine the indicated probability for a Poisson random variable with the given values of λ and t.
Use Table A.2 to find the area to the left of z = 0.25. Z 0.00 0.01 0.02 0.03 0.04 0.05 0.06 0.07 0.08 0.09 -0.8 -0.7 .2119 .2090 .2420 2389 -0.6 .2743 .2709 .2676 .2061 .2033 2358 .2327 .2643 .2005 1977 .2296 .2266 .1949 .1922 .1894 .1867 .2236 .2206 .2177 .2148 -0.5 .3085 .3050 .3015 .2981 -0.4
Use Table A.2 to find the area between z = −1.13 and z = 2.02. Z 0.00 0.01 0.02 0.03 0.04 0.05 0.06 0.07 0.08 0.09 -0.8 -0.7 .2119 .2090 .2420 2389 -0.6 .2743 .2709 .2676 .2061 .2033 2358 .2327 .2643 .2005 1977 .2296 .2266 .1949 .1922 .2236 .2206 .1894 .1867 .2177 .2148 -0.5 .3085 .3050 .3015
Use Table A.2 to find the z-score with an area of 0.45 to its left. N 0.00 0.01 0.02 0.03 0.04 0.05 0.06 0.07 0.08 0.09 -0.6 .2743 .2709 .2676 .2643 .2611 .2578 .2546 .2514 .2483 .2451 -0.5 .3085 .3050 .3015 -0.4 .3446 .3409 .3372 .3336 .3300 .2981 .2946 .2912 .2877 .2843 .2810 .2776 .3264 .3228
Use Table A.2 to find the z-score with an area of 0.37 to its right. N 0.00 0.01 0.02 0.03 0.04 0.05 0.06 0.07 0.08 0.09 -0.6 .2743 .2709 .2676 .2643 .2611 .2578 .2546 .2514 .2483 .2451 -0.5 .3085 .3050 .3015 -0.4 .3446 .3409 .3372 .3336 .3300 .2981 .2946 .2912 .2877 .2843 .2810 .2776 .3264 .3228
Use any method to find the z-score with an area of 0.74 to its left.
The proportion of a population that is contained within an interval corresponds to an area under the probability ___________________ curve.In Exercises 9–14, fill in each blank with the appropriate word or phrase.
The area under the entire probability density curve is equal to ______________.In Exercises 9–14, fill in each blank with the appropriate word or phrase.
The mean, median, and mode of a normal distribution are __________________ to each other.In Exercises 9–14, fill in each blank with the appropriate word or phrase.
A normal distribution with mean 0 and standard deviation 1 is called the ____________________ normal distribution.In Exercises 9–14, fill in each blank with the appropriate word or phrase.
Points on the horizontal axis to the left of the mode have ________________ z-scores.In Exercises 9–14, fill in each blank with the appropriate word or phrase.
The probability that a randomly selected value of a continuous random variable lies between a and b is given by the area under the probability density curve between a and b.In Exercises 15–18, determine whether the statement is true or false. If the statement is false, rewrite it as a true
A normal curve is symmetric around its mode.In Exercises 15–18, determine whether the statement is true or false. If the statement is false, rewrite it as a true statement.
A normal curve is wide and flat when the standard deviation is small.In Exercises 15–18, determine whether the statement is true or false. If the statement is false, rewrite it as a true statement.
The area under the normal curve to the left of the mode is less than 0.5.In Exercises 15–18, determine whether the statement is true or false. If the statement is false, rewrite it as a true statement.
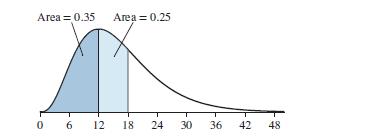
The following figure is a probability density curve that represents the lifetime, in months, of a certain type of laptop battery.a. Find the proportion of batteries with lifetimes between 12 and 18 months.b. Find the proportion of batteries with lifetimes less than 18 months.c. What is the
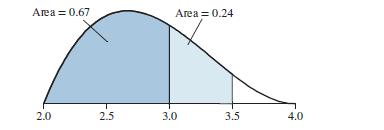
The following figure is a probability density curve that represents the grade point averages (GPA) of the graduating seniors at a large university.a. Find the proportion of seniors whose GPA is between 3.0 and 3.5.b. What is the probability that a randomly chosen senior will have a GPA greater than
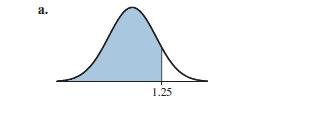
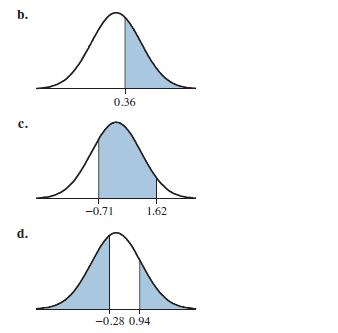
Find each of the shaded areas under the standard normal curve. a. 1.25
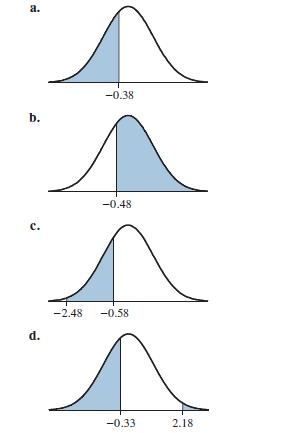
Find each of the shaded areas under the standard normal curve. a. b. -0.38 C. -0.48 -2.48 -0.58 d. -0.33 2.18
Find the area under the standard normal curve to the left ofa. z = 0.74b. z = −2.16c. z = 1.02d. z = −0.15
Find the area under the standard normal curve to the left ofa. z = 2.56b. z = 0.53c. z = −0.94d. z = −1.30
Showing 6400 - 6500
of 7930
First
58
59
60
61
62
63
64
65
66
67
68
69
70
71
72
Last
Step by Step Answers