New Semester
Started
Get
50% OFF
Study Help!
--h --m --s
Claim Now
Question Answers
Textbooks
Find textbooks, questions and answers
Oops, something went wrong!
Change your search query and then try again
S
Books
FREE
Study Help
Expert Questions
Accounting
General Management
Mathematics
Finance
Organizational Behaviour
Law
Physics
Operating System
Management Leadership
Sociology
Programming
Marketing
Database
Computer Network
Economics
Textbooks Solutions
Accounting
Managerial Accounting
Management Leadership
Cost Accounting
Statistics
Business Law
Corporate Finance
Finance
Economics
Auditing
Tutors
Online Tutors
Find a Tutor
Hire a Tutor
Become a Tutor
AI Tutor
AI Study Planner
NEW
Sell Books
Search
Search
Sign In
Register
study help
business
statistics alive
Introduction To Probability And Statistics 15th Edition William Mendenhall Iii , Robert Beaver , Barbara Beaver - Solutions
Identify which of the two variables is the independent variable x and which is the dependent variable y. 13. Number of ice cream cones sold by Baskin Robbins and the temperature on a given day.
Identify which of the two variables is the independent variable x and which is the dependent variable y.12. Speed of a wind turbine and the amount of electricity generated by the turbine.
Identify which of the two variables is the independent variable x and which is the dependent variable y. 11. Number of calories burned per day and the number of minutes running on a treadmill.
Identify which of the two variables is the independent variable x and which is the dependent variable y. 10. Number of hours spent studying and grade on a history test.
9. What are the assumptions made about the random error e in the probabilistic model y=a+bx+e?
8. What is the difference between deterministic and probabilistic models?
Give the equation and graph for a line with y-intercept and slope given 7. y-intercept -2.5; slope =5
Give the equation and graph for a line with y-intercept and slope given 6. y-intercept = 2.5; slope = 0
Give the equation and graph for a line with y-intercept and slope given 5. y-intercept -3; slope =1
Graph the line corresponding to the equation by graphing the points corresponding to x=0, 1, and 2. Give the y-intercept and slope for the line. 3. y=2x+3
Graph the line corresponding to the equation by graphing the points corresponding to x=0, 1, and 2. Give the y-intercept and slope for the line. 2. y=-2x+1
Graph the line corresponding to the equation by graphing the points corresponding to x=0, 1, and 2. Give the y-intercept and slope for the line. |1. y=2x+1
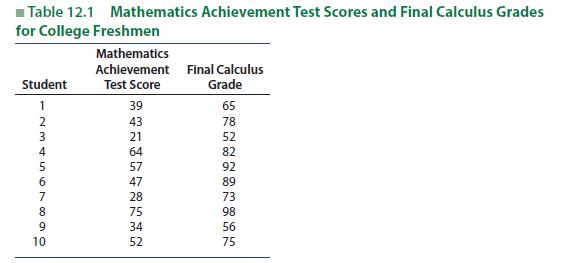
Find the least-squares prediction line for the calculus grade data in Table 12.1. Table 12.1 Mathematics Achievement Test Scores and Final Calculus Grades for College Freshmen Mathematics Achievement Final Calculus Student Test Score Grade 10 -234567890 1 39 65 43 78 21 52 64 82 57 92 47 89 28 73
18. A population consists of N 55 numbers: 1, 3, 5, 6, and 7. It can be shown that the mean and standard deviation for this population are m 54.4 and s 52.15, respectively.a. Construct a probability histogram for this population.b. Use the random number table, Table 10 in Appendix I, to select a
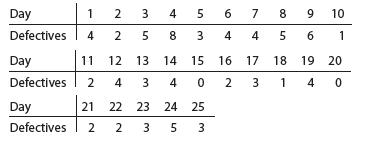
13. Defective Lightbulbs The table lists the number of defective 60-watt lightbulbs found in samples of 100 bulbs selected over 25 days from a manufacturing process. Assume that during this time the manufacturing process was not producing an excessively large fraction of defectivesa. Construct a p
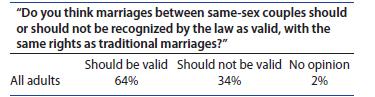
6. Same-Sex Marriage The results of a 2017 Gallup poll concerning views on same-sex marriage show that support for same-sex marriage is at an all-time high.21 The poll taken May 3–7, 2017 involved 1011 adults in the 50 states and the District of Columbia. The information followsa. Is this an
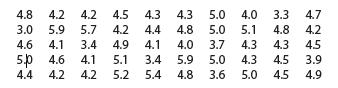
15. Canned Tomatoes During long production runs of canned tomatoes, the average weights (in grams) of samples of five cans of standard-grade tomatoes in pureed form were taken at 30 control points during an 11-day period. These results are shown in the table.18 When the machine is performing
14. More Baseball Bats Refer to Exercise 13 and suppose that during a day when the state of the 900-gram bat production process was unknown, the following weight measurements were obtained at hourly intervals from a sample of five bats.Use the control chart constructed in Exercise 13 to monitor the
12. Nuclear Power Plant The data in the table are measures of the radiation in air particulates at a nuclear power plant. Four measurements were recorded at weekly intervals over a 26-week period.a. Use the data to construct an x chart and plot the 26 values of x .b. Explain how the chart can be
10. Lumber Specs The manager of a buildingsupplies company randomly samples incoming lumber to see whether it meets quality specifications.From each shipment, 100 pieces of 234 lumber are inspected and judged according to whether they are first (acceptable) or second (defective) grade. The
34. Fido’s in the Car It seems that driving with a pet in the car is the third worst driving distraction, behind talking on the phone and texting. According to an American Automobile Association study, 80% of drivers admit to driving with a pet in the car, and of those, 20% allow their dogs to
32. Road Trip! Parents with children list a GPS system(28%) and a DVD player (28%) as “must have” accessories for a road trip.15 Suppose a sample of n51000 parents are randomly selected and asked what devices they would like to have for a family road trip. Let ˆp be the proportion of parents
31. Eco-Friendly A USA Today snapshot found that 47% of Americans associate “recycling” with Earth Day.14 Suppose a random sample of n5100 adults are polled and the 47% figure is correct.a. Does the distribution of ˆp, the sample proportion of Americans who associate “recycling” with Earth
Calculate SE ( pˆ ) for n=100 and the values of p given 22. p=.99
Calculate SE ( pˆ ) for n=100 and the values of p given 21. p=.90
Calculate SE ( pˆ ) for n=100 and the values of p given 20. p=.70
Calculate SE ( pˆ ) for n=100 and the values of p given 19. p=.50
Calculate SE ( pˆ ) for n=100 and the values of p given 18. p=.30
Calculate SE ( pˆ ) for n=100 and the values of p given 17. p=.10
Calculate SE ( pˆ ) for n=100 and the values of p given 16. p=.01
Random samples of size n=500 were selected from a binomial population with p=.1. Check to make sure that it is appropriate to use the normal distribution to approximate the sampling distribution of pˆ . Then use this result to find the probabilities 15. p lies within .02 of p
Random samples of size n=500 were selected from a binomial population with p=.1. Check to make sure that it is appropriate to use the normal distribution to approximate the sampling distribution of pˆ . Then use this result to find the probabilities 14. p
Random samples of size n=500 were selected from a binomial population with p=.1. Check to make sure that it is appropriate to use the normal distribution to approximate the sampling distribution of pˆ . Then use this result to find the probabilities 13. p > .12
Random samples of size n=75 were selected from a binomial population with p=.4. Use the normal distribution to approximate the probabilities given 12. P(p
Random samples of size n=75 were selected from a binomial population with p=.4. Use the normal distribution to approximate the probabilities given 11. P(.35.43)
Random samples of size n=75 were selected from a binomial population with p=.4. Use the normal distribution to approximate the probabilities given 10. P(p.38)
Random samples of size n=75 were selected from a binomial population with p=.4. Use the normal distribution to approximate the probabilities given 9. P(p.43)
Is it appropriate to use the normal distribution to approximate the sampling distribution of ˆp for the situations described 8. n=250, p = .99
Is it appropriate to use the normal distribution to approximate the sampling distribution of ˆp for the situations described 7. n=500, p=.1
Is it appropriate to use the normal distribution to approximate the sampling distribution of ˆp for the situations described 6. n = 75, p=.1
Is it appropriate to use the normal distribution to approximate the sampling distribution of ˆp for the situations described 5. n = 75, p=.4
Is it appropriate to use the normal distribution to approximate the sampling distribution of ˆp for the situations described 4. n=50, p=.05
Random samples of size n were selected from binomial populations with population parameters p given. Find the mean and the standard deviation of the sampling distribution of the sample proportion ˆp. 3. n=250, p=.6
Random samples of size n were selected from binomial populations with population parameters p given. Find the mean and the standard deviation of the sampling distribution of the sample proportion ˆp. 2. n=400, p=.1
Random samples of size n were selected from binomial populations with population parameters p given. Find the mean and the standard deviation of the sampling distribution of the sample proportion ˆp. 1. n=100, p=.3
The data are n548 sea-level pressures measured monthly for 4 years. Discuss the nonnormal aspects of the graphs in Figure 7.13. Figure 7.13 Histogram and normal probability plot for the data in Example 7.9 Relative Frequency 99.9 99.0 95.0 (a) 90.0 Histogram 80.0 70.0 10/48 60.0 50.0 40.0 8/48 6/48
Suppose a sample of n530 is selected from an exponential distribution with intensity l55 where l 51/m. Compare the resulting histogram and normal probability plot in Figure 7.12 with those for a normal sample. Figure 7.12 Histogram and normal probability plot for data from an exponential
Suppose the data are selected from a discrete uniform distribution on the integers 1 to 10.A sample of n5100 observations produced the histogram and normal probability plot in Figures 7.11. How do they differ from those produced by a normal sample? Relative Frequency Figure 7.11 Histogram and
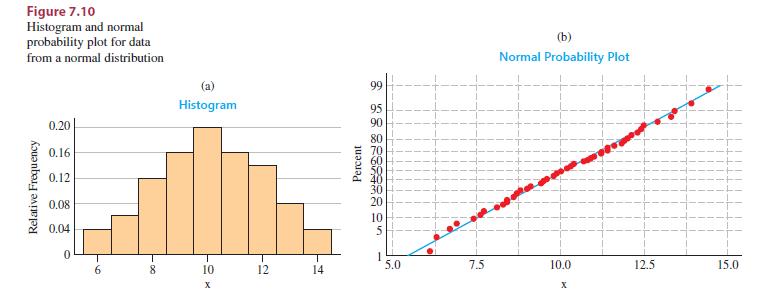
The histogram and normal probability plot in Figure 7.10 were constructed based upon a sample of n550 observations from a normal population with mean m 510 and standard deviation s 52. Comment on the shape of the histogram and whether the normal probability plots can reasonably be described as a
A random sample of n observations is selected from a population with standard deviation s =1. Calculate the standard error of the mean (SE) for the values of n 13. n=100
A random sample of n observations is selected from a population with standard deviation s =1. Calculate the standard error of the mean (SE) for the values of n 12. n=25
A random sample of n observations is selected from a population with standard deviation s =1. Calculate the standard error of the mean (SE) for the values of n 11 n=16
A random sample of n observations is selected from a population with standard deviation s =1. Calculate the standard error of the mean (SE) for the values of n 10. n=9
A random sample of n observations is selected from a population with standard deviation s =1. Calculate the standard error of the mean (SE) for the values of n 9. n=4
A random sample of n observations is selected from a population with standard deviation s =1. Calculate the standard error of the mean (SE) for the values of n 8. n=2
A random sample of n observations is selected from a population with standard deviation s =1. Calculate the standard error of the mean (SE) for the values of n 7. n=1
Random samples of size n were selected from a nonnormal population with the means and variances given What can be said about the sampling distribution of the sample mean? Find the mean and standard error for this distribution. 6. n=80, 36, = 6
Random samples of size n were selected from a nonnormal population with the means and variances given What can be said about the sampling distribution of the sample mean? Find the mean and standard error for this distribution. 5. n=10, 15,0=4
Random samples of size n were selected from a nonnormal population with the means and variances given What can be said about the sampling distribution of the sample mean? Find the mean and standard error for this distribution. 4. n 8, u 120, o = 1
Random samples of size n were selected from a normal population with the means and variances given . Describe the shape of the sampling distribution of the sample mean and find its mean and standard error. 3. n=8, 120, = 1
Random samples of size n were selected from a normal population with the means and variances given . Describe the shape of the sampling distribution of the sample mean and find its mean and standard error. 2. n=100, 5,0=4
Random samples of size n were selected from a normal population with the means and variances given . Describe the shape of the sampling distribution of the sample mean and find its mean and standard error. 1. n=36, 10,=9
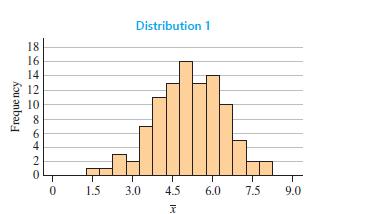
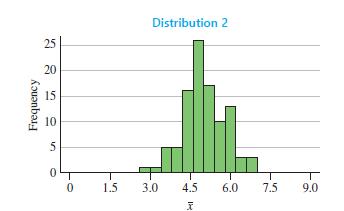
13. Sampling Plans The distribution of x using sampling plans with two different sample sizes are shown in the graphs that followThe mean of the population from which these samples came is equal to m 55.5. Which of these two sampling plans would you choose in estimating the population mean?
28. Going to the Moon Two different Gallup Polls were conducted for CNN/USA Today, both of which involved people’s feelings about the U.S. space program.5 Here is a question from each poll, along with the responses of the sampled Americans:a. Read the two poll questions. Which of the two wordings
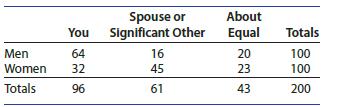
21. Bringing Home the Bacon In an Ad Age Insights white paper,9 working spouses were asked “Who is the household breadwinner?” Suppose that one person is selected at random from these 200 individuals.a. What is the probability that this person will identify his/herself as the household
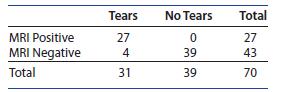
11. MRIs An article in The American Journal of Sports Medicine studied the accuracy of MRIs (magnetic resonance imaging) in detecting cartilage tears at two sites in the knees of 35 patients. The 233570 examinations produced the classifications shown in the table.8 Actual tears were confirmed by
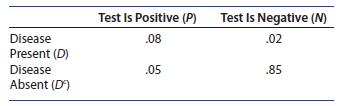
15. Screening Tests Suppose that a certain disease is present in 10% of the population, and that there is a screening test designed to detect this disease if present.The test does not always work perfectly. Sometimes the test is negative when the disease is present, and sometimes it is positive
When an experiment is conducted, one and only one of three mutually exclusive events 1 S , 2 S , and 3 S , can occur, with P(S1 )=.2 , P(S2 )=.5 , and P(S3 )=.3 . The probabilities that an event A occurs, given that event S1 , S2 , or S3 has occurred areIf event A is observed, use this
When an experiment is conducted, one and only one of three mutually exclusive events 1 S , 2 S , and 3 S , can occur, with P(S1 )=.2 , P(S2 )=.5 , and P(S3 )=.3 . The probabilities that an event A occurs, given that event S1 , S2 , or S3 has occurred areIf event A is observed, use this
When an experiment is conducted, one and only one of three mutually exclusive events 1 S , 2 S , and 3 S , can occur, with P(S1 )=.2 , P(S2 )=.5 , and P(S3 )=.3 . The probabilities that an event A occurs, given that event S1 , S2 , or S3 has occurred areIf event A is observed, use this
A sample is selected from one of two populations, 1 S and 2 S , with P(S1 )=.7 and P(S2 )=.3 . The probabilities that an event A occurs, given that event S1 or S2 has occurred are P(A|S,)=2 and P(A|S)=.3
A sample is selected from one of two populations, 1 S and 2 S , with P(S1 )=.7 and P(S2 )=.3 . The probabilities that an event A occurs, given that event S1 or S2 has occurred are P(A|S,)=2 and P(A|S)=.3
A sample is selected from one of two populations, 1 S and 2 S , with P(S1 )=.7 and P(S2 )=.3 . The probabilities that an event A occurs, given that event S1 or S2 has occurred are1. Use the Law of Total Probability to find P(A). P(A|S,)=2 and P(A|S)=.3
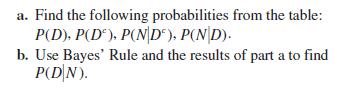
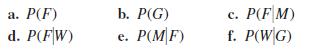
36. Choosing a Mate Men and women often disagree on how they think about selecting a mate. Suppose that a poll of 1000 individuals in their twenties gave the following responses to the question of whether it is more important for their future mate to be able to communicate their feelings (F) than
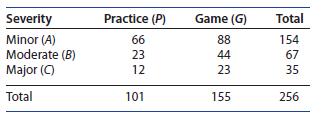
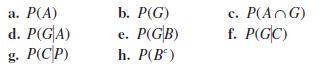
35. Soccer Injuries During the inaugural season of Major League Soccer in the United States, the medical teams documented 256 injuries that caused a loss of playing time to the player. The results reported in The American Journal of Sports Medicine are shown in the tableIf one individual is drawn
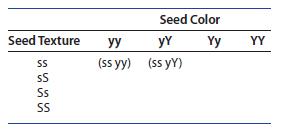
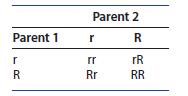
34. Plant Genetics Refer to Exercise 33. Suppose you are interested in following two independent traits in snap peas—seed texture (S = smooth, s = wrinkled)and seed color (Y = yellow, y = green)—in a second-generation cross of heterozygous parents. Remember that the capital letter represents
33. Plant Genetics In 1865, Gregor Mendel suggested a theory of inheritance based on the science of genetics.He identified heterozygous individuals for flower color that had two alleles (r 5 recessive white color allele and R 5 dominant red color allele). When these individuals were mated, 3/4 of
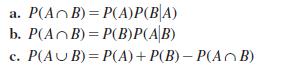
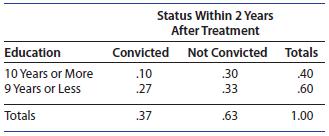
25. Use the probabilities of Exercise 24 to show that these equalities are true: a. P(AB) = P(A)P(BA) b. P(AB) P(B)P(A|B) C. P(AUB) = P(A) + P(B)-P(AB)
24. Drug Offenders A study of drug offenders who have been treated for drug abuse suggests that the chance of conviction within a 2-year period after treatment may depend on the offender’s education. The proportions of the total number of cases that fall into four education/conviction categories
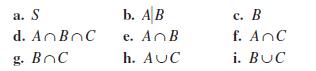
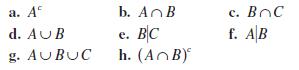
18. Find the probabilities associated with the following events using either the simple event approach or the rules and definitions from this section. a. S b. AB c. B d. A B C e. A B f. A C g. BOC h. AUC i. BUC
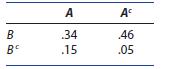
An experiment can result in one or both of events A and B with the probabilities shown as follows.Use the probability table to answer the question13. Are events A and B independent? Explain. A Ac B .34 .46 B .15 .05
An experiment can result in one or both of events A and B with the probabilities shown as follows.Use the probability table to answer the question12. Are events A and B mutually exclusive? Explain. A Ac B .34 .46 B .15 .05
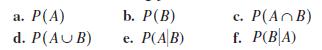
An experiment can result in one or both of events A and B with the probabilities shown as follows.Use the probability table to answer the question11. Find the following probabilities: A Ac B .34 .46 B .15 .05
Suppose P(A)=.1 and P(B)=.5. 10. If P(AUB) .65, are A and B mutually exclusive?
Suppose P(A)=.1 and P(B)=.5. 9. If P(AB)=0, are A and B independent?
Suppose P(A)=.1 and P(B)=.5. 8. If P(AB) .1, are A and B independent?
Suppose P(A)=.1 and P(B)=.5. 7. If P(A|B)=.1, what is P(AB)?
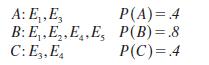
6. Are events A and B mutually exclusive?An experiment can result in one of five equally likely simple events, 1 E , 2 E ,. . . , 5 E . Events A, B, and C are defined as follows. Use these events to answer the question A: E,E, P(A)=4 B: E,,E.EE, P(B)=8 C: E3,E P(C)=.4
5. Are events A and B independent?An experiment can result in one of five equally likely simple events, 1 E , 2 E ,. . . , 5 E . Events A, B, and C are defined as follows. Use these events to answer the question A: E,E, P(A)=4 B: E,,E.EE, P(B)=8 C: E3,E P(C)=.4
4. Use the Addition and Multiplication Rules to find these probabilities:Do the results agree with those obtained in Exercise 1?An experiment can result in one of five equally likely simple events, 1 E , 2 E ,. . . , 5 E . Events A, B, and C are defined as follows. Use these events to answer the
3. Use the definition of conditional probability to find these probabilities:Do the results agree with those obtained in Exercise 1?An experiment can result in one of five equally likely simple events, 1 E , 2 E ,. . . , 5 E . Events A, B, and C are defined as follows. Use these events to answer
2. Use the definition of a complementary event to find these probabilities:Do the results agree with those obtained in Exercise 1?An experiment can result in one of five equally likely simple events, 1 E , 2 E ,. . . , 5 E . Events A, B, and C are defined as follows. Use these events to answer the
1. Find the probabilities associated with the following events by listing the simple events in eachAn experiment can result in one of five equally likely simple events, 1 E , 2 E ,. . . , 5 E . Events A, B, and C are defined as follows. Use these events to answer the question a. A b. A B B|C h.
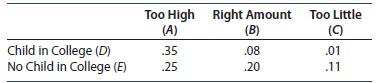
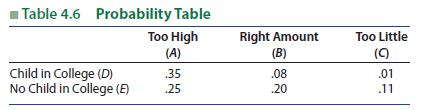
Refer to the probability table in Example 4.19 which is reproduced here.Are events D and A independent? Explain Too High Right Amount Too Little (A) (B) (9) Child in College (D) .35 .08 .01 No Child in College (E) .25 .20 .11
In a survey of 1000 adults, respondents were asked about the cost of a college education. The respondents were classified according to whether they currently had a child in college and whether they thought the loan burden for most college students is too high, the right amount, or too little. The
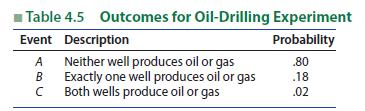
An oil company plans to drill two exploratory wells. Past evidence is used to assess the probabilities of the possible outcomes listed in Table 4.5. Table 4.5 Outcomes for Oil-Drilling Experiment Event Description A Neither well produces oil or gas B Probability .80 Exactly one well produces oil or
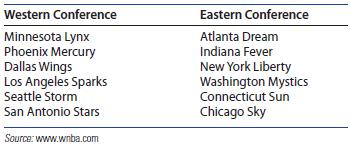
25. The WNBA Professional basketball is now a reality for women basketball players in the United States.There are two conferences in the WNBA, each with six teams, as shown in the following tableTwo teams, one from each conference, are randomly selected to play an exhibition game.a. How many pairs
Evaluate the combinations 12. C20
Evaluate the combinations 11. C 6
Evaluate the combinations 10 10. Co
Showing 200 - 300
of 6613
1
2
3
4
5
6
7
8
9
10
11
12
13
14
15
Last
Step by Step Answers