New Semester
Started
Get
50% OFF
Study Help!
--h --m --s
Claim Now
Question Answers
Textbooks
Find textbooks, questions and answers
Oops, something went wrong!
Change your search query and then try again
S
Books
FREE
Study Help
Expert Questions
Accounting
General Management
Mathematics
Finance
Organizational Behaviour
Law
Physics
Operating System
Management Leadership
Sociology
Programming
Marketing
Database
Computer Network
Economics
Textbooks Solutions
Accounting
Managerial Accounting
Management Leadership
Cost Accounting
Statistics
Business Law
Corporate Finance
Finance
Economics
Auditing
Tutors
Online Tutors
Find a Tutor
Hire a Tutor
Become a Tutor
AI Tutor
AI Study Planner
NEW
Sell Books
Search
Search
Sign In
Register
study help
business
statistics for experimentert
Statistics Without Maths For Psychology 5th Edition Christine Dancey - Solutions
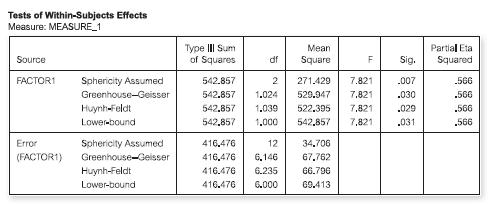
Look at the following output, which relates to a repeated-measures ANOVA with three conditions.Assume sphericity has been violated.Which is the most appropriate statement?The difference between the conditions represented by:(a) F(2,12) = 7.82, p = 0.007 (b) F(1,6) = 7.82, p = 0.030 (c) F(2,12) =
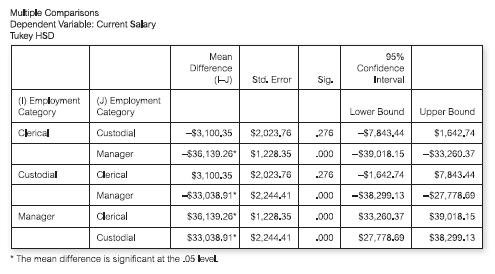
The following is output relating to a post-hoc test, after a one-way ANOVA:Which groups differ signifi cantly from each other?(a) Clerical and custodial occupations only (b) Custodial and manager occupations only (c) Manager and clerical occupations only (d) Manager and clerical plus manager and
Calculating how much of the total variance is due to error and the experimental manipulation is called:(a) Calculating the variance(b) Partitioning the variance(c) Producing the variance(d) Summarising the variance
If, in an analysis of variance, you obtain a partial eta2 of 0.52, then how much of the variance in scores on the dependent variable can be accounted for by the independent variable?(a) 9%(b) 52%(c) 25%(d) 27%
The assumption of sphericity means that:(a) The variances of all the sample groups should be similar(b) The variances of the population difference scores should be the same for any two conditions(c) The variances of all the population difference scores should be similar(d) The variances of all the
Dr Colin Cashew allots each of 96 participants randomly to one of four conditions. As Colin Cashew is very conscientious, he meticulously inspects his histograms and other descriptive statistics, and fi nds that his data are perfectly normally distributed. In order to analyse the differences
Individual differences within each group of participants are called:(a) Treatment effects(b) Between-participants error(c) Within-participants error(d) Individual biases
Herr Hazelnuss is thinking about whether he should use a related or unrelated design for one of his studies. As usual, there are advantages and disadvantages to both. He has four conditions. If, in a related design, he uses 10 participants, how many would he need for an unrelated design?(a) 40(b)
Differences between groups, which result from our experimental manipulation, are called:(a) Individual differences(b) Treatment effects(c) Experiment error(d) Within-participants effects
Professor P. Nutt is examining the differences between the scores of three groups of participants.If the groups show homogeneity of variance, this means that the variances for the groups:(a) Are similar(b) Are dissimilar(c) Are exactly the same(d) Are enormously different
The relationship between the F ratio and t-value is explained by:(a) t3 = F(b) F2 = t(c) t2 = F(d) f 3 = t
The F-ratio is a result of:(a) Within-groups variance/between-groups variance(b) Between-groups variance/within-groups variance(c) Between-groups variance × within-groups variance(d) Between-groups variance + within-groups variance
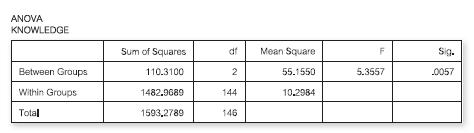
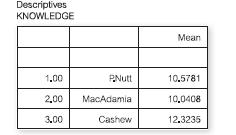
Here are the results for the KNOWLEDGE questionnaire, which the students completed after their one-hour lecture:Which is the most sensible conclusion?(a) There are signifi cant differences between the groups on KNOWLEDGE; specifi cally, Colin Cashew’s group retained more of the lecture than the
The following is also given with the above printout:What can you conclude from this?(a) The variances of the groups are signifi cantly different from each other (b) The variances of the groups are similar (c) The variances are heterogeneous (d) None of the above Test of Homogeneity of Variances
Which is the most appropriate conclusion?(a) There are statistically signifi cant differences between the three groups of students on ENJOYMENT(b) There are important differences between the three groups but these are not statistically signifi cant(c) There are no statistical or important
Parametric one-way independent ANOVA is a generalisation of:(a) The paired t-test(b) The independent t-test(c) c2(d) Pearson’s r
If you are performing a 4 ¥ 4 c2 analysis and fi nd you have broken the assumptions, then you need to:(a) Look at the results for a Fisher’s exact probability test(b) Look to see whether it is possible to collapse categories(c) Investigate the possibility of a t-test(d) Give up
The general purpose for which a 2 ¥ 2 c2 analysis is used is to discover whether:(a) There is a signifi cant association between two categorical variables(b) There is an association between two continuous variables(c) Two groups of participants differ on two variables(d) None of the above
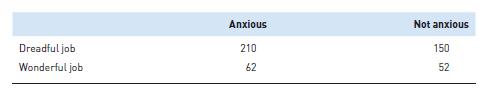
Look at the following table.This is called a:(a) 2 ¥ 2 contingency table (b) 3 ¥ 2 contingency table (c) 1 ¥ 2 chi square table (d) 2 ¥ 2 chi square table Anxious Not anxious 150 52 Dreadful job 210 Wonderful job 62
In order to fi nd out the effect size after performing a c2 analysis, we:(a) convert Cramer’s V to c2(b) convert c2 to Cramer’s V(c) square the c2 value(d) convert c2 to Fisher’s Z
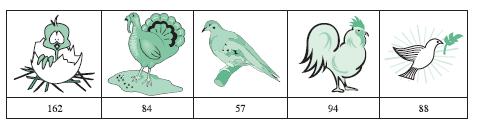
485 people are asked which of fi ve types of bird pictures they prefer to be put on a ‘stop all wars’campaign. Results are as follows:What are the expected frequencies for the cells?(a) 79 (b) 97 (c) 485 (d) 5 162 84 57 94 88
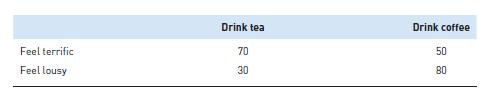
Look at the following 2 ¥ 2 contingency table, taken from 150 participants:There is something wrong with the above, in that the numbers in the cells should:(a) Add up to 150 (b) Add up to 100 (c) Be equal (d) Be analysed by a 4 ¥ 3 c2 Feel terrific Feel lousy Drink tea 70 23 30 Drink coffee 50 gg
The value of Cramer’s V is:(a) 0.05(b) 0.008(c) 0.099(d) 0.010
The c2 value has an exact probability level of:(a) 0.0004(b) 0.05(c) 0.01055(d) 0.00796
The c2 value is:(a) 12.162(b) 21.516(c) 22.305(d) 525
The Yates’ correction is sometimes used by researchers when:(a) Cell sizes are huge(b) Cell sizes are small(c) They analyse data from 2 ¥ 2 contingency tables(d) Both (b) and (c) above
The value of c2 will always be:(a) Positive(b) Negative(c) High(d) It depends
A one-variable c2 is also called:(a) Goodness-of-fi t test(b) c2 test of independence(c) c2 4 ¥ 2(d) 2 ¥ 2 c2
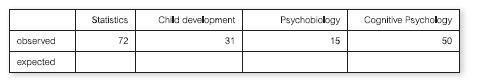
Look at the following table:What is the value of the expected frequencies?(a) 32 (b) 50 (c) 42 (d) 25 observed expected Statistics 72 Child development 31 Psychobiology 15 Cognitive Psychology 50
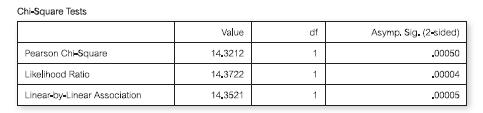
Look at the following output:c2 has an associated probability of:(a) 0.00005 (b) 0.00004 (c) 0.00200 (d) 0.00050 Chi-Square Tests Value of Asymp. Sig. (2-sided) Pearson Chi-Square 14.3212 1 .00050 Likelihood Ratio 14.3722 1 Linear-by-Linear Association 14.3521 1 .00004 .00005
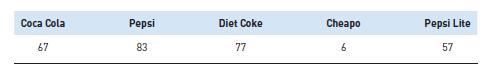
290 people are asked which of fi ve types of cola they prefer. Results are as follows:What are the expected frequencies for the cells:(a) 57 (b) 58 (c) 290 (d) None of the above Coca Cola Pepsi Diet Coke Cheapol Pepsi Lite 67 83 23 77 6 57
The number of people in this analysis is:(a) 231(b) 170(c) 124(d) 525
Pearson’s c2 has an associated probability of:(a) < 0.001(b) 0.00004(c) 0.00124(d) None of these
How many women were in the Tuesday morning group?(a) 127(b) 43(c) 99(d) 210
Cramer’s V is:(a) A victory sign made after performing Cramer’s statistical test(b) A measure of effect based on standardised scores(c) A correlational measure of effect converted from c2(d) A measure of difference
Fisher’s Exact Probability Test is used when:(a) The calculations for c2 are too diffi cult(b) You have more than 25% of cells with expected frequencies of less than 5 in a 2 ¥ 2 design(c) You have more than 25% of cells with expected frequencies of less than 5 in a 3 ¥ 2 contingency table(d)
When is a knowledge of power more important?(a) When you fi nd an effect(b) When you don’t fi nd an effect(c) It makes no difference
If d = 0.89, then the effect size is said to be:(a) Zero(b) Weak(c) Moderate(d) Strong
As your statistical test grows more powerful, does your confi dence interval become:(a) Wider(b) Narrower(c) It makes no difference
Confi dence intervals around a mean value give you:(a) A range within which the population mean is likely to fall(b) A range within which the sample mean is likely to fall(c) A point estimate of the population mean(d) A point estimate of the sample mean
What are your chances of fi nding an effect (if one exists) when power = 0.6?(a) 50:50(b) 60:40(c) 40:60(d) 60:60
Relative to large effect sizes, small effect sizes are:(a) Easier to detect(b) Harder to detect(c) As easy to detect(d) As diffi cult to detect
It is more important to know the power of a study when:(a) The study has large participant numbers and is statistically signifi cant(b) The study has large participant numbers and is not statistically signifi cant(c) The study has small participant numbers and is statistically signifi cant(d) The
Look at the following output from a paired t-test analysis:Which is the most sensible answer?(a) The sample mean difference is −0.15, and we are 95% confi dent that the population mean difference will fall between −0.32 and 0.02 (b) The sample mean difference is 0.76, and we are 95% confi dent
A researcher has found a correlation coeffi cient of r = +0.30, CI(95%) = −0.2 − (+0.7). Which is the most sensible conclusion? We are 95% confi dent that the population regression line would be:(a) Positive (+0.30)(b) Zero(c) Negative (−0.2)(d) Between −0.2 and +0.7
Look at the following output for an independent t-test:Which is the most appropriate answer?We can be 95% confi dent that:(a) The population mean difference is 27.7 (b) The population mean difference will fall between −36.21 and −19.18 (c) The population mean will fall between 19.46 and 35.93
A power level of 0.3 means:(a) You have a 30% chance of detecting an effect(b) You have a 49% chance of detecting an effect(c) You have a 70% chance of detecting an effect(d) You have a 0.7% chance of detecting an effect
Power can be calculated by a knowledge of:(a) The statistical test, the type of design and the effect size(b) The statistical test, the criterion signifi cance level and the effect size(c) The criterion signifi cance level, the effect size and the type of design(d) The criterion signifi cance
All other things being equal, the more powerful the statistical test:(a) The wider the confi dence intervals(b) The more likely the confi dence interval will include zero(c) The narrower the confi dence interval(d) The smaller the sample size
Sample means are:(a) Point estimates of sample means(b) Interval estimates of population means(c) Interval estimates of sample means(d) Point estimates of population means
Effect size is:(a) The magnitude of the difference between conditions(b) The strength of a relationship or association(c) Both of these(d) Neither of these
Power is the ability to detect:(a) A statistically signifi cant effect where one exists(b) A psychologically important effect where one exists(c) Both (a) and (b) above(d) Design fl aws
All other things being equal:(a) The more sample size increases, the more power decreases(b) The more sample size increases, the more power increases(c) Sample size has no relationship to power(d) The more sample size increases, the more indeterminate the power
All other things being equal, repeated-measures designs:(a) Have exactly the same power as independent designs(b) Are often less powerful than independent designs(c) Are often more powerful than independent designs(d) None of the above
Statistical signifi cance:(a) Is directly equivalent to psychological importance(b) Does not necessarily mean that results are psychologically important(c) Depends on sample size(d) Both (b) and (c) above
The narrower the confi dence intervals:(a) The more confi dence you can place in your results(b) The less you can rely on your results(c) The greater the chance that your results were due to sampling error(d) None of the above
Generalising to the population, what sign would the expected t-value take?(a) Positive(b) Negative(c) It could be either positive or negative
Which row would the researcher use to interpret the independent t-test results?(a) The equal variances row(b) The unequal variances row
Why are ‘all of the p values’ reported as p < 0.001, when the other named variables have been reported with the exact probability values?(a) The researchers could not work out the exact probability values(b) The signifi cance level in their statistical program calculated p = 0.000(c) The
Levene’s test is:(a) A test of heterogeneity that relies on the assumption of normality(b) A test of homogeneity that relies on the assumption of normality(c) A test of heterogeneity that does not rely on the assumption of normality(d) A test of homogeneity of variances that does not rely on the
For a within-participants design using 20 people, the degrees of freedom are:(a) 20(b) 38(c) 19(d) 40
In an independent t-test, you would use the ‘equal variances not assumed’ part of the output when Levene’s test is:(a) Above a criterion signifi cance level (e.g. p > 0.05)(b) Below a criterion signifi cance level (e.g. p < 0.05)(c) When numbers of participants are unequal in the two
In the SPSS output, if p = 0.000, then you should report this as:(a) = 0.000(b) = 0.0001(c) < 0.001(d) < 0.0001
In an analysis using an unrelated t-test, you fi nd the following result:Levene’s Test for Equality of Variances: F = 0.15, p = 0.58 This shows that the variances of the two groups are:(a) Dissimilar(b) Similar(c) Exactly the same(d) Indeterminate
If the 95% confi dence limits around the mean difference (in a t-test) are 10.5 – 13.0, we can conclude that, if we repeat the study 100 times, then:(a) Our results will be statistically signifi cant 5 times(b) Our results will be statistically signifi cant 95 times(c) 95% of the time, the
The effect size for independent groups,d, can be calculated by:(a) (mean 1 − mean 2) ÷ mean SD(b) (mean 1 + mean 2) ÷ mean SD(c) (mean 1 − mean 2) ÷ SEM(d) (mean 1 + mean 2) ÷ SEM
What can you conclude from the results?(a) There are no statistically signifi cant differences or important differences between the two groups(b) There is a statistically signifi cant difference but it is not important(c) There is an important difference between the two groups but it is not
The variances of the two groups are:(a) Indeterminate(b) Unequal(c) Assumed to be equal(d) Skewed
The difference between the means of the groups is (correct to one decimal place):(a) 0.41(b) 0.69(c) 0.96(d) 0.76
A t-value of -5 is:(a) Less important than a value of +5(b) More important than a value of +5(c) Equivalent to a value of +5(d) Less signifi cant than a value of +5
The higher the t-value, the more likely it is that the differences between groups are:(a) A result of sampling error(b) Not a result of sampling error(c) Similar to each other(d) None of the above
The most important assumption to meet when using a t-test is:(a) The variation in scores should be minimal(b) Scores should be drawn from a normally distributed population(c) Conditions should have equal means(d) All of the above
One hundred students were tested on their anxiety before and after an anxiety counselling session.Scores are drawn from a normally distributed population. Which statistical test is the most appropriate?(a) Independent groups t-test(b) Related measures t-test(c) Levene’s test(d) None of these
For an independent t-test with 15 participants in each condition, the appropriate DF is:(a) 28(b) 14(c) 30(d) 15
For a paired t-test with 40 participants, the appropriate DF is:(a) 20(b) 39(c) 38(d) None of these
The DF for an independent t-test analysis with 20 participants in each condition is:(a) 38(b) 20(c) 40(d) 68
SPSS prints the following: p = .0000. How should this be reported?(a) < 0.001(b) < 0.0001(c) > 0.001(d) > 0.0001
If a correlation coeffi cient has an associated probability value of 0.02, then:(a) Our hypothesis is obviously true(b) Our results are important(c) There is only a 2% chance that our results are due to sampling error, assuming the null hypothesis to be true(d) There is only a 2% chance that our
A positive relationship means:(a) An important relationship exists(b) As scores on x rise, scores on y fall(c) As scores on x rise, so do those on y(d) High scores are frequent on x and y
The cell c3 relates to:(a) Intrusiveness and internal beliefs(b) Intrusiveness and external beliefs(c) Intrusiveness and symptoms(d) Depression and symptoms
Which cell relates to the scattergram between ‘internal beliefs’ and ‘external beliefs’?(a) d1(b) d2(c) d3(d) d4
A researcher wishes to look at the relationship between motivation and examination performance.However, she has reason to believe that IQ infl uences both of these variables and decides to obtain partial correlations. Which of the following options is most sensible? She should perform a correlation
A correlation of -0.5 has been found between height and weight in a group of schoolchildren. How much of the variance in height can be explained by weight, in percentage terms?(a) 5%(b) 50%(c) 25%(d) None of the above
Which correlation is the weakest?(a) ‘family relationships’ and ‘relationship with spouse’(b) ‘family relationships’ and ‘other social relationships’(c) ‘other social relationships’ and ‘had crying spells’(d) ‘satisfi ed with life’ and ‘had crying spells’
Of the following, which two variables show the strongest relationship?(a) ‘family relationships’ and ‘relationship with spouse’(b) ‘satisfi ed with life’ and ‘family relationships’(c) ‘family relationships’ and ‘other social relationships’(d) ‘felt sad’ and ‘had crying
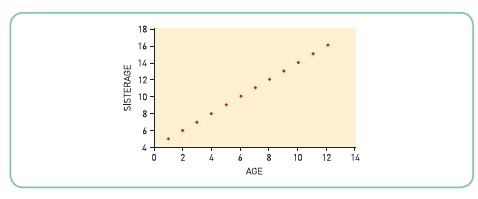
Look at the following scattergram:Which is the most sensible answer? The variables show a correlation of:(a) -1.0 (b) -0.1 (c) +1.00 (d) +0.1 SISTERAGE 6 18- 16 T T T 0 2 4 8 10 12 14 AGE
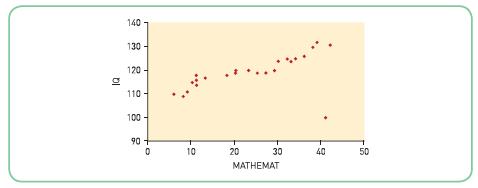
Look at the following scattergram:Which is the most sensible answer? The variables show a correlation of:(a) +1.00 (b) -1.00 (c) +0.7 (d) -0.7 140 130 120 bl 110 100 90+ 0 10 20 30 40 MATHEMAT 550 50
Length of time working at the computer and poor eyesight are negatively correlated. What should we conclude?(a) People with poor eyesight are more likely to spend long hours working at the computer(b) Working for long hours is likely to cause a deterioration of eyesight(c) A particular type of
If you have a correlation coeffi cient of 0.4, how much variance is left unexplained?(a) 16%(b) 40%(c) 84%(d) None of the above
Someone who runs a correlational analysis says that an effect size of 64% has been found. What value of r did they obtain?(a) +0.8(b) -0.8(c) 0.8, but we cannot tell whether the value is positive or negative(d) 0.64
If you have a correlation coeffi cient of 0.5, how much variance is left unexplained?(a) 25%(b) 50%(c) 75%(d) None of the above
What is the achieved signifi cance level of ‘family relationships’ and ‘mood’?(a) < 0.001(b) = 0.011(c) = 0.912(d) < 0.01
Which correlation is the weakest?(a) ‘QOL’ and ‘age’(b) ‘mood’ and ‘age’(c) ‘family relationships’ and ‘age’(d) ‘family relationships’ and ‘mood’
Of those below, which two variables show the strongest relationship?(a) ‘QOL’ and ‘family relationships’(b) ‘QOL’ and ‘age’(c) ‘mood’ and ‘QOL’(d) ‘mood’ and ‘age’
If two variables are totally independent, then the correlation between them is:(a) -0.1(b) -1.00(c) +1.00(d) zero
If 36% of the variation in scores on y has been accounted for by scores on x, how much variance is unexplained?(a) 64%(b) 36%(c) 6%(d) 0.6%
If you fi nd in a study that your p-value is 0.05, what is the probability of the alternative hypothesis being true?(a) 0.05(b) 1 minus 0.05(c) We cannot work out the probability of the alternative hypothesis being true(d) None of the above
Imagine we conduct two studies. In study A we have 1000 participants and obtain a p-value of 0.01, whereas in study B we have only 20 participants and a p-value of 0.05. In which of these two studies is there the larger effect?(a) Study A(b) Study B(c) The effect is the same in each study(d) We
When we convert our data into a score from a probability distribution, what do we call the value we obtain?(a) Signifi cant(b) Not signifi cant(c) The test statistic(d) The power of the study
Why do we usually set our criterion for signifi cance at 0.05?(a) This is the traditional level used by most psychologists(b) This represents a good balance between making Type I and Type II errors(c) It is easier to get signifi cant results with this a(d) Both (a) and (b) above
Showing 900 - 1000
of 5401
First
3
4
5
6
7
8
9
10
11
12
13
14
15
16
17
Last
Step by Step Answers