New Semester
Started
Get
50% OFF
Study Help!
--h --m --s
Claim Now
Question Answers
Textbooks
Find textbooks, questions and answers
Oops, something went wrong!
Change your search query and then try again
S
Books
FREE
Study Help
Expert Questions
Accounting
General Management
Mathematics
Finance
Organizational Behaviour
Law
Physics
Operating System
Management Leadership
Sociology
Programming
Marketing
Database
Computer Network
Economics
Textbooks Solutions
Accounting
Managerial Accounting
Management Leadership
Cost Accounting
Statistics
Business Law
Corporate Finance
Finance
Economics
Auditing
Tutors
Online Tutors
Find a Tutor
Hire a Tutor
Become a Tutor
AI Tutor
AI Study Planner
NEW
Sell Books
Search
Search
Sign In
Register
study help
business
statistics for experimentert
Statistics For The Behavioral Sciences 10th Edition Frederick J Gravetter, Larry B. Wallnau - Solutions
For each of the following, calculate the pooled variance and the estimated standard error for the sample mean differencea. The first sample has n = 4 scores and a variance of s2 = 17, and the second sample has n = 8 scores and a variance of s2 = 27.b. Now the sample variances are increased so that
For each of the following, assume that the two samples are obtained from populations with the same mean, and calculate how much difference should be expected, on average, between the two sample means.a. Each sample has n = 4 scores with s2 = 68 for the first sample and s2 = 76 for the second.
Two samples are selected from the same population. For each of the following, calculate how much difference is expected, on average, between the two sample means.a. One sample has n = 4, the second has n = 6, and the pooled variance is 60.b. One sample has n = 12, the second has n = 15, and the
As noted on page 304, when the two population means are equal, the estimated standard error for the independent-measures t test provides a measure of how much difference to expect between two sample means. For each of the following situations, assume that µ1 = µ2 and calculate how much difference
If other factors are held constant, explain how each of the following influences the value of the independentmeasures t statistic, the likelihood of rejecting the null hypothesis, and the magnitude of measures of effect size.a. Increasing the number of scores in each sample.b. Increasing the
In a recent study, Piff, Kraus, Côté, Cheng, and Keitner (2010) found that people from lower social economic classes tend to display greater prosocial behavior than their higher class counterparts. In one part of the study, participants played a game with an anonymous partner. Part of the game
A researcher conducts an independent-measures study comparing two treatments and reports the t statistic as t(25) = 2.071.a. How many individuals participated in the entire study?b. Using a two-tailed test with α = .05, is there a significant difference between the two treatments?c. Compute r2 to
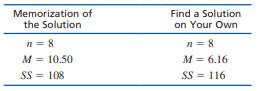
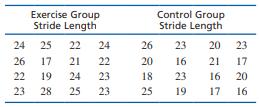
In a classic study in the area of problem solving, Katona (1940) compared the effectiveness of two methods of instruction. One group of participants was shown the exact, step-by-step procedure for solving a problem and was required to memorize the solution.Participants in a second group were
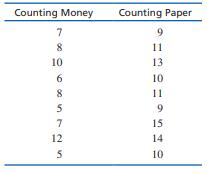
In the Chapter Preview we presented a study showing that handling money reduces the perception pain(Zhou, Vohs, & Baumeister, 2009). In the experiment, a group of college students was told that they were participating in a manual dexterity study. Half of the students were given a stack of money
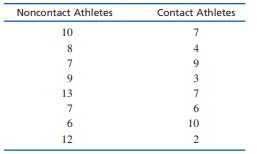
McAllister et al. (2012) compared varsity football and hockey players with varsity athletes from noncontact sports to determine whether exposure to head impacts during one season have an effect on cognitive performance. In the study, tests of new learning performance were significantly poorer for
Recent research has demonstrated that music-based physical training for elderly people can improve balance, walking efficiency, and reduce the risk of falls (Trombetti et al., 2011). As part of the training, participants walked in time to music and responded to changes in the music’s rhythm
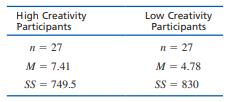
Recent research has shown that creative people are more likely to cheat than their less creative counterparts (Gino and Ariely, 2012). Participants in the study first completed creativity assessment questionnaires and then returned to the lab several days later for a series of tasks. One task was a
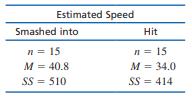
In 1974, Loftus and Palmer conducted a classic study demonstrating how the language used to ask a question can influence eyewitness memory. In the study, college students watched a film of an automobile accident and then were asked questions about what they saw. One group was asked, “About how
Does posting calorie content for menu items affect people’s choices in fast food restaurants? According to results obtained by Elbel, Gyamfi, and Kersh(2011), the answer is no. The researchers monitored the calorie content of food purchases for children and adolescents in four large fast food
It appears that there is some truth to the old adage“That which doesn’t kill us makes us stronger.”Seery, Holman, and Silver (2010) found that individuals with some history of adversity report better mental health and higher well-being compared to people with little or no history of
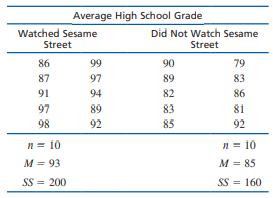
Research results suggest a relationship between the TV viewing habits of 5-year-old children and their future performance in high school. For example, Anderson, Huston, Wright, and Collins (1998) report that high school students who regularly watched Sesame Street as children had better grades in
Two separate samples receive different treatments.After treatment, the first sample has n = 9 with SS =462, and the second has n = 7 with SS = 420.a. Compute the pooled variance for the two samples.b. Calculate the estimated standard error for the sample mean difference.c. If the sample mean
Two separate samples, each with n = 15 individuals, receive different treatments. After treatment, the first sample has SS = 1740 and the second has SS = 1620.a. Find the pooled variance for the two samples.b. Compute the estimated standard error for the sample mean difference.c. If the sample mean
One sample has SS = 60 and a second sample has SS = 48.a. If n = 7 for both samples, find each of the sample variances, and calculate the pooled variance.Because the samples are the same size, you should find that the pooled variance is exactly halfway between the two sample variances.b. Now assume
One sample has SS = 36 and a second sample has SS = 18.a. If n = 4 for both samples, find each of the sample variances and compute the pooled variance.Because the samples are the same size, you should find that the pooled variance is exactly halfway between the two sample variances.b. Now assume
If other factors are held constant, what effect does increasing the sample variance have on the likelihood of rejecting the null hypothesis and measures of effect size for the independent-measures t statistic?a. Both the likelihood and measures of effect size will increase.b. Both the likelihood
If other factors are held constant, what effect does increasing the sample sizes have on the likelihood of rejecting the null hypothesis and measures of effect size for the independent-measures t statistic?a. Both the likelihood and measures of effect size will increase.b. Both the likelihood and
Which of the following sets of data is most likely to reject the null hypothesis in a test with the independent-measures t statistic. Assume that other factors are held constant.a. n = 20 and SS = 210 for both samplesb. n = 10 and SS = 210 for both samplesc. n = 20 and SS = 410 for both samplesd. n
Describe how sample size and sample variance influence the outcome of a hypothesis test and measures of effect size for the independent-measures t statistic.
A researcher completes a hypothesis test with an independent-measures t statistic and obtains t = 2.36 with df = 18, which is significant with α = .05, and computes Cohen’s d = 0.36. How would this result appear in a scientific report?a. t(18) = 2.36, d = 0.36, p > .05b. t(18) = 2.36, d = 0.36,
An independent-measures study with n = 10 in each treatment produces M = 35 for the first treatment and M = 30 for the second treatment. If the data are evaluated with a hypothesis test and the decision is to reject the null hypothesis withα = .05, then what value cannot be inside the 95%
An independent-measures study with n = 12 in each treatment produces M = 34 with SS = 44 for the first treatment and M = 42 with SS = 66 for the second treatment. If the data are used to construct a 95% confidence interval for the population mean difference, then what value will be at the center of
An independent-measures study with n = 8 in each treatment produces M = 86 for the first treatment and M = 82 for the second treatment with a pooled variance of 16.What is Cohen’s d for these data?a. 0.25b. 0.50c. 1.00d. 2.00
Describe how the results of an independent-measures t test and measures of effect size are reported in the scientific literature.
Describe the relationship between a hypothesis test with an independent-measures t statistic using α = .05 and the corresponding 95% confidence interval for the mean difference.
Use the data from two separate samples to compute a confidence interval describing the size of the mean difference between two treatment conditions or two populations.
A researcher is using an Fmax test to evaluate the homogeneity of variance assumption and an independent-measures t test with pooled variance to evaluate the mean difference between two treatment conditions. What are the preferred outcomes for the two tests?a. Reject H0 for both.b. Fail to reject
A researcher study comparing performance for males and females predicts that females will have higher scores. If a one-tailed test is used to evaluate the results, then what is the correct statement for the alternative hypothesis (H1)?a. µfemales > µmalesb. µfemales ≥ µmalesc. µfemales <
A researcher obtains an independent-measures t statistic of t = 2.38 for a study comparing two treatments with a sample of n = 14 in each treatment. What is the correct decision for a regular two-tailed hypothesis test?a. Reject the null hypothesis with α = .05 but not with α = .01.b. Reject the
Use the data from two samples to conduct an independent-measures t test evaluating the significance of the difference between two population means.
One sample from an independent-measures study has n = 9 with a variance of s2 = 35.The other sample has n = 3 and s2 = 40.What is the df value for the t statistic?a. 36b. 12c. 11d. 10
One sample from an independent-measures study has n = 4 with SS = 100.The other sample has n = 8 and SS = 140.What is the pooled variance?a. 53.33b. 42.5c. 24d. 20
Which of the following is the correct null hypothesis for an independent-measures t test?a. M1 − M2 = 0b. M1 − M2 ≠ 0c. µ1 − µ2 = 0d. µ1 − µ2 ≠ 0
When the null hypothesis is true, what is measured by the estimated standard error in the denominator of the independent-measures t statistic?a. The standard distance between a sample mean and its population meanb. The standard distance between two sample means selected from the same populationc.
Calculate the estimated standard error for a sample mean difference, s(M1 2M2), including the pooled variance, which is part of the equation.
A repeated-measures study comparing two treatment conditions uses ___ group(s)of participants and obtains ___ score(s) for each participant.a. 1, 1b. 1, 2c. 2, 1d. 2, 2
Which of the following is an example of an independent-measures design?a. Comparing performance scores for 6-year-old boys and 6-year-old girls.b. Comparing depression scores before and after therapy.c. Measuring weekend wake-up times for a group of adolescents.d. Measuring smoking behavior
Which of the following describes an independent-measures research study?a. Two separate samples are used to obtain two groups of scores to represent the two populations or two treatment conditions being compared.b. The same group of participants is measured in two treatment conditions to obtain two
Define independent-measures designs and repeated-measures designs.
Research examining the effects of preschool childcare has found that children who spent time in day care, especially high-quality day care, perform better on math and language tests than children who stay home with their mothers (Broberg, Wessels, Lamb, &Hwang, 1997). In a typical study, a
Oishi and Schimmack (2010) report that people who move from home to home frequently as children tend to have lower than average levels of well-being as adults. To further examine this relationship, a psychologist obtains a sample of n = 12 young adults who each experienced 5 or more different homes
In the Preview for this Chapter, we discussed a study by McGee and Shevlin (2009) demonstrating that an individual’s sense of humor had a significant effect on how the individual was perceived by others. In one part of the study, female college students were given brief descriptions of a
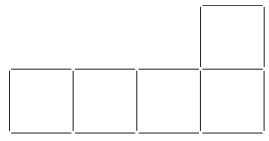
An example of the vertical-horizontal illusion is shown in the figure. Although the two lines are exactly the same length, the vertical line appears to be much longer. To examine the strength of this illusion, a researcher prepared an example in which both lines were exactly 10 inches long. The
A random sample is obtained from a population with a mean of μ = 45.After a treatment is administered to the individuals in the sample, the sample mean is M = 49 with a standard deviation of s = 12.a. Assuming that the sample consists of n = 9 scores, compute r2 and the estimated Cohen’s d to
A random sample of n = 16 scores is obtained from a population with a mean of μ = 45.After a treatment is administered to the individuals in the sample, the sample mean is found to be M = 49.2.a. Assuming that the sample standard deviation is s = 8, compute r2 and the estimated Cohen’s d to
Ackerman and Goldsmith (2011) found that students who studied text from printed hardcopy had better test scores than students who studied from text presented on a screen. In a related study, a professor noticed that several students in a large class had purchased the e-book version of the course
Weinstein, McDermott, and Roediger (2010) report that students who were given questions to be answered while studying new material had better scores when tested on the material compared to students who were simply given an opportunity to reread the material.In a similar study, an instructor in a
Standardized measures seem to indicate that the average level of anxiety has increased gradually over the past 50 years (Twenge, 2000). In the 1950s, the average score on the Child Manifest Anxiety Scale was μ = 15.1. A sample of n = 16 of today’s children produces a mean score of M = 23.3 with
Many animals, including humans, tend to avoid direct eye contact and even patterns that look like eyes.Some insects, including moths, have evolved eye-spot patterns on their wings to help ward off predators.Scaife (1976) reports a study examining how eye-spot patterns affect the behavior of birds.
The spotlight effect refers to overestimating the extent to which others notice your appearance or behavior, especially when you commit a social faux pas. Effectively, you feel as if you are suddenly standing in a spotlight with everyone looking. In one demonstration of this phenomenon, Gilovich,
To evaluate the effect of a treatment, a sample of n = 8 is obtained from a population with a mean of μ = 40, and the treatment is administered to the individuals in the sample. After treatment, the sample mean is found to be M = 35.a. If the sample variance is s2 = 32, are the data sufficient to
To evaluate the effect of a treatment, a sample is obtained from a population with a mean of μ = 30, and the treatment is administered to the individuals in the sample. After treatment, the sample mean is found to be M = 31.3 with a standard deviation of σ = 3.a. If the sample consists of n = 16
A random sample of n = 25 individuals is selected from a population with μ = 20, and a treatment is administered to each individual in the sample. After treatment, the sample mean is found to be M = 22.2 with SS = 384.a. How much difference is there between the mean for the treated sample and the
A random sample of n = 12 individuals is selected from a population with μ = 70, and a treatment is administered to each individual in the sample. After treatment, the sample mean is found to be M = 74.5 with SS = 297.a. How much difference is there between the mean for the treated sample and the
The following sample was obtained from a population with unknown parameters.Scores: 13, 7, 6, 12, 0, 4a. Compute the sample mean and standard deviation.(Note that these are descriptive values that summarize the sample data.)b. Compute the estimated standard error for M.(Note that this is an
The following sample of n = 4 scores was obtained from a population with unknown parameters.Scores: 2, 2, 6, 2a. Compute the sample mean and standard deviation.(Note that these are descriptive values that summarize the sample data.)b. Compute the estimated standard error for M.(Note that this is an
Find the t value that forms the boundary of the critical region in the right-hand tail for a one-tailed test withα = .01 for each of the following sample sizes.a. n = 10b. n = 20c. n = 30
Find the t values that form the boundaries of the critical region for a two-tailed test with α = .05 for each of the following sample sizes:a. n = 4b. n = 15c. n = 24
A sample of n = 16 scores has a mean of M = 56 and a standard deviation of s = 12.a. Explain what is measured by the sample standard deviation.b. Compute the estimated standard error for the sample mean and explain what is measured by the standard error.
A researcher rejects the null hypothesis with a regular two-tailed test using α = .05.If the researcher used a directional (one-tailed) test with the same data, then what decision would be made?a. Definitely reject the null hypothesis.b. Definitely reject the null hypothesis if the treatment
A researcher is conducting a directional (one-tailed) test with a sample of n = 25 to evaluate the effect of a treatment that is predicted to decrease scores.If the researcher obtains t = –1.700, then what decision should be made?a. The treatment has a significant effect with either α = .05 or
A researcher selects a sample of n = 16 individuals from a population with a mean of μ = 75 and administers a treatment to the sample. If the research predicts that the treatment will increase scores, then what is the correct statement of the null hypothesis for a directional (one-tailed) test?a.
The results of a hypothesis test are reported as follows: “t(20) = 2.70, p , .05.”Based on this report, how many individuals were in the sample?a. 19b. 20c. 21d. cannot be determined from the information provided
Which set of factors would produce the narrowest confidence interval for estimating a population mean?a. A large sample and a large percentage of confidenceb. A large sample and a small percentage of confidencec. A small sample and a large percentage of confidenced. A small sample and a small
What happens to measures of effect size such as r2 and Cohen’s d as sample size increases?a. They also tend to increase.b. They tend to decrease.c. Sample size does not have any great influence on measures of effect size.d. The effect of sample size depends on other factors such as sample
A researcher uses a sample of n = 10 to evaluate a treatment effect and obtains t = 3.00. If effect size is measured using the percentage of variance accounted for, then what value will be obtained for r2?a. 9 18 = 0.50b. 9 17 = 0.53c. 3 12 = 0.25d. 3 11 = 0.27
Explain how a confidence interval can be used to describe the size of a treatment effect and describe the factors that affect with width of a confidence interval.
Explain how measures of effect size for a t test are influenced by sample size and sample variance.
Calculate Cohen’s d or the percentage of variance accounted for (r 2) to measure effect size for a hypothesis test with a t statistic.
A sample is selected from a population and a treatment is administered to the sample. If there is a 2-point difference between the sample mean and the original population mean, which set of sample characteristics has the greatest likelihood of rejecting the null hypothesis?a. s2 = 12 for a sample
A sample is selected from a population with μ = 40, and a treatment is administered to the sample. If the sample variance is s2 = 96, which set of sample characteristics has the greatest likelihood of rejecting the null hypothesis?a. M = 37 for a sample of n = 16b. M = 37 for a sample of n = 64c.
If a t statistic is computed for a sample of n = 4 scores with SS = 300, then what are the sample variance and the estimated standard error for the sample mean?a. s2 = 10 and sM = 5b. s2 = 100 and sM = 20c. s2 = 10 and sM = 20d. s2 = 100 and sM = 5
Explain how the likelihood of rejecting the null hypothesis for a t test is influenced by sample size and sample variance.
How does the shape of the t distribution compare to a normal distribution?a. The t distribution is flatter and more spread out, especially when n is small.b. The t distribution is flatter and more spread out, especially when n is large.c. The t distribution is taller and less spread out, especially
Which of the following terms is not required when using the t statistic?a. nb. σc. dfd. s or s2 or SS
Which of the following is a fundamental difference between the t statistic and a z-score?a. The t statistic uses the sample mean in place of the population mean.b. The t statistic uses the sample variance in place of the population variance.c. The t statistic computes the standard error by dividing
Describe the circumstances in which a t statistic is used for hypothesis testing instead of a z-score and explain the fundamental difference between a t statistic and a z-score.
Explain how the power of a hypothesis test is influenced by each of the following. Assume that all other factors are held constant.a. Increasing the alpha level from .01 to .05.b. Changing from a one-tailed test to a two-tailed test.
Briefly explain how increasing sample size influences each of the following. Assume that all other factors are held constant.a. The size of the z-score in a hypothesis test.b. The size of Cohen’s d.c. The power of a hypothesis test.
Research has shown that IQ scores have been increasing for years (Flynn, 1984, 1999). The phenomenon is called the Flynn effect and the data indicate that the increase appears to average about 7 points per decade.To examine this effect, a researcher obtains an IQ test with instructions for scoring
A researcher plans to conduct an experiment evaluating the effect of a treatment. A sample of n = 9 participants is selected and each person receives the treatment before being tested on a standardized dexterity task. The treatment is expected to lower scores on the test by an average of 30 points.
A researcher is evaluating the influence of a treatment using a sample selected from a normally distributed population with a mean of μ = 40 and a standard deviation of σ = 12.The researcher expects a 6-point treatment effect and plans to use a two-tailed hypothesis test with α = .05.a. Compute
Researchers have noted a decline in cognitive functioning as people age (Bartus, 1990). However, the results from other research suggest that the antioxidants in foods such as blueberries can reduce and even reverse these age-related declines, at least in laboratory rats (Joseph et al., 1999).
A high school teacher has designed a new course intended to help students prepare for the mathematics section of the SAT. A sample of n = 20 students is recruited to for the course and, at the end of the year, each student takes the SAT. The average score for this sample is M = 562.For the general
Researchers at a National Weather Center in the northeastern United States recorded the number of 90° days each year since records first started in 1875. The numbers form a normal shaped distribution with a mean ofμ = 9.6 and a standard deviation of σ = 1.9.To see if the data showed any evidence
The researchers cited in the previous problem (Liguori and Robinson, 2001) also examined the effect of caffeine on response time in the driving simulator. In a similar study, researchers measured reaction time 30 minutes after participants consumed one 6-ounce cup of coffee. Using the same driving
In a study examining the effect of alcohol on reaction time, Liguori and Robinson (2001) found that even moderate alcohol consumption significantly slowed response time to an emergency situation in a driving simulation. In a similar study, researchers measured reaction time 30 minutes after
A random sample is selected from a normal population with a mean of μ = 100 and a standard deviation of σ = 20.After a treatment is administered to the individuals in the sample, the sample mean is found to be M = 96.a. How large a sample is necessary for this sample mean to be statistically
Brunt, Rhee, and Zhong (2008) surveyed 557 undergraduate college students to examine their weight status, health behaviors, and diet. Using body mass index (BMI), they classified the students into four categories: underweight, healthy weight, overweight, and obese. They also measured dietary
A random sample of n = 25 scores is selected from a normal population with a mean of μ = 40.After a treatment is administered to the individuals in the sample, the sample mean is found to be M = 44.a. If the population standard deviation is σ = 5, is the sample mean sufficient to conclude that
A random sample is selected from a normal population with a mean of μ = 30 and a standard deviation of σ = 8.After a treatment is administered to the individuals in the sample, the sample mean is found to be M = 33.a. If the sample consists of n = 16 scores, is the sample mean sufficient to
The psychology department is gradually changing its curriculum by increasing the number of online course offerings. To evaluate the effectiveness of this change, a random sample of n = 36 students who registered for Introductory Psychology is placed in the online version of the course. At the end
Childhood participation in sports, cultural groups, and youth groups appears to be related to improved self-esteem for adolescents (McGee, Williams, Howden-Chapman, Martin, & Kawachi, 2006). In a representative study, a sample of n = 100 adolescents with a history of group participation is given a
Babcock and Marks (2010) reviewed survey data from 2003–2005, and obtained an average of μ = 14 hours per week spent studying by full-time students at 4-year colleges in the United States. To determine whether this average has changed in the past 10 years, researcher selected a sample of n = 64
Although there is a popular belief that herbal remedies such as Ginkgo biloba and Ginseng may improve learning and memory in healthy adults, these effects are usually not supported by wellcontrolled research (Persson, Bringlov, Nilsson, and Nyberg, 2004). In a typical study, a researcher obtains a
Showing 200 - 300
of 5401
1
2
3
4
5
6
7
8
9
10
11
12
13
14
15
Last
Step by Step Answers