New Semester
Started
Get
50% OFF
Study Help!
--h --m --s
Claim Now
Question Answers
Textbooks
Find textbooks, questions and answers
Oops, something went wrong!
Change your search query and then try again
S
Books
FREE
Study Help
Expert Questions
Accounting
General Management
Mathematics
Finance
Organizational Behaviour
Law
Physics
Operating System
Management Leadership
Sociology
Programming
Marketing
Database
Computer Network
Economics
Textbooks Solutions
Accounting
Managerial Accounting
Management Leadership
Cost Accounting
Statistics
Business Law
Corporate Finance
Finance
Economics
Auditing
Tutors
Online Tutors
Find a Tutor
Hire a Tutor
Become a Tutor
AI Tutor
AI Study Planner
NEW
Sell Books
Search
Search
Sign In
Register
study help
business
statistics for experimentert
Statistics For The Behavioral Sciences 10th Edition Frederick J Gravetter, Larry B. Wallnau - Solutions
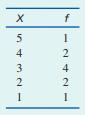
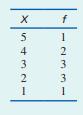
Which of the following values is the most reasonable estimate of the standard deviation for the set of scores in the following distribution? (It may help to imagine or sketch a histogram of the distribution.)a. 0b. 1c. 3d. 5 X f 5 4 242 +32 1 I
What is the variance for the following set of scores? 2, 2, 2, 2, 2a. 0b. 2c. 4d. 5
Standard deviation is probably the most commonly used value to describe and measure variability. Which of the following accurately describes the concept of standard deviation?a. the average distance between one score and anotherb. the average distance between a score and the meanc. the total
Define variance and standard deviation and describe what is measured by each.
How many scores in the distribution are used to compute the range?a. only 1b. 2c. 50% of themd. all of the scores
What is the range for the following set of scores? 3, 7, 9, 10, 12a. 3 pointsb. 4 or 5 pointsc. 9 or 10 pointsd. 12 points
Which of the following sets of scores has the greatest variability?a. 2, 3, 7, 12b. 13, 15, 16, 17c. 24, 25, 26, 27d. 42, 44, 45, 46
Define and calculate the range as a simple measure of variability and explain its limitations
Define variability and explain its use and importance as a statistical measure.
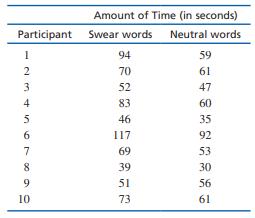
Stephens, Atkins, and Kingston (2009) conducted a research study demonstrating that swearing can help reduce pain. In the study, each participant was asked to plunge a hand into icy water and keep it there as long as the pain would allow. In one condition, the participants repeatedly yelled their
Schmidt (1994) conducted a series of experiments examining the effects of humor on memory. In one study, participants were shown a list of sentences, of which half were humorous and half were nonhumorous. A humorous example is, “If at first you don’t succeed, you are probably not related to the
A researcher conducts a study comparing two different treatments with a sample of n = 16 participants in each treatment. The study produced the following data:Treatment 1: 6, 7, 11, 4, 19, 17, 2, 5, 9, 13, 6, 23, 11, 4, 6, 1 Treatment 2: 10, 9, 6, 6, 1, 11, 8, 6, 3, 2, 11, 1, 12, 7, 10, 9a.
Explain why the median is often preferred to the mean as a measure of central tendency for a skewed distribution.
A population of N = 8 scores has a mean of μ = 16.After one score is removed from the population, the new mean is found to be μ = 15.What is the value of the score that was removed? (Hint: Compare the values for SX before and after the score was removed.)
A sample of n = 7 scores has a mean of M = 5.After one new score is added to the sample, the new mean is found to be M = 6.What is the value of the new score? (Hint: Compare the values for SX before and after the score was added.)
A sample of n = 7 scores has a mean of M = 16.One score in the sample is changed from X 5 6 to X = 20.What is the value for the new sample mean?
A population of N = 15 scores has a mean of μ = 8.One score in the population is changed from X = 20 to X = 5.What is the value for the new population mean?
A population with a mean of μ = 8 has SX = 40.How many scores are in the population?
A sample of n = 8 scores has a mean of M = 12.What is the value of SX for this sample?
A population of N = 15 scores has SX = 120.What is the population mean?
For the following sample of n 5 10 scores:a. Assume that the scores are measurements of a discrete variable and find the median.b. Assume that the scores are measurements of a continuous variable and find the median by locating the precise midpoint of the distribution.Scores: 2, 3, 4, 4, 5, 5, 5,
Find the mean, median, and mode for the scores in the following frequency distribution table:X f 8 1 7 1 6 2 5 5 4 2 3 2
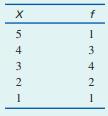
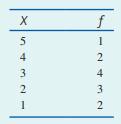
Find the mean, median, and mode for the scores in the following frequency distribution table:X F 6 1 5 2 4 2 3 2 2 2 1 5
Find the mean, median, and mode for the following sample of scores:3, 6, 7, 3, 9, 8, 3, 7, 5
Find the mean, median, and mode for the following sample of scores:5, 4, 5, 2, 7, 1, 3, 5
Although the three measures of central tendency appear to be very simple to calculate, there is always a chance for errors. The most common sources of error are listed next.a. Many students find it very difficult to compute the mean for data presented in a frequency distribution table. They tend to
A distribution is positively skewed. Which is the most probable order for the three measures of central tendency?a. mean = 40, median = 50, mode = 60b. mean = 60, median = 50, mode = 40c. mean = 40, median = 60, mode = 50d. mean = 50, median = 50, mode = 50
For a negatively skewed distribution with a mode of X = 25 and a median of 20, the mean is probably _____.a. greater than 25b. less than 20c. between 20 and 25d. cannot be determined from the information given
Which of the following is true for a symmetrical distribution?a. the mean, median, and mode are all equalb. mean = medianc. mean = moded. median = mode
Explain how the three measures of central tendency—mean, median, and mode—are related to each other for symmetrical and skewed distributions.
The value of one score in a distribution is changed from X = 20 to X = 30.Which measure(s) of central tendency is (are) certain to be changed?a. The meanb. The medianc. The mean and the mediand. The mode
One item on a questionnaire asks, “How many siblings (brothers and sisters) did you have when you were a child?” A researcher computes the mean, the median, and the mode for a set of n 5 50 responses to this question. Which of the following statements accurately describes the measures of
A teacher gave a reading test to a class of 5th-grade students and computed the mean, median, and mode for the test scores. Which of the following statements cannot be an accurate description of the scores?a. The majority of the students had scores above the mean.b. The majority of the students had
Explain when each of the three measures of central tendency—mean, median, and mode—should be used, identify the advantages and disadvantages of each, and describe how each is presented in a report of research results.
For the sample shown in the frequency distribution table, what is the mode?a. 3b. 3.5c. 4d. 5 X 5 4 3 2 f 1342 1 1
What is the mode for the following set of n 5 8 scores? Scores: 0, 1, 1, 2, 2, 2, 2, 3a. 2b. 2.5c. 13 8 = 1.625d. 13
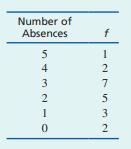
During the month of October, an instructor recorded the number of absences for each student in a class of n 5 20 and obtained the following distribution.What are the values for the mean, the median, and the mode for this distribution?a. Mean = 2.35, Median = 2.5, Mode = 3b. Mean = 2.5, Median = 3,
Define and identify the mode(s) for a distribution, including the major and minor modes for a binomial distribution.
Define and calculate the median, and find the precise median for a continuous variable.
After 5 points are added to every score in a distribution, the mean is calculated and found to be μ = 30.What was the value of the mean for the original distribution?a. 25b. 30c. 35d. Cannot be determined from the information given
What is the mean for the population of scores shown in the frequency distribution table?a. 15 10 = 1.5b. 15 5 = 3.0c. 29 10 = 2.9d. 29 5 = 5.8 X f 5 1 +32- 4 233 1 1
One sample has n = 8 scores and M = 2.A second sample has n = 4 scores and M = 8.If the two samples are combined, then what is the mean for the combined sample?a. 3b. 4c. 5d. 6
A sample has a mean of M = 45.If one person with a score of X = 53 is removed from the sample, what effect will it have on the sample mean?a. The sample mean will increase.b. The sample mean will decrease.c. The sample mean will remain the same.d. Cannot be determined from the information given
What is the mean for the following sample of scores?Scores: 1, 2, 5, 4a. 12b. 6c. 4d. 3
Describe how the mean is affected by each of the following: changing a score, adding or removing a score, adding or subtracting a constant from each score, and multiplying or dividing each score by a constant.
Use a stem and leaf display to organize the following distribution of scores. Use six stems with each stem corresponding to a 10-point interval.Scores:36, 47, 14, 19, 65 52, 47, 42, 11, 25 28, 39, 32, 34, 58 57, 22, 49, 22, 16 33, 37, 23, 55, 44
A set of scores has been organized into the following stem and leaf display. For this set of scores:a. How many scores are in the 70s?b. Identify the individual scores in the 70s.c. How many scores are in the 40s?d. Identify the individual scores in the 40s.4 8 5 421 6 3824 7 592374 8 24316 9 275
Construct a stem and leaf display for the data in problem 5 using one stem for the scores in the 50s, one for scores in the 40s, and so on.
The following table shows four rows from a frequency distribution table for a sample of n = 20 scores. Use interpolation to find the percentiles and percentile ranks requested:X f Cf C%40–49 4 20 100 30–39 7 16 80 20–29 4 9 45 10–19 3 5 25a. Find the 30th percentile.b. Find the 52nd
The following table shows four rows from a frequency distribution table for a sample of n = 50 scores. Use interpolation to find the percentiles and percentile ranks requested:X f cf c%15–19 3 50 100 10–14 6 47 94 5–9 8 41 82 0–4 18 33 66a. What is the percentile rank for X = 17?b. What is
The following table shows four rows from a frequency distribution table for a sample of n = 50 scores. Use interpolation to find the percentiles and percentile ranks requested:X f cf c%15 5 32 64 14 8 27 54 13 6 19 38 12 4 13 26a. What is the percentile rank for X = 13?b. What is the percentile
The following table shows four rows from a frequency distribution table for a sample of n = 25 scores. Use interpolation to find the percentiles and percentile ranks requested:X f cf c%8 3 18 72 7 6 15 60 6 5 9 36 5 2 4 16a. What is the percentile rank for X = 6?b. What is the percentile rank for X
Complete the final two columns in the following frequency distribution table and then find the percentiles and percentile ranks requested:X f cf c%25–29 1 20–24 4 15–19 8 10–14 7 5–9 3 0–4 2a. What is the percentile rank for X = 9.5?b. What is the percentile rank for X = 19.5?c. What is
Complete the final two columns in the following frequency distribution table and then find the percentiles and percentile ranks requested:X f cf c%5 2 4 5 3 6 2 4 1 3a. What is the percentile rank for X = 2.5?b. What is the percentile rank for X = 4.5?c. What is the 15th percentile?d. What is the
For the following set of scores:8, 6, 7, 5, 4, 10, 8, 9, 5, 7, 2, 9 9, 10, 7, 8, 8, 7, 4, 6, 3, 8, 9, 6a. Construct a frequency distribution table.b. Sketch a histogram showing the distribution.c. Describe the distribution using the following characteristics:(1) What is the shape of the
Place the following scores in a frequency distribution table. Based on the frequencies, what is the shape of the distribution?13, 14, 12, 15, 15, 14, 15, 11, 13, 14 11, 13, 15, 12, 14, 14, 10, 14, 13, 15
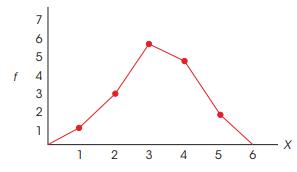
Find each of the following values for the distribution shown in the following polygon.a. nb. ΣXc. ΣX2 7 6 5 f 4 3 2 21 1 2 2 3 4 5 6 X
Gaucher, Friesen, and Kay (2010) found that masculinethemed words (such as competitive, independent, analyze, strong) are commonly used in job recruitment materials, especially for job advertisements in male-dominated areas. In a similar study, a researcher counted the number of masculine-themed
A survey given to a sample of college students contained questions about the following variables. For each variable, identify the kind of graph that should be used to display the distribution of scores (histogram, polygon, or bar graph).a. Number of brothers and sistersb. Birth-order position among
For the following set of scores:8, 5, 9, 6, 8, 7, 4, 10, 6, 7 9, 7, 9, 9, 5, 8, 8, 6, 7, 10a. Construct a frequency distribution table to organize the scores.b. Draw a frequency distribution histogram for these data.
For each of the following samples, determine the interval width that is most appropriate for a grouped frequency distribution and identify the approximate number of intervals needed to cover the range of scores.a. Sample scores range from X = 8 to X = 41b. Sample scores range from X = 16 to X =
The following scores are the ages for a random sample of n = 30 drivers who were issued speeding tickets in New York during 2008. Determine the best interval width and place the scores in a grouped frequency distribution table. From looking at your table, does it appear that tickets are issued
For the following scores, the smallest value is X = 13 and the largest value is X = 52.Place the scores in a grouped frequency distribution table,a. Using an interval width of 5 points.b. Using an interval width of 10 points.44, 19, 23, 17, 25, 47, 32, 26 25, 30, 18, 24, 49, 51, 24, 13 43, 27, 34,
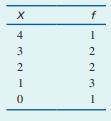
Find each value requested for the distribution of scores in the following table.a. nb. ΣXc. ΣX2 X f 6 1 5 2 4 2 3 4 2 3 1 2
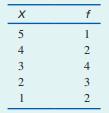
Find each value requested for the distribution of scores in the following table.a. nb. ΣXc. ΣX2 X f 5 1 4 3 3 4 2 5 1 2
Construct a frequency distribution table for the following set of scores. Include columns for proportion and percentage in your table.Scores: 2, 7, 5, 3, 2, 9, 6, 1, 1, 2 3, 3, 2, 4, 5, 2, 5, 4, 6, 5
Place the following set of n = 20 scores in a frequency distribution table.6, 2, 2, 1, 3, 2, 4, 7, 1, 2 5, 3, 1, 6, 2, 6, 3, 3, 7, 2
Percentiles and percentile ranks are intended to identify specific locations within a distribution of scores. When solving percentile problems, especially with interpolation, it is helpful to sketch a frequency distribution graph. Use the graph to make a preliminary estimate of the answer before
When constructing or working with a grouped frequency distribution table, a common mistake is to calculate the interval width by using the highest and lowest values that define each interval. For example, some students are tricked into thinking that an interval identified as 20–24 is only 4
Describe the basic elements of a stem and leaf display and explain how the display shows the entire distribution of scores.
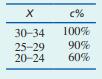
Following are three rows from a frequency distribution table. Using interpolation, what is the percentile rank for X = 18?a. 52.5%b. 30%c. 29%d. 25% X c% 20-24 60% 15-19 35% 10-14 15%
Following are three rows from a frequency distribution table. For this distribution, what is the 90th percentile?a. X = 24.5b. X = 25c. X = 29d. X = 29.5 X c% 30-34 100% 25-29 90% 20-24 60%
In a distribution of exam scores, which of the following would be the highest score?a. the 20th percentileb. the 80th percentilec. a score with a percentile rank of 15%d. a score with a percentile rank of 75%
Estimate percentiles and percentile ranks using interpolation for values that do not correspond to real limits in a frequency distribution table.
Determine percentiles and percentile ranks for values corresponding to real limits in a frequency distribution table.
Define percentiles and percentile ranks.
A set of scores is presented in a frequency distribution histogram. If the histogram shows a series of bars that tend to decrease in height from left to right, then what is the shape of the distribution?a. symmetricalb. positively skewedc. negatively skewedd. normal
If a frequency distribution graph is drawn as a smooth curve, it is probably showing a ______ distribution.a. sampleb. populationc. skewedd. symmetrical
A group of quiz scores ranging from 4–9 are shown in a histogram. If the bars in the histogram gradually increase in height from left to right, what can you conclude about the set of quiz scores?a. There are more high scores than there are low scores.b. There are more low scores than there are
The seminar rooms in the library are identified by letters (A, B, C, and so on). A professor records the number of classes held in each room during the fall semester.If these values are presented in a frequency distribution graph, what kind of graph would be appropriate?a. a histogramb. a polygonc.
Identify the shape—symmetrical, and positively or negatively skewed—of a distribution in a frequency distribution graph.
Describe the basic elements of a frequency distribution graph and explain how they are related to the original set of scores.
A set of scores ranges from a high of X = 48 to a low of X = 13.If these scores are placed in a grouped frequency distribution table with an interval width of 5 points, the bottom interval in the table would be _______.a. 13–18b. 13–19c. 10–14d. 10–15
In a grouped frequency distribution one interval is listed as 20–24. Assuming that the scores are measuring a continuous variable, what is the width of this interval?a. 3 pointsb. 4 pointsc. 5 pointsd. 54 points
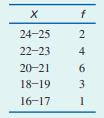
For this distribution, how many individuals had scores lower than X = 20?a. 2b. 3c. 4d. cannot be determined X f 24-25 2 22-23 4 20-21 6 18-19 3 16-17 1
Identify when it is useful to set up a grouped frequency distribution table, and explain how to construct this type of table for a set of scores.
For the following frequency distribution, what is ΣX2?a. 30b. 45c. 77d. (17)2 = 289 x43210 f 1 3 WNN. 1
The following is a distribution of quiz scores. If a score of X = 2 or lower is failing, then how many individuals failed the quiz?a. 2b. 3c. 5d. 9 X f 1 2432 5432 I
For the following frequency distribution, how many individuals had a score of X = 2?a. 1b. 2c. 3d. 4 X f 5 1 4 2 3 4 2 1 32
Calculate the following from a frequency table: ΣX, ΣX2, and the proportion and percentage of the group associated with each score.
Describe the basic elements of a frequency distribution table and explain how they are related to the original set of scores.
Use summation notation to express each of the following calculations:a. Add the scores and then add then square the sum.b. Square each score and then add the squared values.c. Subtract 2 points from each score and then add the resulting values.d. Subtract 1 point from each score and square the
Explain why honesty is a hypothetical construct instead of a concrete variable. Describe how shyness might be measured and defined using an operational definition.
Knight and Haslam (2010) found that office workers who had some input into the design of their office space were more productive and had higher well-being compared to workers for whom the office design was completely controlled by an office manager. For this study, identify the independent variable
A tax form asks people to identify their annual income, number of dependents, and social security number. For each of these three variables, identify the scale of measurement that probably is used and identify whether the variable is continuous or discrete.
In an experiment examining the effects Tai Chi on arthritis pain, Callahan (2010) selected a large sample of individuals with doctor-diagnosed arthritis. Half of the participants immediately began a Tai Chi course and the other half (the control group) waited 8 weeks before beginning. At the end of
A research study reports that alcohol consumption is significantly higher for students at a state university than for students at a religious college (Wells, 2010).Is this study an example of an experiment? Explain why or why not.
Gentile, Lynch, Linder, and Walsh (2004) surveyed over 600 8th- and 9th-grade students asking about their gaming habits and other behaviors. Their results showed that the adolescents who experienced more video game violence were also more hostile and had more frequent arguments with teachers. Is
The results of a recent study showed that children who routinely drank reduced fat milk (1% or skim)were more likely to be overweight or obese at age 2 and age 4 compared to children who drank whole or 2% milk (Scharf, Demmer, and DeBoer, 2013). Is this an example of an experimental or a
What is the first step in the calculation of (ΣX)2?a. Square each score.b. Add the scores.c. Subtract 2 points from each score.d. Add the X – 2 values.
Showing 500 - 600
of 5401
1
2
3
4
5
6
7
8
9
10
11
12
13
14
15
Last
Step by Step Answers