New Semester
Started
Get
50% OFF
Study Help!
--h --m --s
Claim Now
Question Answers
Textbooks
Find textbooks, questions and answers
Oops, something went wrong!
Change your search query and then try again
S
Books
FREE
Study Help
Expert Questions
Accounting
General Management
Mathematics
Finance
Organizational Behaviour
Law
Physics
Operating System
Management Leadership
Sociology
Programming
Marketing
Database
Computer Network
Economics
Textbooks Solutions
Accounting
Managerial Accounting
Management Leadership
Cost Accounting
Statistics
Business Law
Corporate Finance
Finance
Economics
Auditing
Tutors
Online Tutors
Find a Tutor
Hire a Tutor
Become a Tutor
AI Tutor
AI Study Planner
NEW
Sell Books
Search
Search
Sign In
Register
study help
business
statistics for experimentert
Statistics Without Maths For Psychology 5th Edition Christine Dancey - Solutions
The Wilcoxon matched-pairs signed ranks test can be used when:(a) There are two conditions(b) The same participants take part in both conditions(c) There is at least ordinal-level data(d) All of the above
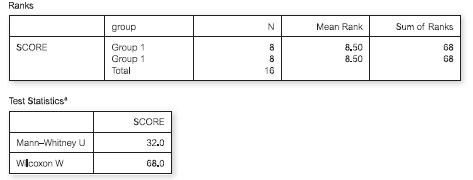
Look at the following partial printout of a Mann–Whitney U analysis from SPSS:The above information suggests that:(a) There will be a statistically signifi cant difference between conditions (b) There will not be a statistically signifi cant difference between conditions (c) The results are
To assess the difference in scores from two conditions of a between-participants design, with ranked data, you would use:(a) The independent t-test(b) The Wilcoxon(c) The Related t-test(d) Mann–Whitney
The Wilcoxon matched pairs signed-ranks test (the Wilcoxon) is appropriate for:(a) Within-participants designs(b) Between-participants designs(c) Matched-participants designs(d) Both (a) and (c) above
Are there any univariate differences present?(a) Yes, for anxiety only(b) Yes, for depression only(c) Yes, for anxiety and depression(d) There are no univariate differences present
Which of the following would you report in a write-up?(a) Pillai’s trace = 0.497(b) Wilks’ lambda = 0.503(c) Hotelling’s trace = 0.989(d) Roy’s largest root = 0.989
Is there a multivariate difference between the conditions of the IV?(a) Yes(b) No(c) Can’t tell from the above printout(d) Yes but none of the DVs individually contribute signifi cantly to the multivariate difference
How many conditions are there in the IV?(a) 1(b) 2(c) 3(d) 4
What are the DVs in this study?(a) Condition and intercept(b) Anxiety and depression(c) Greenhouse and Geisser(d) None of the above
If you have correlated DVs, which of the following are applicable?(a) You should use t-tests to examine the contribution of the individual DVs to the linear combination of the DVs(b) You should not use t-tests to examine the contribution of the individual DVs to the linear combination of the DVs(c)
Which part of the MANOVA printout gives us information about differences between the conditions of the IVs in terms of the linear combination of the DVs?(a) The Box’s M tests(b) The univariate F-statistics(c) The multivariate F-statistics(d) All of the above
Which of the following are assumptions underlying the use of multivariate statistics?(a) Homogeneity of variance–covariance matrices(b) That we have equal sample sizes(c) That we have nominal-level data(d) None of the above
Which of the following are linear combinations?(a) A + B + C + D(b) b1x1 + b2x2 + b3x3 . . . + a(c) The Lottery numbers(d) Both (a) and (b) above
The assumption of multivariate normality means that:(a) Only the DVs should be normally distributed(b) All DVs and all IVs should be normally distributed(c) All DVs and all possible linear combinations of the DVs should be normally distributed(d) All of the above
Which of the following are true of MANOVA?(a) It forms a linear combination of the IVs(b) It forms a linear combination of the DVs(c) It is an extension of c2(d) It correlates the IVs with all of the DVs
If we had three DVs and found a multivariate difference, what level of a would we set for each t-test to keep the overall a at 5%?(a) 5%(b) 1%(c) 1.67%(d) 3.33%
For uncorrelated DVs, how do we examine the relative contributions of the individual DVs to the combined DVs when our IV has only two conditions?(a) Conduct separate t-tests and adjust a to keep down the familywise error rate(b) Look at the multivariate effect size of the combined DVs(c) Check that
If you have correlated DVs in a MANOVA with a two-group IV, you should:(a) Cry(b) Conduct t-test analyses of the single DVs(c) Conduct c2 analyses of the DVs followed by t-tests(d) None of the above
Box’s M test:(a) Is a test of the homogeneity of variance assumption underlying ANOVA(b) Should be ignored at all times(c) Is a test of the homogeneity of variance–covariance matrices(d) Is applicable only for split-plot designs
Which of the following are multivariate methods of calculating F?(a) Wilks’ lambda(b) Pillai’s trace(c) Hotelling’s trace(d) All of the above
Which of the following is true of MANOVA?(a) It analyses multiple IVs only(b) It analyses multiple DVs with one or more IVs(c) It can be used only with categorical data(d) All of the above
What is the most appropriate conclusion to be drawn from the above printout?(a) There is a multivariate difference, not attributable to sampling error, between males and females(b) Writing skills but not comprehension contributes to the difference in the combined DVs(c) The assumption of
What is the value of Wilks’ lambda?(a) 9(b) 0.574(c) 0.742(d) None of the above
What is the value of Box’s M?(a) 8.49(b) 58320(c) 0.058(d) 3
It is possible to extract:(a) As many factors as variables(b) More factors than variables(c) More variables than factors(d) None of the above
A scree plot is a number of:(a) Variables plotted against variance accounted for(b) Variables plotted against factor loadings(c) Factors plotted against correlation coeffi cients(d) None of the above
The original unrotated matrix is usually rotated so that:(a) The factors are more signifi cant(b) The mathematical calculations are easier(c) Interpretation is easier(d) All of these
The decision on how many factors to keep is decided on:(a) Statistical criteria(b) Theoretical criteria(c) Both (a) and (b)(d) Neither (a) nor (b)
Using the correlational matrix to perform factor analysis rather than the variance–covariance matrix ensures that the data:(a) Will be statistically signifi cant(b) Are standardised(c) Are unstandardised(d) None of these
Factor analysis requires that variables:(a) Are not related to each other(b) Are related to each other(c) Have only a weak relationship with each other(d) Are measured in the same units
Factor analysis deals with:(a) Patterns of correlations(b) Patterns of mean values(c) Frequency counts(d) None of the above
A vector is:(a) A curved line with an indefi nite length(b) A straight line with an indefi nite length(c) A straight line with a defi nite length(d) A curved line with a defi nite length
Look at the following diagram.These variables are:(a) Perfectly related to each other (b) Totally unrelated to each other (c) Share a moderate correlation with each other (d) None of the above applies Variable 1 Variable 2
A factor is thought of as an underlying latent variable:(a) That is infl uenced by observed variables(b) That is unexplained by unobserved variables(c) Along which individuals differ(d) Along which individuals are homogeneous
The differences between factor analysis and principal components analysis are relatively unimportant when the dataset is:(a) Large and the participant numbers are high(b) Large and the participant numbers are low(c) Small and the participant numbers are high(d) Small and the participant numbers are
In order to name factors that have been extracted, researchers look at:(a) The rotated factor loadings(b) The unrotated factor loadings(c) The table of eigenvalues(d) None of the above
The group with the widest confi dence interval around the mean level of verbal ability is:(a) Group 1(b) Group 2(c) Group 3(d) They are all identical
The strongest difference between the groups is between:(a) 1 + 2 versus 3(b) 2 + 3 versus 1(c) 1 + 3 versus 2(d) They are all identical
The effect size for the differences between the groups is approximately:(a) 2%(b) 12%(c) 21%(d) 70%
Which is the most appropriate statement? The differences between the groups are:(a) Likely to have arisen by sampling error alone F(1,65) = 150.46, p < 0.001(b) Likely to have arisen by sampling error alone F(1,65) = 1.22, p < 0.273(c) Unlikely to have arisen by sampling error alone F(2,65) = 4.29,
The highest level of verbal ability is shown by:(a) Group 1(b) Group 2(c) Group 3(d) They are all identical
Using difference scores in a pretest–posttest design does not partial out the effect of the pretest for the following reason:(a) The pretest scores are not normally correlated with the posttest scores(b) The pretest scores are normally correlated with the difference scores(c) The posttest scores
The dependent variable is:(a) Reaction time(b) Group(c) Age(d) None of the above
The covariate is:(a) Reaction time(b) Group(c) Age(d) None of the above
The independent variable is:(a) Reaction time(b) Group(c) Age(g) None of the above
His analysis would show:(a) Differences between groups on the memory test, partialling out the effects of IQ(b) Differences on IQ, partialling out the effects of IQ(c) Differences on IQ, partialling out the effects of alcohol(d) Differences between groups on the memory test, partialling out the
Which is the covariate?(a) Scores on the memory test(b) The amounts of alcohol(c) IQ(d) None of the above
When carrying out a pretest–posttest study, researchers often wish to:(a) Partial out the effect of the dependent variable(b) Partial out the effect of the pretest(c) Reduce the correlation between the pretest and posttest scores(d) None of the above
You can perform ANCOVA on:(a) Two groups(b) Three groups(c) Four groups(d) All of the above
Four groups have the following means on the covariate: 35, 42, 28, 65.What is the grand mean?(a) 43.5(b) 42.5(c) 56.7(d) None of the above
The difference between the groups is:(a) Unlikely to have occurred by sampling error, assuming the null hypothesis to be true (F(2,470)= 387.806; p < 0.001)(b) Unlikely to have occurred by sampling error, assuming the null hypothesis to be true (F(2,470)= 14.565; p < 0.001)(c) Likely to have
The covariate is:(a) Beginning Salary(b) PREVEXP(c) JOBCAT(d) None of the above
The dependent variable is:(a) Beginning Salary(b) PREVEXP(c) JOBCAT(d) None of the above
The use of ANCOVA is sometimes controversial when:(a) Randomly allocating participants to conditions(b) Assumptions have not been met(c) Using intact groups(d) (b) and (c)
ANCOVA adjusts the means on the covariate, so that the mean covariate score is:(a) The same for all groups(b) Different for all groups(c) The same for all participants(d) It depends
ANCOVA shows us how likely it is that differences between conditions are due to sampling error, once means have been adjusted for the relationship between:(a) The dependent variable and the covariate(b) The independent variable and the covariate(c) The dependent variable and the independent
Which is the most appropriate statement?(a) As stress increased by 1 standard deviation, blood pressure increased by nearly half a standard deviation(b) As stress increased by 1 standard deviation, age increased by 0.18 of a standard deviation.(c) As age increased by 1 year, blood pressure fell by
Which is the most appropriate statement? The explanatory variables predicted(a) 6.5% of the variation in blood pressure(b) 42% of the variation in blood pressure(c) 6.5% of the variation in stress(d) 18% of the variation in age
Saeeda doesn’t know about the necessity for large participant numbers in multiple regression. She’s only got 20 participants in her study, and she has 10 explanatory variables. Which is the most appropriate statement? Compared with an analysis using 100 participants, Multiple R will be:(a)
Kieran wants to perform a standard multiple regression using six explanatory variables. He is only interested in the overall R2. According to Tabachnick and Fidell’s formula, how many participants should he recruit?(a) 98(b) 56(c) 240(d) 120
Multicollinearity means:(a) There are high intercorrelations among the predictor variables(b) The predictor variables are positively correlated with the criterion variable(c) The variables show a skewed distribution(d) The variables show a peaked distribution
a is:(a) 0.514(b) 0.790(c) 0.276(d) 0.571
The slope of the line (b) for previous history rating is:(a) 0.514(b) 0.790(c) 0.276(d) 0.571
The achieved signifi cance level associated with the F-value of 18.182 is:(a) 0.824(b) 0.36(c)
The predictor variables are called:(a) Credit rating and age(b) Credit rating and previous history rating(c) Previous history and age(d) The criterion variables
For every 1 standard deviation rise in previous history rating, credit rating:(a) Decreases by 0.5 of a standard deviation(b) Increases by 0.5 of a standard deviation(c) Decreases by 0.3 of a standard deviation(d) Increases by 0.3 of a standard deviation
The correlation between credit rating and the other variables is:(a) 0.867(b) 0.752(c) 0.711(d) 1.32
Psychologists use regression mainly to:(a) Assess relationships between variables(b) Use the regression formula for further research(c) Look at differences between groups(d) None of the above
How many degrees of freedom would you have where the linear regression scatterplot had only ONE datapoint? (very unrealistic we know . . . )(a) Zero(b) One(c) Two(d) Three
a is:(a) 1.75772(b) 1.5455(c) 4.19978(d) 0.01659
b is:(a) 2.049(b) 0.31928(c) 0.01659(d) None of these
The exact probability value of the results having occurred by sampling error, assuming the null hypothesis to be true, is:(a) 0.0000(b) 0.05(c) 4.19978(d) 0.048
Marks on MRL would be called:(a) The predictor variable(b) The criterion variable(c) The covariate(d) The constant
In a linear regression analysis, the residuals are:(a) Actual scores minus the predicted scores(b) Actual scores plus the predicted scores(c) The correlation between the actual and predicted scores(d) None of the above
In linear regression, where only one variable predicts y, and F is statistically signifi cant at p = 0.049, then:(a) The value of p for t = 0.049(b) The value of p for t = 0.0245(c) The value of p for t = 0.098(d) Cannot tell
The line of best fi t:(a) Minimises the distance between the scores and the regression line(b) Is the best of all possible lines(c) Maximises the correlation between x and y(d) All of these
If you have a 2 × 2 between-participants design, what should be the fi rst step before generating descriptive statistics in SPSS?(a) Transform your data(b) Split the datafi le(c) Conduct t-tests(d) Conduct correlational analyses
How many effects are we comparing against their respective null hypotheses in a 2 × 2 × 2 ANOVA?(a) 3(b) 5(c) 7(d) 8
If you had a completely within-participants design, with each IV having two conditions, how would you examine the simple effects?(a) With independent t-tests, being careful to select the correct participants using the Split File command in SPSS(b) With independent t-tests, taking care to adjust the
If you had an MS for your main effect of 12.4 and an MS for the error term of 3.1, what would your F-value be?(a) 6.2(b) 4.1(c) 3.1(d) 4
What is the defi nition of a simple effect?(a) The effect of one variable on another(b) The difference between two conditions of one IV at one level of another IV(c) The easiest way to get a signifi cant result(d) All of the above
Partial h2 is:(a) A measure of the power of your analyses(b) Equal to h2(c) Usually much greater than h2(d) A measure of magnitude of effect
What are the sources of variance in a completely within-participants design with two IVs?(a) Main effect of IV1 plus error, main effect of IV2 plus the error, interaction between IV1 and IV2 plus error(b) Main effects of IV1, IV2 and the interaction between these two plus the error(c) Main effects
How would you describe a 2 × 3 × 5 × 7 × 7 ANOVA?(a) Sensible(b) An ANOVA with two variables with three conditions, fi ve variables with seven conditions and seven variables with one condition(c) An ANOVA with one variable with two conditions, one variable with three conditions, one variable
The Mauchley sphericity test is:(a) A test of the assumption that the standard errors of the difference between means of the withinparticipants variables are equal(b) A test that the data used in ANOVA are rounded in nature(c) A well-known test developed at a well-known London psychiatric
How many effects are we comparing against their respective null hypotheses in a 2 × 2 ANOVA?(a) 1(b) 2(c) 3(d) 4
Look at the following error bar chart. What would be the sensible conclusion?(a) That there are main effects of the two IVs and an interaction, which are probably not attributable to sampling error (b) That there are no main effects or interactions (c) That there is only one main effect (d) That
How much variation in driving errors is accounted for by the interaction between CARBUS and AREA?(a) 93%(b) 5.2%(c) 60.7%(d) 65.9%
How is the F-value for the interaction calculated?(a) 4.900 ÷ 12.100(b) 12.100 ÷ 67.600(c) 67.600 ÷ 1.217(d) None of the above
What is the p-value for the main effect of CARBUS?(a) 0.003(b) 9.945(c) 0.101(d) None of the above
What is the obvious conclusion from this printout?(a) That there is a main effect of AREA and an interaction, which are probably not due to sampling error(b) That there is only an interaction between the two IVs, which is probably not due to sampling error(c) That there are no main effects or
When generating error bar charts for a study with two IVs, each with two conditions, which combination of options should you select in SPSS?(a) Simple along with Summaries of groups of cases(b) Simple along with Summaries of separate variables(c) Clustered along with Summaries of groups of cases(d)
Partial h2 is:(a) A measure of the magnitude of the probability that the effects are due to sampling error(b) A measure of magnitude of effect used with ANOVA(c) A left-wing terrorist organisation(d) Both (a) and (b) above
What are the various sources of variance in an ANOVA with two between-participants IVs?(a) Variance attributable to the populations(b) Variance attributable to the two IVs and the error(c) Variance attributable to the two IVs, the interaction between the two IVs and the error(d) Both (a) and (c)
ANOVA is useful for:(a) Teasing out the individual effects of factors on an IV(b) Analysing data from research with more than one IV and one DV(c) Analysing correlational data(d) All of the above
How would you describe a 2 × 2 × 4 ANOVA?(a) One IV with three conditions(b) One IV with four conditions and one IV with two conditions(c) One IV with four conditions and two IVs with two conditions(d) One IV with 16 conditions
Assuming that the null hypothesis is true, the difference between conditions 1 and 2 has a:(a) 5% chance of arising by sampling error(b) 6% chance of arising by sampling error(c) 19% chance of arising by sampling error(d) 20% chance of arising by sampling error
Which two conditions show the largest difference?(a) 1 and 2(b) 2 and 3(c) 1 and 4(d) They are identical
Which is the most appropriate statement?(a) F(2,12) = 5.62, p = 0.020(b) F(1,6) = 5.62, p = 0.051(c) F(2,12) = 5.62, p = 0.049(d) F(1,6) = 5.62, p = 0.055
Which is the most appropriate answer? The effect size is:(a) 5.7%(b) 57%(c) 0.57%(d) 5%
Showing 800 - 900
of 5401
First
2
3
4
5
6
7
8
9
10
11
12
13
14
15
16
Last
Step by Step Answers