New Semester
Started
Get
50% OFF
Study Help!
--h --m --s
Claim Now
Question Answers
Textbooks
Find textbooks, questions and answers
Oops, something went wrong!
Change your search query and then try again
S
Books
FREE
Study Help
Expert Questions
Accounting
General Management
Mathematics
Finance
Organizational Behaviour
Law
Physics
Operating System
Management Leadership
Sociology
Programming
Marketing
Database
Computer Network
Economics
Textbooks Solutions
Accounting
Managerial Accounting
Management Leadership
Cost Accounting
Statistics
Business Law
Corporate Finance
Finance
Economics
Auditing
Tutors
Online Tutors
Find a Tutor
Hire a Tutor
Become a Tutor
AI Tutor
AI Study Planner
NEW
Sell Books
Search
Search
Sign In
Register
study help
business
statistics for experimentert
Statistics For The Behavioral Sciences 10th Edition Frederick J Gravetter, Larry B. Wallnau - Solutions
Problem 13 in Chapter 10 presented data showing that varsity athletes in contact sports (football and hockey)who were regularly exposed to head impacts had significantly lower cognitive scores than varsity athletes from noncontact sports. The independentmeasures t test produced t = 2.25 with df =
Problem 13 presented data showing a positive relationship between weight and income for a sample of professional men. However, weight was coded in five categories that could be viewed as an ordinal scale rather than an interval or ratio scale. If so, a Spearman correlation is more appropriate than
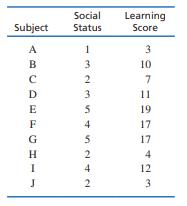
It appears that there is a significant relationship between cognitive ability and social status, at least for birds. Boogert, Reader, and Laland (2006) measured social status and individual learning ability for a group of starlings. The following data represent results similar to those obtained in
A common concern for students (and teachers) is the assignment of grades for essays or term papers.Because there are no absolute right or wrong answers, these grades must be based on a judgment of quality.To demonstrate that these judgments actually are reliable, an English instructor asked a
For a two-tailed test with α = .05, use Table B.6 to determine how large a Pearson correlation is necessary to be statistically significant for each of the following samples?a. A sample of n = 6b. A sample of n = 12c. A sample of n = 24
Identifying individuals with a high risk of Alzheimer’s disease usually involves a long series of cognitive tests. However, researchers have developed a 7-Minute Screen, which is a quick and easy way to accomplish the same goal. The question is whether the 7-Minute Screen is as effective as the
In the Chapter Preview we discussed a study by Judge and Cable (2010) demonstrating a negative relationship between weight and income for a group of women professionals. The following are data similar to those obtained in the study. To simplify the weight variable, the women are classified into
Correlation studies are often used to help determine whether certain characteristics are controlled more by genetic influences or by environmental influences.These studies often examine adopted children and compare their behaviors with the behaviors of their birth parents and their adoptive
In what situations can the phi-coefficient be used?a. When an independent-measures t test would also be appropriate.b. When both X and Y are ranks.c. When a single-sample t test would also be appropriate.d. When both X and Y are dichotomous.
The effect size for the data from an independent-measures t test can be measured by r2, which is the percentage of variance accounted for. The value for r2 can also be obtained by ____.a. squaring the Spearman correlation for the same datab. squaring the point-biserial correlation for the same
The Pearson and the Spearman correlations are both computed for the same set of data. If the Spearman correlation is rS = +1.00, then what can you conclude about the Pearson correlation?a. It will be positiveb. It will have a value of 1.00c. It will be positive and have a value of 1.00d. There is
If the following scores are ranked, what rank is assigned to an individual with a score of X = 7?Scores: 1, 2, 2, 5, 6, 6, 6, 7, 10, 12a. 5b. 6c. 7d. 8
Describe the circumstances in which the phi-coefficient is used and explain what it measures.
A researcher evaluating the significance of a Pearson correlation, obtains t = 2.099 for a sample of n = 20 participants. For a two-tailed test, which of the following accurately describes the significance of the correlation?a. The correlation is significant with α = .05 but not with α = .01.b.
For a hypothesis test for the Pearson correlation, what is stated by the null hypothesis?a. There is a non-zero correlation for the general population.b. The population correlation is zero.c. There is a non-zero correlation for the sample.d. The sample correlation is zero.
Conduct a hypothesis test evaluating the significance of a correlation.
What is measured by a partial correlation?a. It is the correlation obtained for a sample with missing scores (X or Y values).b. It is the correlation obtained for a restricted range of scores.c. It eliminates the influence of outliers (extreme scores) when computing a correlation.d. It measures the
Suppose the correlation between height and weight for adults is +0.80. What proportion (or percent) of the variability in weight can be explained by the relationship with height?a. 80%b. 64%c. 100 – 80 = 20%d. 40%
Explain what is measured by a partial correlation.
Define the coefficient of determination and explain what it measures.
Explain how a correlation can be influenced by a restricted range of scores or by outliers.
A set of n = 15 pairs of X and Y values has a Pearson correlation of r = 0.10.If each of the X values were multiplied by 2, then what is the correlation for the resulting data?a. 0.10b. –0.10c. 0.20d. –0.20
Describe the information provided by the sign (+/–) and the numerical value of a correlation.
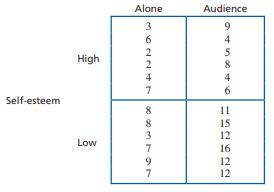
In a classic research study, Shrauger (1972) examined the effect of an audience on the performance of two different personality types. Data from this experiment are as follows. The dependent variable is the number of errors made by each participant.a. Use an ANOVA with α = .05 to evaluate the
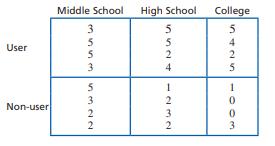
Kirschner and Karpinski (2010) report that college students who are on Facebook (or have it running in the background) while studying had lower grades than students who did not use the social network.A researcher would like to know if the same result extends to students in lower grade levels. The
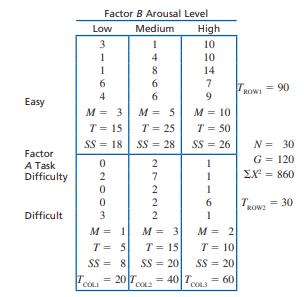
The following data are representative of many studies examining the relationship between arousal and performance. The general result of these studies is that increasing the level of arousal (or motivation)tends to improve the level of performance. (You probably have tried to “psych yourself up”
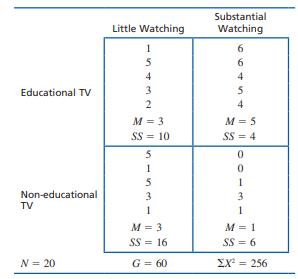
Research results indicate that 5-year-old children who watched a lot of educational programming such as Sesame Street and Mr. Rogers had higher high-school grades than their peers (Anderson, Huston, Wright, &Collins, 1998). The same study reported that 5-yearold children who watched a lot of
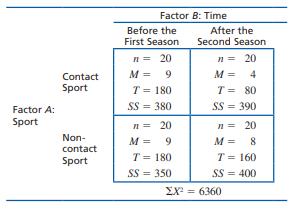
Most sports injuries are immediate and obvious, like a broken leg. However, some can be more subtle, like the neurological damage that may occur when soccer players repeatedly head a soccer ball. To examine effects of repeated heading, McAllister et al. (2012)examined a group of football and ice
A researcher conducts an independent-measures, two-factor study using a separate sample of n = 10 participants in each treatment condition. The results are evaluated using an ANOVA and the researcher reports an F-ratio with df = 2, 108 for factor A, and an F-ratio with df = 3, 108 for factor B.a.
Which of the following can often help reduce the variance caused by individual differences in a single-factor design?a. Counterbalance the order of treatments.b. Create a factorial design using a participant variable (such as age) as a second factor.c. Create a factorial design using the order of
A two-factor study has 2 levels of Factor A and 3 levels of Factor B. Because the ANOVA produces a significant interaction, the researcher decides to evaluate the simple mean effect of Factor A for each level of Factor B. How many F-ratios will this require?a. 1b. 2c. 3d. 6
Explain how adding a participant variable as a second factor can reduce variability caused by individual differences.
Explain how simple main effects can be used to analyze and describe the details of main effects and interactions.
In a two-factor ANOVA, which of the following is not computed directly but rather is found by subtraction?a. SSbetween treatmentsb. SSAc. SSBd. SSA×B
What happens in the second stage of a two-factor ANOVA?a. The total variability is divided into between treatments and within treatments.b. The variability within treatment is divided into between subjects and error.c. The variability within treatments is divided into the two main effects and the
Compute the SS, df, and MS values needed for a two-factor ANOVA and explain the relationships among them.
In a two-factor ANOVA, what is the implication of a significant A × B interaction?a. At least one of the main effects must also be significant.b. Both of the main effects must also be significant.c. Neither of the two main effects can be significant.d. The significance of the interaction has no
In a two-factor experiment with 2 levels of factor A and 2 levels of factor B, three of the treatment means are essentially identical and one is substantially different from the others. What result(s) would be produced by this pattern of treatment means?a. a main effect for factor Ab. a main effect
How many separate samples would be needed for a two-factor, independentmeasures research study with 2 levels of factor A and 3 levels of factor B?a. 2b. 3c. 5d. 6
Identify the three F-ratios for a two-factor ANVOA and explain how they are related to each other.
Define a main effect and an interaction and identify the patterns of data that produce main effects and interactions.
One of the primary advantages of a repeated-measures design, compared to independent-measures, is that it reduces the overall variability by removing variance caused by individual differences. In the previous problem, the very large differences among the P totals indicate very large individual
In the Preview section for this chapter, we presented an example of a delayed discounting study in which people are willing to settle for a smaller reward today in exchange for a larger reward in the future. The following data represent the typical results from one of these studies. The
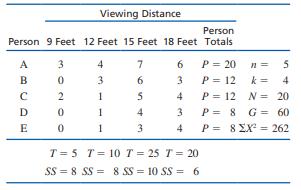
The following data represent the results of a repeated-measures study comparing different viewing distances for a 42-inch high-definition television. Four viewing distances were evaluated, 9 feet, 12 feet, 15 feet, and 18 feet. Each participant was free to move back and forth among the four
How does the denominator of the F-ratio (the error term) for a repeated-measures ANOVA compare to the denominator for an independent-measures ANOVA?
A repeated-measures ANOVA produced an F-ratio of F = 9.00 with df = 1, 14.If the same data were analyzed with a repeated-measures t test, what value would be obtained for the t statistic?a. 3b. 9c. 81d. Cannot determine without more information.
Under what circumstances would a study using a repeated-measures ANOVA have a distinct advantage over a study using an independent-measures ANOVA?a. When there are many participants available and individual differences are large.b. When there are few participants available and individual
Describe the general advantages and disadvantages of repeated-measures vs.independent-measures designs and identify the circumstances in which each is more appropriate.
The results of a repeated-measures ANOVA are reported as follows, F(2, 24) =1.12, p > .05. How many individuals participated in the study?a. 25b. 13c. 12d. 7
A researcher uses a repeated-measures ANOVA to test for mean differences among three treatment conditions using a sample of n = 10 participants. What are the df values for the F-ratio from this analysis?a. 3, 9b. 2, 9c. 3, 18d. 2, 18
For the repeated-measures ANOVA, SSerror is found by _____.a. SStotal – SSbetween treatmentsb. SSbetween treatments – SSwithinc. SSbetween treatments – SSbetween subjectsd. SSwithin – SSbetween subjects
Which of the following accurately describes the two stages of a repeated-measures analysis of variance?a. The first stage is identical to the independent-measures analysis and the second stage removes individual differences from the numerator of the F-ratio.b. The first stage is identical to the
In an independent-measures ANOVA, individual differences contribute to the variance in the numerator and in the denominator of the F-ratio. For a repeatedmeasures ANOVA, what happens to the individual differences in the denominator of the F-ratio?a. They do not exist because the same individuals
In an independent-measures ANOVA, individual differences contribute to the variance in the numerator and in the denominator of the F-ratio. For a repeatedmeasures ANOVA, what happens to the individual differences in the numerator of the F-ratio?a. They do not exist because the same individuals
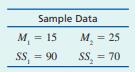
The following scores are from an independentmeasures study comparing two treatment conditions.a. Use an independent-measures t test with α = .05 to determine whether there is a significant mean difference between the two treatments.b. Use an ANOVA with α = .05 to determine whether there is a
The following values are from an independentmeasures study comparing three treatment conditions.Treatment I II III n = 8 n = 8 n = 8 SS = 42 SS = 28 SS = 98a. Compute the variance for each sample.b. Compute MSwithin, which would be the denominator of the F-ratio for an ANOVA. Because the samples
A researcher used ANOVA and computed an F–ratio for the following data.Treatments I II III n = 10 n = 10 n = 10 M = 20 M = 28 M = 35 SS = 105 SS = 191 SS = 180a. If the mean for treatment III were changed to M = 25, what would happen to the size of the F-ratio (increase or decrease)? Explain your
Several factors influence the size of the F-ratio. For each of the following, indicate whether it would influence the numerator or the denominator of the F-ratio, and indicate whether the size of the F-ratio would increase or decrease.a. Increase the differences between the sample means.b. Increase
The following data were obtained from an independent-measures research study comparing three treatment conditions. Use an ANOVA with α = .05 to determine whether there are any significant mean differences among the treatments.Treatment I II III n = 8 n = 6 n = 4 N = 18 T = 16 T = 24 T = 32 G = 72
The following values are from an independent-measures study comparing three treatment conditions.Treatment I II III n = 10 n = 10 n = 10 SS = 63 SS = 66 SS = 87a. Compute the variance for each sample.b. Compute MSwithin, which would be the denominator of the F-ratio for an ANOVA. Because the
Calculate SStotal, SSbetween, and SSwithin for the following set of data:Treatment 1 Treatment 2 Treatment 3 n = 10 n = 10 n = 10 N = 30 T = 10 T = 20 T = 30 G = 60 SS = 27 SS = 16 SS = 23 ΣX2 = 206
For an ANOVA, how does an increase in the sample sizes influence the likelihood of rejecting the null hypothesis and measures of effect size?a. both will increase.b. both will decreasec. the likelihood of rejecting H0 will increase but there will be little or no effect on measures of effect size.d.
If an analysis of variance is used for the following data, what would be the effect of changing the value of SS2 to 100?a. increase SSwithin and increase the size of the F-ratiob. increase SSwithin and decrease the size of the F-ratioc. decrease SSwithin and increase the size of the F-ratiod.
An analysis of variance is used to compare three treatment conditions with a group of 12 participants in each treatment. If a Scheffé test is used to evaluate the mean difference between the first two treatments, then what are the df values for the Scheffé F-ratio?a. 1, 33b. 1, 22c. 2, 33d. 2, 22
Which of the following accurately describes the purpose of posttests?a. They determine which treatments are different.b. They determine how much difference there is between treatments.c. They determine whether a Type I Error was made in the ANOVA.d. They determine whether a complete ANOVA is
Under what circumstances are posttests necessary?a. reject the null hypothesis with k = 2 treatments.b. reject the null hypothesis with k > 2 treatments.c. fail to reject the null hypothesis with k = 2 treatments.d. fail to reject the null hypothesis with k > 2 treatments.
Describe the circumstances in which posttests are necessary and explain what the tests accomplish.
A research report concludes that there are significant differences among treatments, with “F(2,27) = 8.62, p < .01, η2 = 0.28.” If the same number of participants was used in all of the treatment conditions, then how many individuals were in each treatment?a. 7b. 9c. 10d. cannot determine
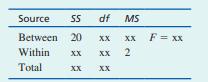
The following table shows the results of an analysis of variance comparing three treatment conditions with a sample of n = 7 participants in each treatment. Note that several values are missing in the table. What is the missing value for SStotal?a. 16b. 23c. 29d. 56 Source SS df MS Between 20 xx
A researcher reports an F-ratio with df = 3, 36 for an independent-measures experiment. How many treatment conditions were compared in this experiment?a. 3b. 4c. 36d. 39
Explain how the results from an ANOVA and measures of effect size are reported in the literature.
Define the df values for and F-ratio and use the df values, together with an alpha level, to locate the critical region in the distribution of F-ratios.
In analysis of variance, an MS value is a measure of ______.a. varianceb. average differences among meansc. the total variability for the set of N scoresd. the overall mean for the set of N scores
An analysis of variance is used to evaluate the mean differences for a research study comparing four treatment conditions with a separate sample of n = 5 in each treatment. The analysis produces SSwithin treatments = 32, SSbetween treatments = 40, and SStotal = 72.For this analysis, what is
An analysis of variance produces SSbetween treatments = 40 and MSbetween treatments = 10.In this analysis, how many treatment conditions are being compared?a. 4b. 5c. 30d. 50
When the null hypothesis is true for an ANOVA, what is the expected value for the F-ratio?a. 0b. 1.00c. much greater than 1.00d. less than zero
In an analysis of variance, the primary effect of large mean differences from one sample to another is to increase the value for ______.a. the variance between treatments.b. the variance within treatmentsc. the total variance.d. large mean differences will not directly affect any of the three
ANOVA is necessary to evaluate mean differences among three or more treatments, in order to ____________________ .a. minimize risk of Type I errorb. maximize risk of Type I errorc. minimize risk of Type II errord. maximize risk of Type II error
Describe the terminology that is used for ANOVA, especially the terms factor and level, and identify the hypotheses for this test.
The previous problem demonstrates that removing individual differences can substantially reduce variance and lower the standard error. However, this benefit only occurs if the individual differences are consistent across treatment conditions. In problem 21, for example, the participants with the
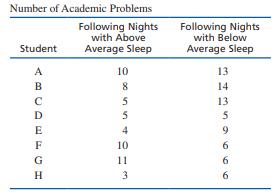
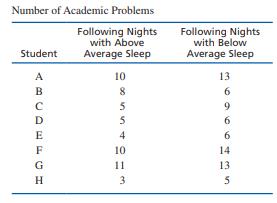
In the Chapter Preview we described a study showing that students had more academic problems following nights with less than average sleep compared to nights with more than average sleep(Gillen-O’Neel, Huynh, & Fuligni, 2013). Suppose a researcher is attempting to replicate this study using a
a. A repeated-measures study with a sample of n = 16 participants produces a mean difference of MD = 4 with a standard deviation of s = 8.Use a two-tailed hypothesis test with α = .05 to determine whether it is likely that this sample came from a population with µD = 0.b. Now assume that the
In the Preview for Chapter 2, we presented a study showing that a woman shown in a photograph was judged as less attractive when the photograph showed a visible tattoo compared to the same photograph with the tattoo removed (Resenhoeft, Villa, & Wiseman, 2008). Suppose a similar experiment is
A sample of n = 9 individuals participates in a repeated-measures study that produces a sample mean difference of MD = 4.25 with SS = 128 for the difference scores.a. Calculate the standard deviation for the sample of difference scores. Briefly explain what is measured by the standard deviation.b.
Describe the advantages and disadvantages of choosing a repeated-measures design instead of an independent-measures design to compare two treatment conditions.
A researcher is using a repeated-measures study to evaluate the difference between two treatments. If there is a consistent difference between the treatments then the data should produce ______.a. a small variance for the difference scores and a small standard errorb. a small variance for the
Which of the following would have little or no influence on effect size as measured by Cohen’s d or by r2?a. Increasing the sample sizeb. Increasing the size of the sample mean differencec. Increasing the sample varianced. All of the other three options would influence the magnitude of effect
A researcher obtains a sample of n = 9 individuals and tests each person in two different treatment conditions. The sample mean difference is MD = 12 points with SS = 72.Which of the following is the correct equation for the 80% confidence interval for the population mean difference?a. µD = 0 ±
A repeated-measures study with 9 scores in each treatment produces a mean difference of MD = 4.0 and SS = 288 for the difference scores. If the effect size is described using Cohen’sd, then what is the value for d?a. 0.111b. 0.667c. 1.00d. 2.00
Describe how the consistency of the treatment effect is reflected in the variability of the difference scores and explain how this influences the outcome of a hypothesis test.
For a repeated-measures study comparing two treatments with n = 15 scores in each treatment, the data produce t = 1.78. If the mean difference is in the direction that is predicted by the researcher, then which of the following is the correct decision for a hypothesis test with α = .05?a. Reject
For a repeated-measures study comparing two treatments with a sample of n = 9 participants, a researcher obtains a sample mean difference is MD = 5 with SS = 288 for the difference scores. What is the repeated-measures t statistic for these data?a. 5b. 2.5c. 1.25d. 0.83
Conduct a repeated-measures t test to evaluate the significance of the population mean difference using the data from a repeated-measures or a matched-subjects study comparing two treatment conditions.
For a repeated-measures hypothesis test, which of the following is the correct statement of the alternative hypothesis (H1)?a. For the individuals in the entire population there is no consistent difference between the two treatments.b. For the individuals in the entire population there is a
For the following data from a repeated-measures study, what is the sum of the squared deviations (SS) for the difference scores?a. 54b. 18c. 12d. 0
Describe the hypotheses for a repeated-measures t test.
For a research study comparing two treatments with n = 10 scores in each treatment, which design would require the largest number of participants?a. repeated-measuresb. independent-measuresc. matched-subjectsd. independent-measures or match-subjects (both use the same number)
A researcher conducts an experiment comparing two treatment conditions and obtains 20 scores in each treatment. Which design would require the smallest number of subjects?a. a repeated-measures designb. an independent-measures designc. a matched-subjects designd. either an independent-measures or a
Define a matched-subjects design and explain how it differs from repeated measures and independent-measures designs.
Define a repeated-measures design and explain how it differs from an independent measures design.
Showing 100 - 200
of 5401
1
2
3
4
5
6
7
8
9
10
11
12
13
14
15
Last
Step by Step Answers