New Semester
Started
Get
50% OFF
Study Help!
--h --m --s
Claim Now
Question Answers
Textbooks
Find textbooks, questions and answers
Oops, something went wrong!
Change your search query and then try again
S
Books
FREE
Study Help
Expert Questions
Accounting
General Management
Mathematics
Finance
Organizational Behaviour
Law
Physics
Operating System
Management Leadership
Sociology
Programming
Marketing
Database
Computer Network
Economics
Textbooks Solutions
Accounting
Managerial Accounting
Management Leadership
Cost Accounting
Statistics
Business Law
Corporate Finance
Finance
Economics
Auditing
Tutors
Online Tutors
Find a Tutor
Hire a Tutor
Become a Tutor
AI Tutor
AI Study Planner
NEW
Sell Books
Search
Search
Sign In
Register
study help
mathematics
applied statistics and probability
Applied Statistics And Probability For Engineers 6th Edition Douglas C. Montgomery, George C. Runger - Solutions
Consider a Weibull distribution with shape parameter 1.5 and scale parameter 2.0. Generate a graph of the probability distribution. Does it look very much like a normal distribution? Construct a table similar to Table 7-1 by drawing 20 random samples of size n = 10 from this distribution. Compute
Wayne Collier designed an experiment to measure the fuel efficiency of his family car under different tire pressures. For each run, he set the tire pressure and then measured the miles he drove on a highway (I-95 between Mills River and Pisgah Forest, NC) until he ran out of fuel using 2 liters of
Like hurricanes and earthquakes, geomagnetic storms are natural hazards with possible severe impact on the Earth. Severe storms can cause communication and utility breakdowns, leading to possible blackouts. The National Oceanic and Atmospheric Administration beams electron and proton flux data in
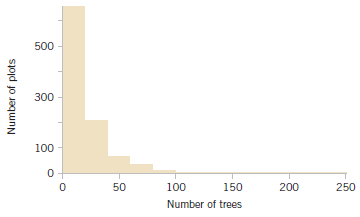
Researchers in the Hopkins Forest (see Exercise 7-16) also count the number of maple trees (genus acer) in plots throughout the forest. The following is a histogram of the number of live maples in 1002 plots sampled over the past 20 years. The average number of maples per plot was 19.86 trees with
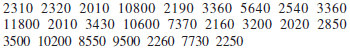
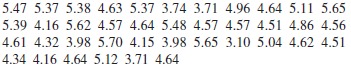
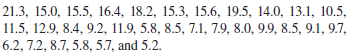
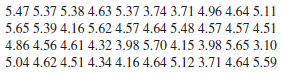
From the data in Exercise 6-21 on the pH of rain in Ingham County, Michigan:What proportion of the samples has pH below 5.0? 5.37 5.38 4.63 5.37 3.74 3.71 4.96 4.64 5.11 5.65 5.39 4.16 5.62 4.57 4.64 5.48 4.57 4.57 4.51 4.86 4.56 4.61 4.32 3.98 5.70 4.15 3.98 5.65 3.10 5.04 4.62 4.51 4.34 4.16 4.64
Scientists at the Hopkins Memorial Forest in western Massachusetts have been collecting meteorological and environmental data in the forest data for more than 100 years. In the past few years, sulfate content in water samples from Birch Brook has averaged 7.48 mg/L with a standard deviation of 1.60
Consider the concrete specimens in Exercise 7-7. What is the standard error of the sample mean?
Consider the compressive strength data in Table 6-2. What proportion of the specimens exhibit compressive strength of at least 200 psi?
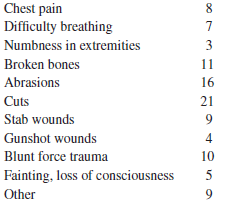
Consider the hospital emergency room data from Exercise 6-124. Estimate the proportion of patients who arrive at this emergency department experiencing chest pain.
Using the results of Exercise 6-130, which of the two quantities Σni=1 (xi – x̅)2 and Σni=1 (xi – μ)2 will be smaller, provided that x̅ ≠ μ?
Consider the quantity Σni=1 (xi – a)2. For what value of a is this quantity minimized?
Consider the global mean surface air temperature anomaly and the global CO2 concentration data originally shown in Table 6E.5.(a) Construct a scatter plot of the global mean surface air temperature anomaly versus the global CO2 concentration Comment on the plot.(b) What is the simple correlation
The force needed to remove the cap from a medicine bottle is an important feature of the product because requiring too much force may cause diffi culty for elderly patients or patients with arthritis or similar conditions. Table 6E.17 presents the results of testing a sample of 68 caps attached to
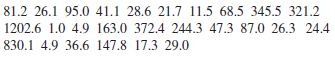
The energy consumption for 90 gas-heated homes during a winter heating season is given in Table 6E.16. The variable reported is BTU/number of heating degree days. (a) Calculate the sample mean and standard deviation of energy usage.(b) Construct a histogram of the energy usage data and comment
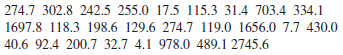
One of the authors (DCM) has a Mercedes-Benz 500 SL Roadster. It is a 2003 model and has fairly low mileage (currently 45,324 miles on the odometer). He is interested in learning how his car’s mileage compares with the mileage on similar SLs. Table 6E.15 contains the mileage on 100 Mercedes- Benz
Patients arriving at a hospital emergency department present a variety of symptoms and complaints. The following data were collected during one weekend night shift (11:00 p.m. to 7:00 a.m.):(a) Calculate numerical summaries of these data. What practical interpretation can you give to these
In their book Introduction to Time Series Analysis and Forecasting (Wiley, 2008), Montgomery, Jennings, and Kulahci presented the data on the drowning rate for children between one and four years old per 100,000 of population in Arizona from 1970 to 2004. The data are: 19.9, 16.1, 19.5, 19.8,(a)
Using the data on acid rain from Exercise 6-21,(a) Find the quartiles and median of the data.(b) Draw a box plot for the data.(c) Should any points be considered potential outliers? Compare this to your answer in Exercise 6-21. Explain.
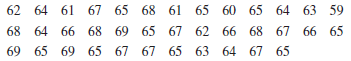
Using the data on bridge conditions from Exercise 6-20,(a) Find the quartiles and median of the data.(b) Draw a box plot for the data.(c) Should any points be considered potential outliers? Compare this to your answer in Exercise 6-20. Explain.
Construct a frequency distribution and histogram for the swim time measurements in Exercise 6-24.
Construct a frequency distribution and histogram for the combined cloud-seeding rain measurements in Exercise 6-22.
Construct a frequency distribution and histogram for the acid rain measurements in Exercise 6-21.
Construct a frequency distribution and histogram for the bridge condition data in Exercise 6-20.
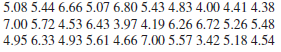
The female students in an undergraduate engineering core course at ASU self-reported their heights to the nearest inch. The data follow. Construct a stem-and-leaf diagram for the height data and comment on any important features that you notice. Calculate the sample mean, the sample standard
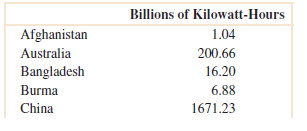
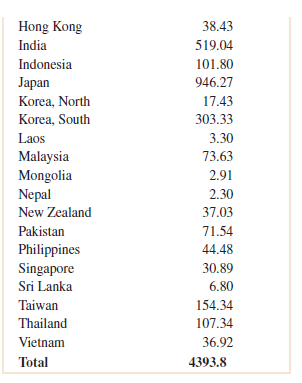
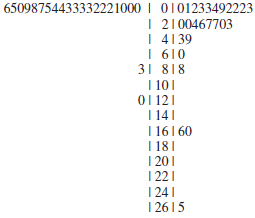
The net energy consumption (in billions of kilowatthours) for countries in Asia in 2003 was as follows (source: U.S. Department of Energy Web site, www.eia.doe.gov/emeu). Construct a stem-and-leaf diagram for these data and comment on any important features that you notice. Compute the sample mean,
When will the median of a sample be equal to the mode?
When will the median of a sample be equal to the sample mean?
A back-to-back stem-and-leaf display on two data sets is conducted by hanging the data on both sides of the same stems. Here is a back-to-back stem-and-leaf display for the cloud seeding data in Exercise 6-22 showing the unseeded clouds on the left and the seeded clouds on the right.How does the
For the data in Exercise 6-21,(a) Construct a stem-and-leaf diagram.(b) Many scientists consider rain with a pH below 5.3 to be acid rain (http://www.ec.gc.ca/eau-water/default.asp? lang=En&n=FDF30C16-1). What percentage of these samples could be considered as acid rain?
For the data in Exercise 6-20,(a) Construct a stem-and-leaf diagram.(b) Do any of the bridges appear to have unusually good or poor ratings?(c) If so, compute the mean with and without these bridges and comment.Exercise 6-20The United States has an aging infrastructure as witnessed by several
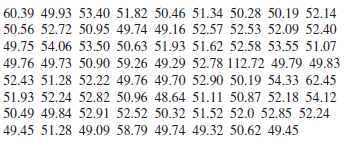
In the 2000 Sydney Olympics, a special program initiated by IOC president Juan Antonio Samaranch allowed developing countries to send athletes to the Olympics without the usual qualifying procedure. Here are the 71 times for the first round of the 100 meter men€™s swim (in seconds).(a)
Construct dot diagrams of the seeded and unseeded clouds and compare their distributions in a couple of sentences.
Cloud seeding, a process in which chemicals such as silver iodide and frozen carbon dioxide are introduced by aircraft into clouds to promote rainfall was widely used in the 20th century. Recent research has questioned its effectiveness [Journal of Atmospheric Research (2010, Vol. 97 (2), pp.
In an attempt to measure the effects of acid rain, researchers measured the pH (7 is neutral and values below 7 are acidic) of water collected from rain in Ingham County, Michigan.(a) Find the sample mean and sample standard deviation of these measurements.(b) Construct a dot diagram of the data.
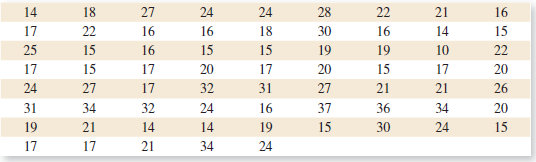
The United States has an aging infrastructure as witnessed by several recent disasters, including the I-35 bridge failure in Minnesota. Most states inspect their bridges regularly and report their condition (on a scale from 1€“17) to the public. Here are the condition numbers from a
Exercise 6-11 describes data from an article in Human Factors on visual accommodation from an experiment involving a high-resolution CRT screen. Data from a second experiment using a low-resolution screen were also reported in the article. They are 8.85, 35.80, 26.53, 64.63, 9.00, 15.38,
An article in the Journal of Physiology [€œResponse of Rat Muscle to Acute Resistance Exercise Defined by Transcriptional and Translational Profiling€ (2002, Vol. 545, pp. 27€“41)] studied gene expression as a function of resistance exercise. Expression data (measures
The following data are direct solar intensity measurements (watts/m2) on different days at a location in southern Spain: 562, 869, 708, 775, 775, 704, 809, 856, 655, 806, 878, 909, 918, 558, 768, 870, 918, 940, 946, 661, 820, 898, 935, 952, 957, 693, 835, 905, 939, 955, 960, 498, 653, 730, and 753.
Suppose that you add 10 to all of the observations in a sample. How does this change the sample mean? How does it change the sample standard deviation?
Can the sample standard deviation be equal to zero? If so, give an example.
For any set of data values, is it possible for the sample standard deviation to be larger than the sample mean? If so, give an example.
Will the sample mean always be the most frequently occurring data value in the sample?
Will exactly half of the observations in a sample fall below the mean?
Will the sample mean always correspond to one of the observations in the sample?
Use the properties of moment generating functions to show that a sum of p independent normal random variables with means μi and variances σi2 for i = 1,2, ...., p has a normal distribution.
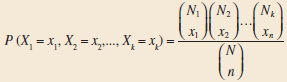
This exercise extends the hypergeometric distribution to multiple variables. Consider a population with N items of k different types. Assume that there are N1items of type 1, N2items of type 2,€¦, Nkitems of type k so that N1+ N2+ €¦ + €¦ Nk= N. Suppose that a
Suppose that the range of the continuous variables X and Y is 0 < x < a and 0 < y < b. Also suppose that the joint probability density function fXY(x, y) = g(x)h(y), where g(x) is a function only of x, and h(y) is a function only of y. Show that X and Y are independent.
Suppose that the joint probability function of the continuous random variables X and Y is constant on the rectangle 0 < x < a, 0 < y < b. Show that X and Y are independent.
Show that if X1, X2,…, Xp are independent random variables and Y = c1X1 + c2X2 + ... + cpXp, V (Y ) = c12V (X1) + c22V (X2) +…+ c2pV1 (Xp) You may assume that the random variables are continuous.
Show that if X1, X2,…, Xp are independent, continuous random variables, P(X1 ∈ A1, X2 ∈ A2,…, Xp ∈ Ap) = P(X1 ∈ A1)P(X2∈ A2) … P(Xp ∈ Ap) for any regions A1, A2,…, Ap in the range of X1, X2,…, Xp respectively.
Use moment generating functions to determine the normalized power [E(X4)]1/4 from a cycling power meter when X has a normal distribution with mean 200 and standard deviation 20 Watts.
The intensity (mW/mm2) of a laser beam on a surface theoretically follows a bivariate normal distribution with maximum intensity at the center, equal variance σ in the x and y directions, and zero covariance. There are several definitions for the width of the beam. One definition is the diameter
The power in a DC circuit is P = I2 /R where I and R denote the current and resistance, respectively. Suppose that I is normally distributed with mean of 200 mA and standard deviation 0.2 mA and R is a constant. Determine the probability density function of power.
Determine the value of c such that the function f(x,y) = cx2y for 0 < x < 3 and 0 < y < 2 satisfies the properties of a joint probability density function.Determine the following:(a) P(X <1, Y <1) (b) P(X <2.5)(c) P(1(d) P(X >2. 1(e) E(X) (f) E(Y)(g) Marginal
Suppose X has a lognormal distribution with parameters θ and ω. Determine the probability density function and the parameters values for Y = Xγ for a constant γ > 0. What is the name of this distribution?
A marketing company performed a risk analysis for a manufacturer of synthetic fibers and concluded that new competitors present no risk 13% of the time (due mostly to the diversity of fibers manufactured), moderate risk 72% of the time (some overlapping of products), and very high risk (competitor
An order of 15 printers contains 4 with a graphics- enhancement feature, 5 with extra memory, and 6 with both features. Four printers are selected at random, without replacement, from this set. Let the random variables X, Y, and Z denote the number of printers in the sample with graphics
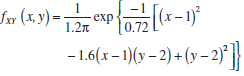
Ifdetermine E(X), E(Y), V(X), V(Y), and Ï by reorganizing the parameters in the joint probability density function. w (x, y) = 10.72 (x-1) - 1.6(x– 1)(y – 2) + (y – 2)}° | exp 1.2π
Suppose that X and Y have a bivariate normal distribution with σX = 4, σY = 1, /, μY = 4, and ρ = − 0.2. Draw a rough contour plot of the joint probability density function.
The joint distribution of the continuous random variables X, Y, and Z is constant over the region x2 + y2 ≤ 1, 0< z < 4. Determine the following:(a) P(X2 + Y2 ≤ 0.5) (b) P(X2 + Y2 ≤ 0.5, Z <2)(c) Joint conditional probability density function of X and Y given that Z = 1(d)
To evaluate the technical support from a computer manufacturer, the number of rings before a call is answered by a service representative is tracked. Historically, 70% of the calls are answered in two rings or less, 25% are answered in three or four rings, and the remaining calls require five rings
The backoff torque required to remove bolts in a steel plate is rated as high, moderate, or low. Historically, the probability of a high, moderate, or low rating is 0.6, 0.3, or 0.1, respectively. Suppose that 20 bolts are evaluated and that the torque ratings are independent. (a) What is the
The percentage of people given an antirheumatoid medication who suffer severe, moderate, or minor side effects are 10, 20, and 70%, respectively. Assume that people react independently and that 20 people are given the medication. Determine the following:(a) Probability that 2, 4, and 14 people will
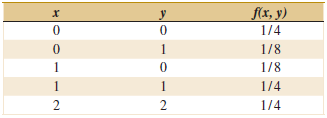
Show that the following function satisfies the properties of a joint probability mass function:Determine the following:(a) P(X <0.5, Y <1.5) (b) P(X ‰¤ 1)(c) P(X <1.5) (d) P(X >0.5, Y <1.5)(e) E(X), E(Y), V(X), V(Y).(f) Marginal probability distribution of
Suppose that Xi has a normal distribution with mean μi and variance σi 2 , i = 1, 2. Let X1 and X2 be independent.(a) Find the moment-generating function of Y = X1 + X1.(b) What is the distribution of the random variable Y?
Let X1, X2 X3,..., be independent exponential random variables with parameter λ.(a) Find the moment-generating function of Y = X1 + X2 + …+ Xr .(b) What is the distribution of the random variable Y?
A random variable X has the gamma distribution0 F(x) = говr Aryle X>0 " style="" class="fr-fic fr-dib">(a) Show that the moment-generating function of X is0 F(x) = говr Aryle X>0 Ma()-(1-£)" Mx(t)=
A random variable X has the exponential distributionShow that the moment-generating function of X is(b) Find the mean and variance of X. f(x) = le, x>0 10-(1-) Mx(t) =
The continuous uniform random variable X has density function(a) Show that the moment-generating function is(b) Use MX t ( ) to find the mean and variance of X. F(x) =, asiSB asx
A continuous random variable X has the following probability distribution: f (x) = 4xe−2x , x > 0(a) Find the moment-generating function for X.(b) Find the mean and variance of X.
The chi-squared random variable with k degrees of freedom has moment-generating function MX (t)=(1−2t)− k / 2. Suppose that X1 and X2 are independent chi-squared random variables with k1 and k2 degrees of freedom, respectively. What is the distribution of Y = X1 + X2?
A random variable X has the Poisson distribution(a) Show that the moment-generating function is(b) Use MX (t) to fi nd the mean and variance of the Poisson random variable. f(x) = х%3D0,1,... x! Mx(t)= e(d-1)
A random variable X has the discrete uniform distribution(a) Show that the moment-generating function is(b) Use MX (t) to fi nd the mean and variance of X. =, x=1,2,.m f(x) т e (1-ет) Mx(t) = т(1—е')
Power meters enable cyclists to obtain power measurements nearly continuously. The meters also calculate the average power generated over a time interval. Professional riders can generate 6.6 watts per kilogram of body weight for extended periods of time. Some meters calculate a normalized power
The computational time of a statistical analysis applied to a data set can sometimes increase with the square of N, the number of rows of data. Suppose that for a particular algorithm, the computation time is approximately T = 0.004N2 seconds. Although the number of rows is a discrete measurement,
Derive the probability density function for a lognormal random variable Y from the relationship that Y = exp(W) for a normal random variable W with mean θ and variance ω2.
An aircraft is flying at a constant altitude with velocity magnitude r1 (relative to the air) and angle θ1 (in a two-dimensional coordinate system). The magnitude and direction of the wind are r2 and θ2, respectively. Suppose that the wind angle is uniformly distributed between 10 and 20 degrees
The random variable X has the probability distributionDetermine the probability distribution of Y = (X €“ 2)2. 0srS4 х S«(x)=.
Suppose that X has the probability distribution fX (x) = 1, 1 ≤ x ≤ 2 Determine the probability distribution of the random variable Y = eX.
The velocity of a particle in a gas is a random variable V with probability distribution fV (v) = av2 e–bv v > 0 where b is a constant that depends on the temperature of the gas and the mass of the particle. (a) Determine the value of the constant a.(b) The kinetic energy of the particle
A random variable X has the probability distribution fX (x) = e–x, x ≥ 0 Determine the probability distribution for the following:(a) Y = X2(b) Y = X ½(c) Y = ln X
Suppose that X has a uniform probability distribution fX (x) ,= 1, 0 ≤ x ≤ 1 Show that the probability distribution of the random variable Y = –2 X is chi-squared with two degrees of freedom.
Suppose that X is a continuous random variable with probability distribution (a) Determine the probability distribution of the random variable Y = 2X + 10.(b) Determine the expected value of Y. х Sa (x) = 18 OsxS6
Let X be a binomial random variable with p = 0.25 and n = 3. Determine the probability distribution of the random variable Y = X2.
Suppose that X is a random variable with probability distribution fX (x) = 1/4, x = 1 2 3 4 Determine the probability distribution of Y = 2X + 1.
Consider the perimeter of a part in Example 5-32. Let X1 and X2 denote the length and width of a part with standard deviations 0.1 and 0.2 centimeters, respectively. Suppose that the covariance between X1 and X2 is 0.02. Determine the variance of the perimeter Y = 2X1 + 2X2 of a part. Compare and
Weights of parts are normally distributed with variance σ2. Measurement error is normally distributed with mean 0 and variance 0.5σ2, independent of the part weights, and adds to the part weight. Upper and lower specifications are centered at 3σ about the process mean. (a) Without
An article in Knee Surgery Sports Traumatology, Arthroscopy [“Effect of Provider Volume on Resource Utilization for Surgical Procedures” (2005, Vol. 13, pp. 273–279)] showed a mean time of 129 minutes and a standard deviation of 14 minutes for ACL reconstruction surgery for high-volume
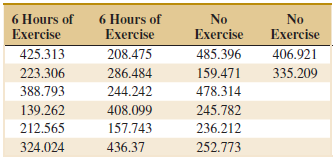
Making handcrafted pottery generally takes two major steps: wheel throwing and fi ring. The time of wheel throwing and the time of firing are normally distributed random variables with means of 40 minutes and 60 minutes and standard deviations of 2 minutes and 3 minutes, respectively. (a) What
X and Y are independent, normal random variables with E(X) = 2, V (X) = 5, E(Y ) = 6, and V (Y ) = 8.Determine the following:(a) E(3X + 2Y ) (b) V (3X + 2Y )(c) P(3X + 2Y <18) (d) P(3X + 2Y <28)
Suppose that X has a standard normal distribution. Let the conditional distribution of Y given X = x be normally distributed with mean E(Y | x) = 2x and variance V(Y | x) = 2x. Determine the following.(a) Are X and Y independent? (b) P(Y < 3 | X = 3)(c) E(Y | X = 3) (d) fXY (x,y)(e)
Patients given drug therapy either improve, remain the same, or degrade with probabilities 0.5, 0.4, 0.1, respectively. Suppose that 20 patients (assumed to be independent) are given the therapy. Let X1,X2, and X3 denote the number of patients who improved, stayed the same, or became degraded.
In an acid-base titration, a base or acid is gradually added to the other until they have completely neutralized each other. Let X and Y denote the milliliters of acid and base needed for equivalence, respectively. Assume that X and Y have a bivariate normal distribution with σX = 5 mL, σY = 2
Suppose that X and Y have a bivariate normal distribution with σX = 0.04, σY = 0.08, μX = 3.00, μY = 7.70, and ρ = 0.Determine the following:(a) P(2.95< X <3.05) (b) P(7.60(c) P(2.95< X <3.05, 7.60
Four electronic ovens that were dropped during shipment are inspected and classifi ed as containing either a major, a minor, or no defect. In the past, 60% of dropped ovens had a major defect, 30% had a minor defect, and 10% had no defect. Assume that the defects on the four ovens occur
A Web site uses ads to route visitors to one of four landing pages. The probabilities for each landing page are equal. Consider 20 independent visitors and let the random variables W, X, Y , and Z denote the number of visitors routed to each page.Calculate the following:(a) P(W = 5, X = 5, Y = 5, Z
Based on the number of voids, a ferrite slab is classified as either high, medium, or low. Historically, 5% of the slabs are classified as high, 85% as medium, and 10% as low. A sample of 20 slabs is selected for testing. Let X, Y , and Z denote the number of slabs that are independently classified
Test results from an electronic circuit board indicate that 50% of board failures are caused by assembly defects, 30% by electrical components, and 20% by mechanical defects. Suppose that 10 boards fail independently. Let the random variables X, Y , and Z denote the number of assembly, electrical,
Determine the covariance and correlation for the lengths of the minor and major axes in Exercise 5-29.Exercise 5-29The lengths of the minor and major axes are used to summarize dust particles that are approximately elliptical in shape. Let X and Y denote the lengths of the minor and major axes (in
Determine the covariance and correlation for the CD4 counts in a month and the following month in Exercise 5-30.Exercise 5-30An article in Health Economics [€œEstimation of the Transition Matrix of a Discrete-Time Markov Chain€ (2002, Vol.11, pp. 33€“42)] considered
Showing 600 - 700
of 1157
1
2
3
4
5
6
7
8
9
10
11
12
Step by Step Answers