New Semester
Started
Get
50% OFF
Study Help!
--h --m --s
Claim Now
Question Answers
Textbooks
Find textbooks, questions and answers
Oops, something went wrong!
Change your search query and then try again
S
Books
FREE
Study Help
Expert Questions
Accounting
General Management
Mathematics
Finance
Organizational Behaviour
Law
Physics
Operating System
Management Leadership
Sociology
Programming
Marketing
Database
Computer Network
Economics
Textbooks Solutions
Accounting
Managerial Accounting
Management Leadership
Cost Accounting
Statistics
Business Law
Corporate Finance
Finance
Economics
Auditing
Tutors
Online Tutors
Find a Tutor
Hire a Tutor
Become a Tutor
AI Tutor
AI Study Planner
NEW
Sell Books
Search
Search
Sign In
Register
study help
mathematics
applied statistics and probability
Applied Statistics And Probability For Engineers 6th Edition Douglas C. Montgomery, George C. Runger - Solutions
Consider the regression model fit to the X-ray inspection data in Exercise 12-15. Use rads as the response.(a) What proportion of total variability is explained by this model?(b) Construct a normal probability plot of the residuals. What conclusion can you draw from this plot?(c) Plot the residuals
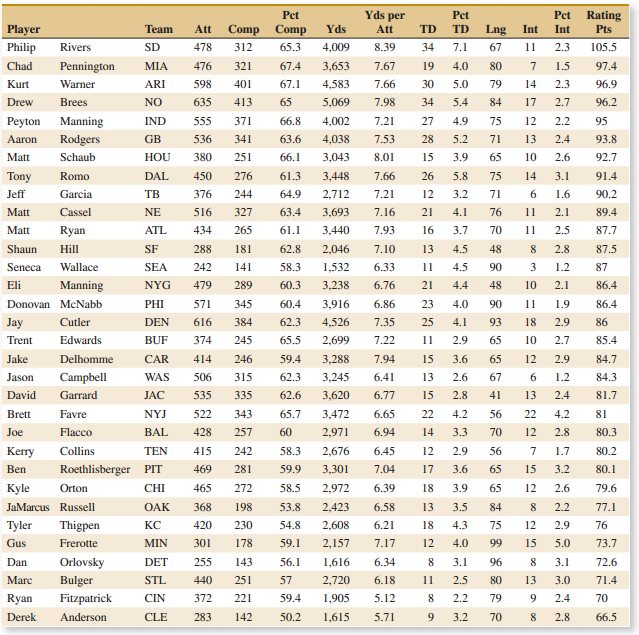
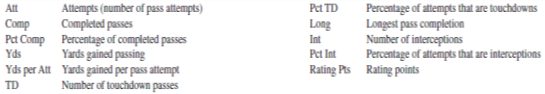
Consider the NFL data in Exercise 12-21.(a) Find 95% confidence intervals on the regression coefficients.(b) What is the estimated standard error of μ̂Y|x0 when the percentage of completions is 60%, the percentage of TDs is 4%, and the percentage of interceptions is 3%.(c) Find a 95% confidence
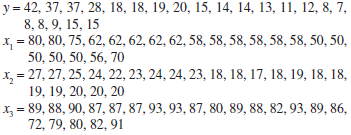
Consider the stack loss data in Exercise 12-20.(a) Calculate 95% confidence intervals on each regression coefficient.(b) Calculate a 95% confidence interval on mean stack loss when x1 = 80, x2 = 25 and x3 = 90.(c) Calculate a prediction interval on stack loss for the same values of the regressors
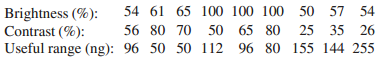
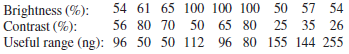
Consider the regression model fit to the gray range modulation data in Exercise 12-19. Use the useful range as the response.(a) Calculate 99% confidence intervals on each regression coefficient.(b) Calculate a 99% confidence interval on mean useful range when brightness = 70 and contrast = 80.(c)
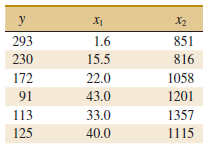
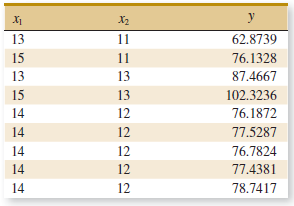
Consider the regression model fit to the nisin extraction data in Exercise 12-18.(a) Calculate 95% confidence intervals on each regression coefficient.(b) Calculate a 95% confidence interval on mean nisin extraction when x1 = 15.5 and x2 = 16.(c) Calculate a prediction interval on nisin extraction
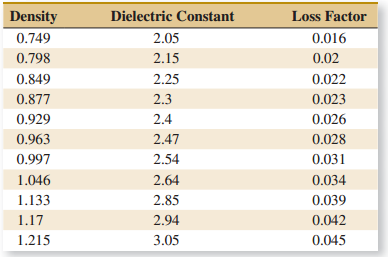
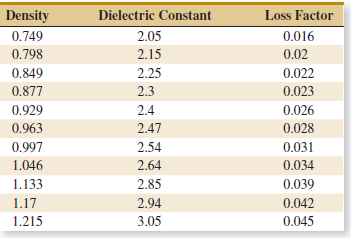
Consider the regression model fit to the coal and limestone mixture data in Exercise 12-17. Use density as the response.(a) Calculate 90% confidence intervals on each regression coefficient.(b) Calculate a 90% confidence interval on mean density when the dielectric constant = 2.3 and the loss
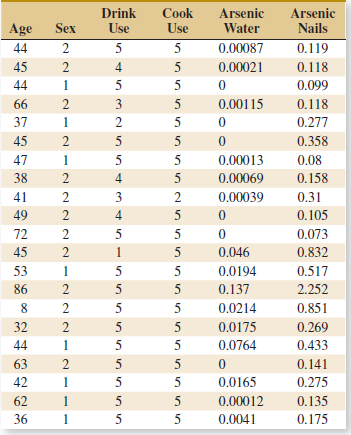
Consider the regression model fit to the arsenic data in Exercise 12-16. Use arsenic in nails as the response and age, drink use, and cook use as the regressors.(a) Calculate 99% confidence intervals on each regression coefficient.(b) Calculate a 99% confidence interval on mean arsenic
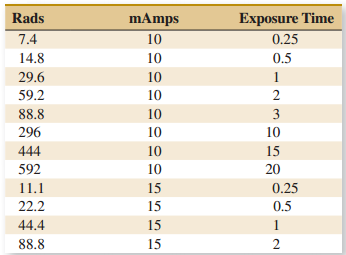
Consider the regression model fit to the X-ray inspection data in Exercise 12-15. Use rads as the response.(a) Calculate 95% confidence intervals on each regression coefficient.(b) Calculate a 99% confidence interval on mean rads at 15 milliamps and 1 second on exposure time.(c) Calculate a 99%
Consider the regression model fit to the shear strength of soil in Exercise 12-5.(a) Calculate 95% confidence intervals on each regression coefficient.(b) Calculate a 95% confidence interval on mean strength when x1 = 18 ft and x2 = 43%.(c) Calculate 95% prediction interval on strength for the same
Use the second-order polynomial regression model from Exercise 12-4,(a) Find a 95% confidence interval on both the first-order and the second-order term in this model.(b) Is zero in the confidence interval you found for the second-order term in part (a)? What does that fact tell you about the
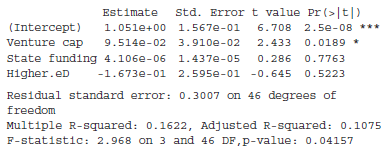
Referring to the regression model from Exercise 12-3,(a) Find a 95% confidence interval for the coefficient of spending on higher education.(b) Is zero in the confidence interval you found in part (a)? What does that fact imply about the coefficient of higher education?(c) Find a 95% prediction
Using the regression from Exercise 12-2,(a) Find a 95% confidence interval for the coefficient of hourly 1 test.(b) Find a 95% confidence interval for the mean final grade for students who score 80 on the first test and 85 on the second. (c) Find a 95% prediction interval for a student with
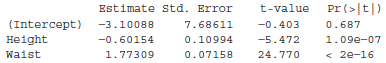
Using the regression model from Exercise 12-1,(a) Find a 95% confidence interval for the coefficient of height.(b) Find a 95% confidence interval for the mean percent of body fat for a man with a height of 72in and waist of 34in.(c) Find a 95% prediction interval for the percent of body fat for a
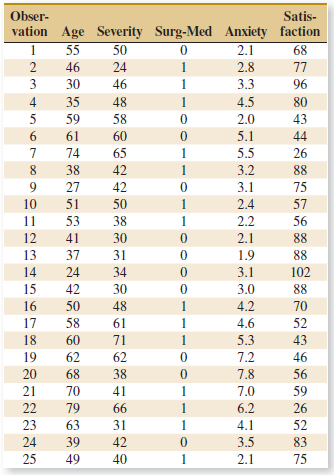
Data from a hospital patient satisfaction survey were presented in Exercise 12-9.(a) Fit a regression model using only the patient age and severity regressors. Test the model from this exercise for significance of regression. What conclusions can you draw if α = 0.05? What if
Data from a hospital patient satisfaction survey were presented in Exercise 12-9.(a) Test the model from this exercise for significance of regression. What conclusions can you draw if α = 0.05? What if α = 0.01?(b) Test the contribution of the individual regressors using
Consider the bearing wear data in Exercise 12-23.(a) For the model with no interaction, test for significance of regression using α = 0.05. What is the P-value for this test? What are your conclusions?(b) For the model with no interaction, compute the t-statistics for each regression
Exercise 12-2 presented a regression model to predict final grade from two hourly tests.(a) Test the hypotheses that each of the slopes is zero.(b) What is the value of R2 for this model?(c) What is the residual standard deviation?(d) Do you believe that the professor can predict the final grade
Constrained Least Squares. Suppose we wish to find the least squares estimator of a in the model y = Xβ + ε subject to a set of equality constraints, say, Tβ = c.(a) Show that the estimator is
Consider the multiple linear regression model y = Xβ + ε. If β adenotes the least squares estimator of β, show that β = β + Re, where (X'X)-1 X'.
You have fit a regression model with two regressors to a data set that has 20 observations. The total sum of squares is 1000 and the model sum of squares is 750.(a) What is the value of R2 for this model?(b) What is the adjusted R2 for this model?(c) What is the value of the F-statistic for testing
An article in Technometrics (1974, Vol. 16, pp. 523€“531) considered the following stack-loss data from a plant oxidizing ammonia to nitric acid. Twenty-one daily responses of stack loss (the amount of ammonia escaping) were measured with air flow x1, temperature x2, and acid
Consider the NFL data in Exercise 12-21.(a) Test for significance of regression using α = 0.05. What is the P-value for this test?(b) Conduct the t-test for each regression coefficient. Using α = 0.05, what conclusions can you draw about the variables in this model?(c)
Consider the regression model fit to the stack loss data in Exercise 12-20. Use stack loss as the response.(a) Test for significance of regression using α = 0.05. What is the P-value for this test?(b) Construct a t-test on each regression coefficient. What conclusions can you draw
Consider the regression model fit to the gray range modulation data in Exercise 12-19. Use the useful range as the response.(a) Test for significance of regression using α = 0.05. What is the P-value for this test?(b) Construct a t-test on each regression coefficient. What conclusions
Consider the regression model fit to the nisin extraction data in Exercise 12-18. Use nisin extraction as the response.(a) Test for significance of regression using α = 0.05. What is the P-value for this test?(b) Construct a t-test on each regression coefficient. What conclusions can
Consider the regression model fit to the X-ray inspection data in Exercise 12-15. Use rads as the response.(a) Test for significance of regression using α = 0.05. What is the P-value for this test?(b) Construct a t-test on each regression coefficient. What conclusions can you draw about the
Consider the regression model fit to the arsenic data in Exercise 12-16. Use arsenic in nails as the response and age, drink use, and cook use as the regressors.(a) Test for significance of regression using α = 0.05. What is the P-value for this test?(b) Construct a t-test on each regression
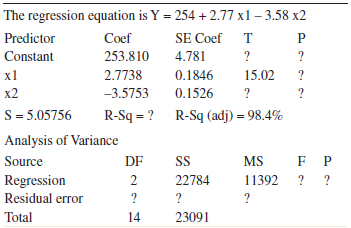
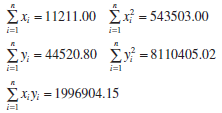
Consider the following computer output.(a) Fill in the missing quantities. You may use bounds for the P-values.(b) What conclusions can you draw about the significance of regression?(c) What conclusions can you draw about the contributions of the individual regressors to the model? The regression
Consider the linear regression model from Exercise 12-4. Is the second-order term necessary in the regression model?Exercise 12-4Hsuie, Ma, and Tsai (€˜€˜Separation and Characterizations of Thermotropic Copolyesters of p-Hydroxybenzoic Acid, Sebacic Acid, and
Consider the regression model of Exercise 12-3 attempting to predict the percent of engineers in the workforce from various spending variables.(a) Are any of the variables useful for prediction? (Test an appropriate hypothesis).(b) What percent of the variation in the percent of engineers is
Exercise 12-2 presented a regression model to predict final grade from two hourly tests.(a) Test the hypotheses that each of the slopes is zero.(b) What is the value of R2 for this model?(c) What is the residual standard deviation?(d) Do you believe that the professor can predict the final grade
Recall the regression of percent of body fat on height and waist from Exercise 12-1. The simple regression model of percent of body fat on height alone shows the following:(a) Test whether the coefficient of height is statistically significant.(b) Looking at the model with both waist and height in
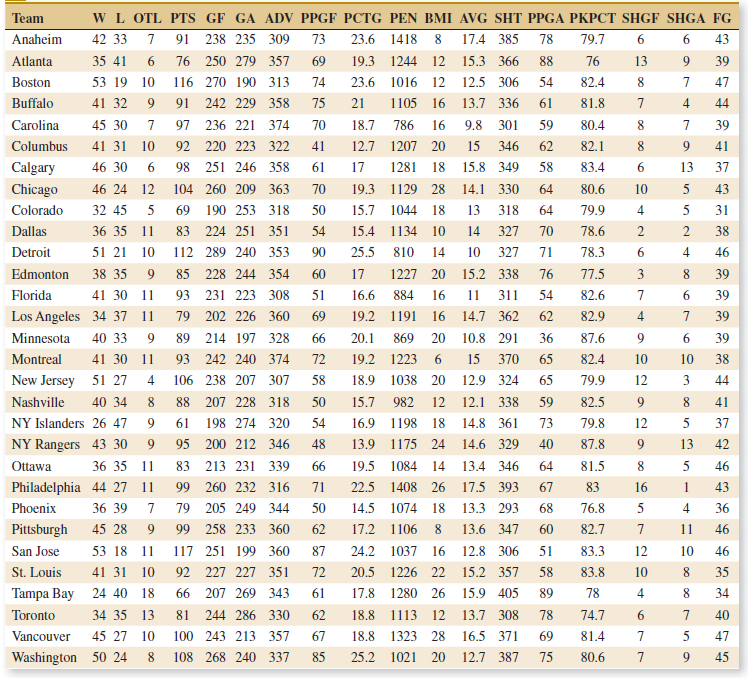
Table E12-12 presents statistics for the National Hockey League teams from the 2008€“2009 season (The Sports Network). Fit a multiple linear regression model that relates wins to the variables GF through FG Because teams play 82 game, W = 82 ˆ’ L ˆ’ T ˆ’OTL,
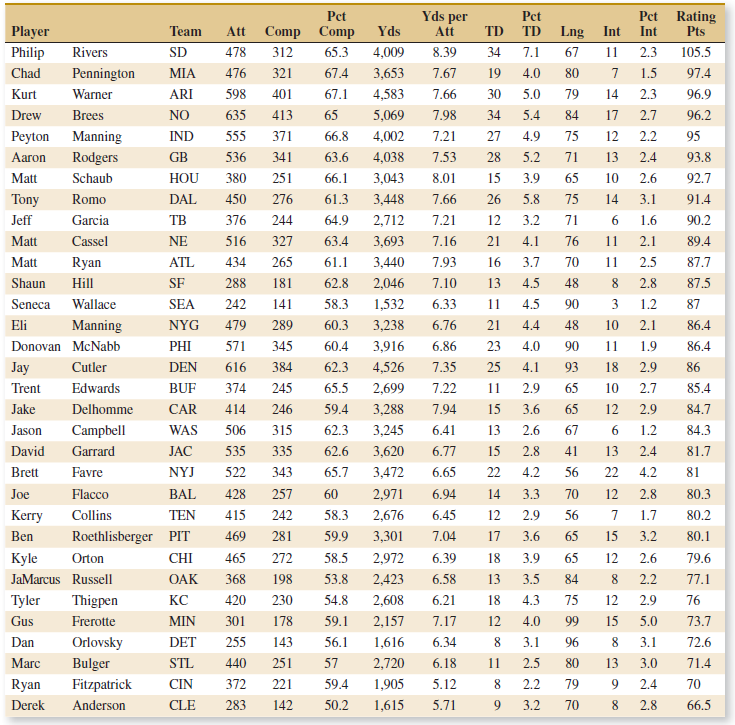
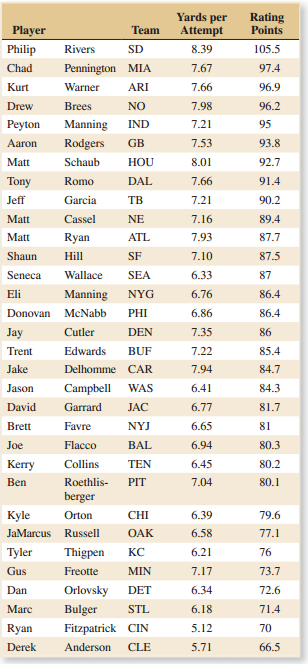
Table E12-11 presents quarterback ratings for the 2008 National Football League season (The Sports Network). (a) Fit a multiple regression model to relate the quarterback rating to the percentage of completions, the percentage of TDs, and the percentage of interceptions.(b) Estimate
An article in Optical Engineering [€œOperating Curve Extraction of a Correlator€™s Filter€ (2004, Vol. 43, pp. 2775€“2779)] reported on the use of an optical correlator to perform an experiment by varying brightness and contrast. The resulting modulation is
An article in Biotechnology Progress (2001, Vol. 17, pp. 366€“368) reported on an experiment to investigate and optimize nisin extraction in aqueous two-phase systems (ATPS). The nisin recovery was the dependent variable (y). The two regressor variables were concentration (%) of PEG 4000
An article in IEEE Transactions on Instrumentation and Measurement (2001, Vol. 50, pp. 2033€“2040) reported on a study that had analyzed powdered mixtures of coal and limestone for permittivity. The errors in the density measurement was the response. The data are reported in Table
An article in Cancer Epidemiology, Biomarkers and Prevention (1996, Vol. 5, pp. 849€“852) reported on a pilot study to assess the use of toenail arsenic concentrations as an indicator of ingestion of arsenic-containing water. Twenty-one participants were interviewed regarding use of their
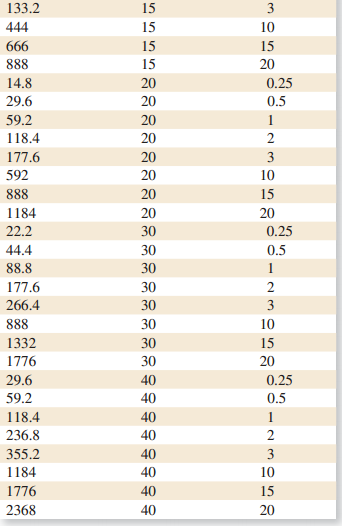
An article in Electronic Packaging and Production (2002, Vol. 42) considered the effect of X-ray inspection of integrated circuits. The rads (radiation dose) were studied as a function of current (in milliamps) and exposure time (in minutes).The data are in Table E12-7.(a) Fit a multiple linear
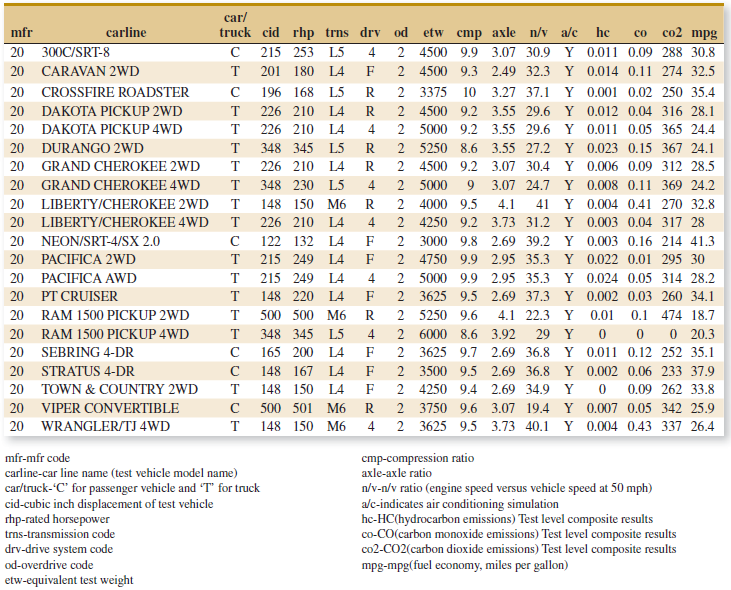
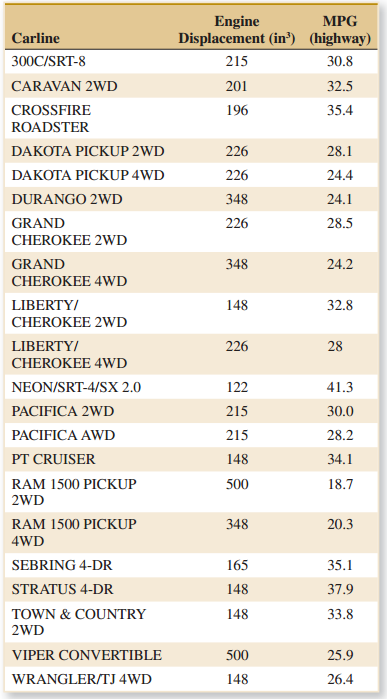
Table E12-3 provides the highway gasoline mileage test results for 2005 model year vehicles from DaimlerChrysler. The full table of data (available on the book€™s Web site) contains the same data for 2005 models from over 250 vehicles from many manufacturers (Environmental Protection
The data from a patient satisfaction survey in a hospital are in Table E12-1.The regressor variables are the patient€™s age, an illness severity index (higher values indicate greater severity), an indicator variable denoting whether the patient is a medical patient (0) or a surgical
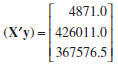
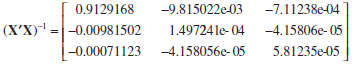
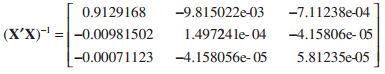
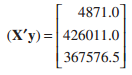
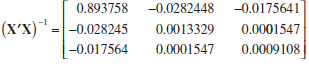
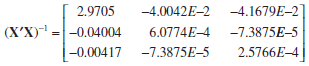
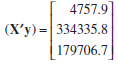
You have fit a multiple linear regression model and the (X'X)ˆ’1matrix is:(a) How many regressor variables are in this model?(b) If the error sum of squares is 307 and there are 15 observations, what is the estimate of σ2?(c) What is the standard error of the regression
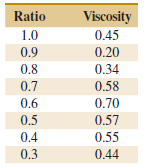
Hsuie, Ma, and Tsai (‘‘Separation and Characterizations of Thermotropic Copolyesters of p-Hydroxybenzoic Acid, Sebacic Acid, and Hydroquinone,’’ (1995, Vol. 56) studied the effect of the molar ratio of sebacic acid (the regressor) on the intrinsic viscosity of copolyesters (the response).
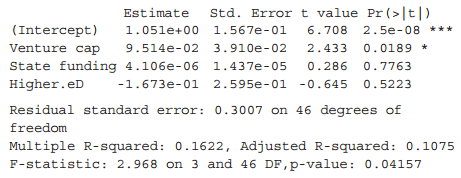
Can the percentage of the workforce who are engineers in each U.S. state be predicted by the amount of money spent in on higher education (as a percent of gross domestic product), on venture capital (dollars per $1000 of gross domestic product) for high-tech business ideas, and state funding (in
A class of 63 students has two hourly exams and a final exam. How well do the two hourly exams predict performance on the final?The following are some quantities of interest:(a) Calculate the least squares estimates of the slopes for hourly 1 and hourly 2 and the intercept.(b) Use the equation of
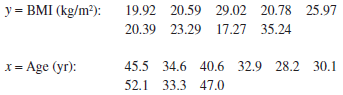
Exercise 11.1 described a regression model between percent of body fat (%BF) as measured by immersion and BMI from a study on 250 male subjects. The researchers also measured 13 physical characteristics of each man, including his age (yrs), height (in), and waist size (in). A regression of percent
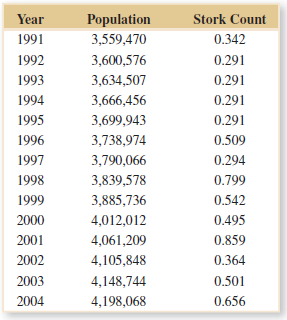
Table E11-21 shows the population and the average count of wood storks sighted per sample period for South Carolina from 1991 to 2004. Fit a regression line with population as the response and the count of wood storks as the predictor. Such an analysis might be used to evaluate the relationship
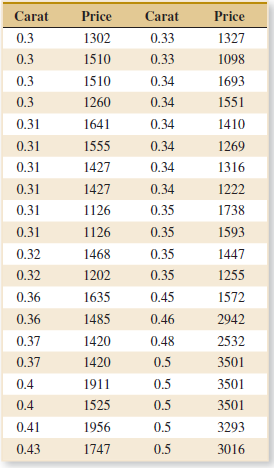
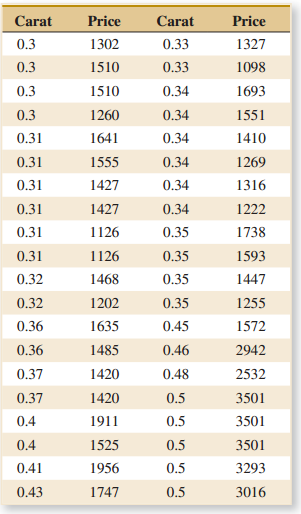
The data in Table E11-20 related diamond carats to purchase prices. It appeared in Singapore€™s Business Times, February 18, 2000.(a) Graph the data. What is the relation between carat and price? Is there an outlier?(b) What would you say to the person who purchased the diamond that was
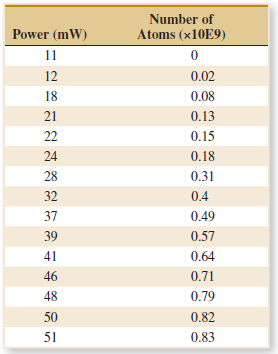
Cesium atoms cooled by laser light could be used to build inexpensive atomic clocks. In a study reported in IEEE Transactions on Instrumentation and Measurement (2001, Vol. 50, pp. 1224€“1228), the number of atoms cooled by lasers of various powers were counted. The data are in Table
Consider the propellant data is Exercise 11-13. Assume that strength less than 2100 psi is considered a failure. Relate propellant age to the probability of failure with a logistic regression model.(a) Does age have a significant effect on the probability of failure at a = 0.05?(b) What is the
The World Health Organization defines obesity in adults as having a body mass index (BMI) higher than 30. Of the 250 men in the study mentioned in Exercise 11-1, 23 are by this definition obese. How good is waist (size in inches) as a predictor of obesity? A logistic regression model was fit to the
The vapor pressure of water at various temperatures is in Table E11-11:(a) Draw a scatter diagram of these data. What type of relationship seems appropriate in relating y to x?(b) Fit a simple linear regression model to these data.(c) Test for significance of regression using α =
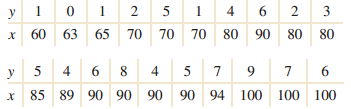
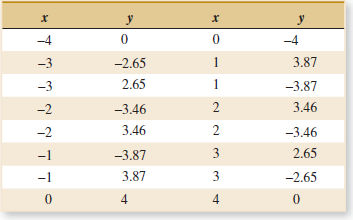
Consider the (x, y) data in Table E11-10. Calculate the correlation coefficient. Graph the data and comment on the relationship between x and y. Explain why the correlation coefficient does not detect the relationship between x and y. 1 4 6 2 3 1 1 65 70 70 70 80 90 90 80 80 x 60 63 5 4 6 8 4 90 90
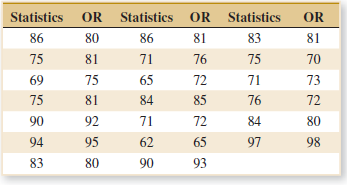
Refer to the NFL quarterback ratings data in Exercise 11-5.(a) Estimate the correlation coefficient between the ratings and the average yards per attempt.(b) Test the hypothesis H0: Ï = 0 versus H1: Ï ‰ 0 using α = 0.05. What is the P-value for this
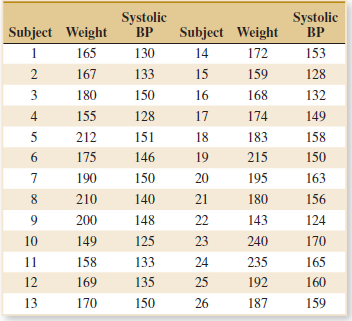
The weight and systolic blood pressure of 26 randomly selected males in the age group 25 to 30 are shown in the Table E11-8. Assume that weight and blood pressure are jointly normally distributed.TABLE 11-6 Water DataTABLE 11-7 Exam Grades(a) Find a regression line relating systolic blood pressure
Repeat Exercise 11-60 using an error term with a standard deviation of 4. What impact has increasing the error standard deviation had on the values of R2?(a) Fit the linear regression model by least squares and find the estimates of the slope and intercept.(b) Find the estimate of σ2.(c) Find the
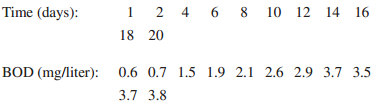
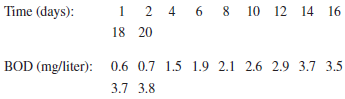
Refer to the data in Exercise 11-15 on oxygen demand. Find a 99% confidence interval on each of the following:(a) β1 (b) β0(c) Find a 95% confidence interval on mean BOD when the time is eight days.In ExerciseAn article in the Journal of the Environmental Engi-neering
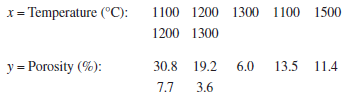
Refer to the data in Exercise 11-14 on the microstructure of zirconia. Find a 95% confidence interval on each of the following:(a) Slope(b) Intercept(c) Mean length when x = 1500(d) Find a 95% prediction interval on length when x = 1500. Explain why this interval is wider than the interval in part
Show that by expanding etXin a power series and taking expectations term by term we may write the momentgenerating function asThus, the coefficient of tr / r! in this expansion is μr€², the rth origin moment. Write the power series expansion for MX (t) for a gamma random
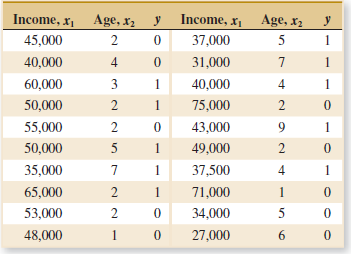
A study was performed to investigate new automobile purchases. A sample of 20 families was selected. Each family was surveyed to determine the age of their oldest vehicle and their total family income. A follow-up survey was conducted six months later to determine if they had actually purchased a
Consider the simple linear regression model Y = β0 + β1x + ε, with E(e) = 0, V(e) = σ2, and the errors e uncorrelated.(a) Show that E(σ̂) = E(MSE) σ2. (b) Show that E(MSR) = σ2 + β12 Sxx.
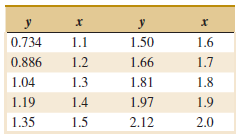
Consider the following data. Suppose that the relation - ship between Y and x is hypothesized to be Y = (β0+ β1x + e)ˆ’ . 1 Fit an appropriate model to the data. Does the assumed model form seem reasonable? 15 12 10 х 18 11 8. 0.13 0.09 0.15 0.20 0.21 0.18 0.24 0.1
An article in the IEEE Transactions on Instrumentation and Measurement [€œDirect, Fast, and Accurate Measurement of VTand K of MOS Transistor Using VT-Sift Circuit€ (1991, Vol. 40, pp. 951€“955)] described the use of a simple linear regression model to express drain
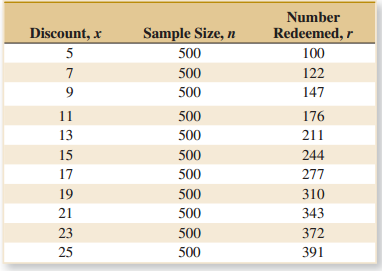
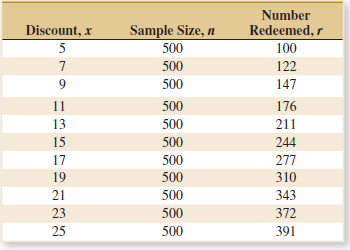
The market research department of a soft drink manufacturer is investigating the effectiveness of a price discount coupon on the purchase of a two-liter beverage product. A sample of 5500 customers was given coupons for varying price discounts between 5 and 25 cents. The response variable was the
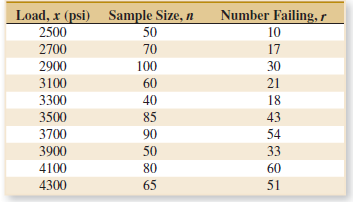
The compressive strength of an alloy fastener used in aircraft construction is being studied. Ten loads were selected over the range 2500€“4300 psi, and a number of fasteners were tested at those loads. The numbers of fasteners failing at each load were recorded. The complete test data
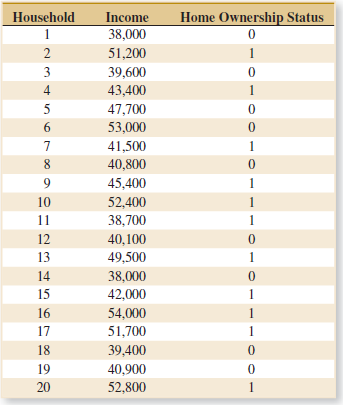
A study was conducted attempting to relate home ownership to family income. Twenty households were selected and family income was estimated along with information concerning home ownership (y = 1 indicates yes and y = 0 indicates no). The data are shown in Table E11-13.(a) Fit a logistic regression
Determine if the following models are intrinsically linear. If yes, determine the appropriate transformation to generate the linear model.(a) Y = β0 xβ1 ε(b) Y = 3 + 5x/x + ε(c) Y = β0 βx1 ε(d) Y = x/β0x + β1 + xε
The monthly absolute estimate of global (land and ocean combined) temperature indexes (degrees C) in 2000 and 2001 (www.ncdc.noaa.gov/oa/climate/) are:(a) Graph the data and fit a regression line to predict 2001 temperatures from those in 2000. Is there a significant regression at α =
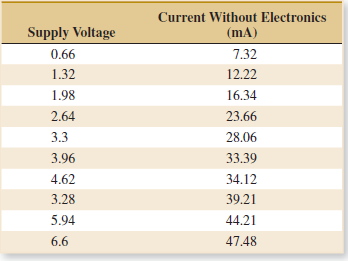
In an article in IEEE Transactions on Instrumentation and Measurement (2001, Vol. 50, pp. 986€“990), researchers reported on a study of the effects of reducing current draw in a magnetic core by electronic means. They measured the current in a magnetic winding with and without the
Suppose that data are obtained from 20 pairs of (x, y) and the sample correlation coefficient is 0.75.(a) Test the hypothesis that H0: ρ = 0 against H1: ρ> 0 with α = 0.05. Calculate the P-value.(b) Test the hypothesis that H1: ρ = 0.5 against H1: ρ> 0.5 with α = 0.05. Calculate the
Suppose that data are obtained from 20 pairs of (x, y) and the sample correlation coefficient is 0.8.(a) Test the hypothesis that H0: ρ = 0 against H1: ρ ≠ 0 with α = 0.05. Calculate the P-value.(b) Test the hypothesis that H1: ρ = 0.5 against H1: ρ ≠ 0.5 with α = 0.05. Calculate the
Studentized Residuals. Show that the variance of the ith residual isThe ith studentized residual is defined as(a) Explain why ri has unit standard deviation.(b) Do the standardized residuals have unit standard deviation?(c) Discuss the behavior of the studentized residual when the sample value xi
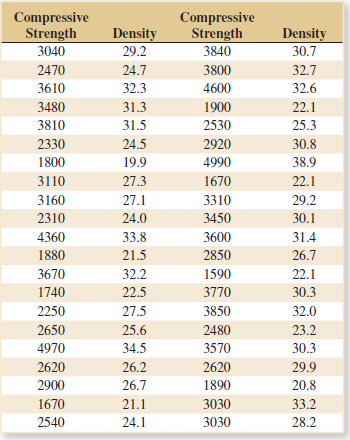
An article in the Journal of the American Statistical Association [€œMarkov Chain Monte Carlo Methods for Computing Bayes Factors: A Comparative Review€ (2001, Vol. 96, pp. 1122€“1132)] analyzed the tabulated data on compressive strength parallel to the grain versus
Refer to the compressive strength data in Exercise 11-3. Use the summary statistics provided to calculate R2 and provide a practical interpretation of this quantity.Exercise 11-3An article in Concrete Research [“Near Surface Characteristics of Concrete: Intrinsic Permeability” (1989, Vol. 41)]
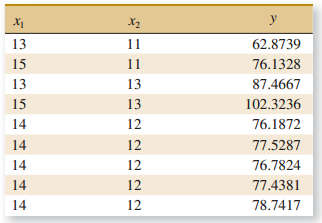
Consider the simple linear regression model y = 10 + 30x + ε where the random error term is normally and independently distributed with mean zero and standard deviation 1. Use software to generate a sample of eight observations, one each at the levels x = 10, 12, 14, 16, 18, 20, 22, and 24.(a) Fit
Refer to the NFL quarterback ratings data in Exercise 11-5. Find a 95% confidence interval on each of the following:(a) Slope (b) Intercept(c) Mean rating when the average yards per attempt is 8.0(d) Find a 95% prediction interval on the rating when the average yards per attempt is
Using the regression from Exercise 11-2,(a) Find a 95% confidence interval for the slope.(b) Find a 95% confidence interval for the mean weight for a man 25 years old.(c) Find a 95% prediction interval for the weight of a 25 year old man.(d) Which interval is wider, the confidence interval or the
Using the regression from Exercise 11-1,(a) Find a 95% confidence interval for the slope.(b) Find a 95% confidence interval for the mean percent body fat for a man with a BMI of 25.(c) Find a 95% prediction interval for the percent body fat for a man with a BMI of 25.(d) Which interval is wider,
Consider the data in Exercise 11-15 on y = oxygen demand and x = time.(a) Test for significance of regression using α = 0.01. Find the P-value for this test. What conclusions can you draw?(b) Estimate the standard errors of the slope and intercept.(c) Test the hypothesis that β0 = 0.
An article in The Journal of Clinical Endocrinology and Metabolism [€œSimultaneous and Continuous 24-Hour Plasma and Cerebrospinal Fluid Leptin Measurements: Dissociation of Concentrations in Central and Peripheral Compartments€ (2004, Vol. 89, pp. 258€“265)] reported
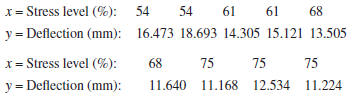
Consider the data in Exercise 11-16 on y = deflection and x = stress level.(a) Test for significance of regression using α = 0.01. What is the P-value for this test? State the conclusions that result from this test.(b) Does this model appear to be adequate?(c) Estimate the standard errors of the
Consider the data from Exercise 11-9 on y = green liquor Na2S concentration and x = production in a paper mill.(a) Test for significance of regression using α = 0.05. Find the P-value for this test.(b) Estimate the standard errors of the slope and intercept.(c) Test H0: β0 = 0 versus H1: β0 ≠
Consider the National Football League data in Exercise 11-5.(a) Test for significance of regression using α = 0.01. Find the P-value for this test. What conclusions can you draw?(b) Estimate the standard errors of the slope and intercept. (c) Test H0: β1 = 10 versus H1: β1 ≠ 10 with α =
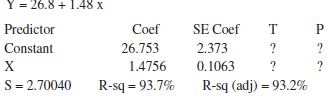
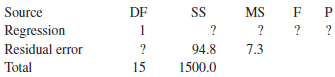
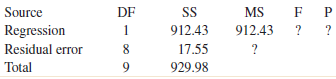
Consider the following computer output.The regression equation isAnalysis of Variance(a) Fill in the missing information. You may use bounds for the P-values.(b) Can you conclude that the model defines a useful linear relationship?(c) What is your estimate of σ2? = 26.8 + 1.48 x Y Coef
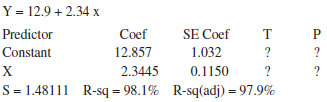
Consider the following computer output. The regression equation isAnalysis of Variance(a) Fill in the missing information. You may use bounds for the P-values.(b) Can you conclude that the model defines a useful linear relationship?(c) What is your estimate of σ2? Y = 12.9 + 2.34 x
Consider the simple linear regression model y = 10 + 25x + ε where the random error term is normally and independently distributed with mean zero and standard deviation 2. Use software to generate a sample of eight observations, one each at the levels x = 10, 12, 14, 16, 18, 20, 22, and 24.(a) Fit
Suppose that in Exercise 11-24 weight is measured in kg instead of lbs.(a) How will the estimates of the slope and intercept change?(b) Estimate the error standard deviation.(c) Estimate the standard deviation of the slope.(d) What is the value of the t-statistic for the slope? Compare your answer
Recall the regression of weight on age from Exercise 11-2.(a) Estimate the error standard deviation.(b) Estimate the standard deviation of the slope.(c) What is the value of the t-statistic for the slope?(d) Test the hypothesis that β1 = 0 at α = 0.05. What is the P-value
Recall the regression of percent body fat on BMI from Exercise 11-1.(a) Estimate the error standard deviation.(b) Estimate the standard deviation of the slope.(c) What is the value of the t-statistic for the slope?(d) Test the hypothesis that β1 = 0 at α = 0.05. What is the P-value for this test?
Suppose that we wish to fit a regression model for which the true regression line passes through the point (0, 0). The appropriate model is Y = βx + ε. Assume that we have n pairs of data (x1, y1), (x2, y2), . . . , (xn, yn).(a) Find the least squares estimate of
Consider the regression model developed in Exercise 11-8. Suppose that engine displacement is measured in cubic centimeters instead of cubic inches.(a) Write the new regression model.(b) What change in gasoline mileage is associated with a 1 cm3 change is engine displacement?
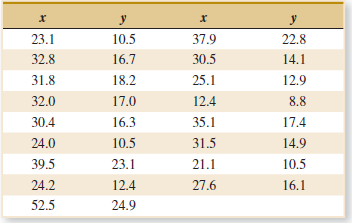
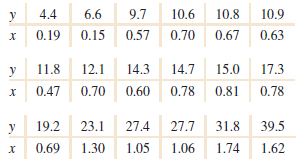
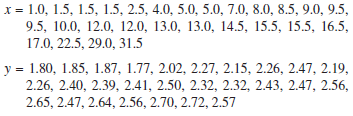
In an article in Statistics and Computing [€œAn Iterative Monte Carlo Method for Nonconjugate Bayesian Analysis€ (1991, pp. 119€“128)], Carlin and Gelfand investigated the age (x) and length (y) of 27 captured dugongs (sea cows).(a) Find the least squares estimates of
An article in Wood Science and Technology [€œCreep in Chipboard, Part 3: Initial Assessment of the Influence of Moisture Content and Level of Stressing on Rate of Creep and Time to Failure€ (1981, Vol. 15, pp. 125€“144)] reported a study of the deflection (mm) of
An article in the Journal of the Environmental Engineering Division [€œLeast Squares Estimates of BOD Parameters€ (1980, Vol. 106, pp. 1197€“1202)] took a sample from the Holston River below Kingport, Tennessee, during August 1977. The biochemical oxygen demand (BOD)
An article in the Journal of the American Ceramic Society [€œRapid Hot-Pressing of Ultrafi ne PSZ Powders€ (1991, Vol. 74, pp. 1547€“1553)] considered the microstructure of the ultrafi ne powder of partially stabilized zirconia as a function of temperature. The data
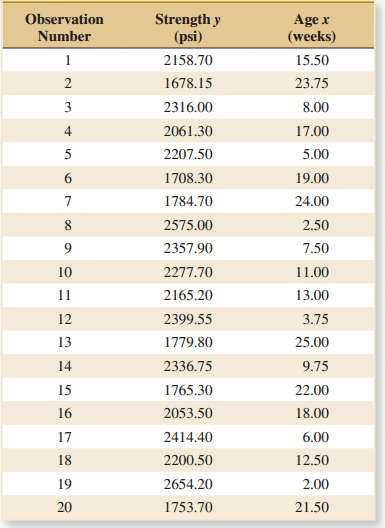
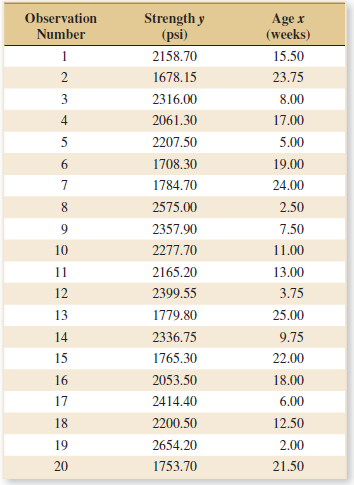
A rocket motor is manufactured by bonding together two types of propellants, an igniter and a sustainer. The shear strength of the bond y is thought to be a linear function of the age of the propellant x when the motor is cast. Table E11-4 provides 20 bservations.(a) Draw a scatter diagram of the
Table E11-3 presents the highway gasoline mileage performance and engine displacement for DaimlerChrysler vehicles for model year 2005 (U.S. Environmental Protection Agency).(a) Fit a simple linear model relating highway miles per gallon (y) to engine displacement (x) in cubic inches using least
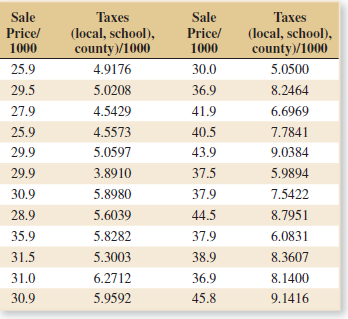
An article in Technometrics by S. C. Narula and J. F. Wellington [€œPrediction, Linear Regression, and a Minimum Sum of Relative Errors€ (1977, Vol. 19)] presents data on the selling price and annual taxes for 24 houses. The data are in the Table E11-2.(a) Assuming that a
See Table E11-1 for data on the ratings of quarterbacks for the 2008 National Football League season (The Sports Network). It is suspected that the rating (y) is related to the average number of yards gained per pass attempt (x).(a) Calculate the least squares estimates of the slope and intercept.
An article in Concrete Research [“Near Surface Characteristics of Concrete: Intrinsic Permeability” (1989, Vol. 41)] presented data on compressive strength x and intrinsic permeability y of various concrete mixes and cures. Summaryquantities are n = 14,Σyi = 572, Σyi2 = 23,530,Σxi = 43,
Showing 200 - 300
of 1157
1
2
3
4
5
6
7
8
9
10
11
12
Step by Step Answers