New Semester
Started
Get
50% OFF
Study Help!
--h --m --s
Claim Now
Question Answers
Textbooks
Find textbooks, questions and answers
Oops, something went wrong!
Change your search query and then try again
S
Books
FREE
Study Help
Expert Questions
Accounting
General Management
Mathematics
Finance
Organizational Behaviour
Law
Physics
Operating System
Management Leadership
Sociology
Programming
Marketing
Database
Computer Network
Economics
Textbooks Solutions
Accounting
Managerial Accounting
Management Leadership
Cost Accounting
Statistics
Business Law
Corporate Finance
Finance
Economics
Auditing
Tutors
Online Tutors
Find a Tutor
Hire a Tutor
Become a Tutor
AI Tutor
AI Study Planner
NEW
Sell Books
Search
Search
Sign In
Register
study help
mathematics
applied statistics and probability
Applied Statistics And Probability For Engineers 6th Edition Douglas C. Montgomery, George C. Runger - Solutions
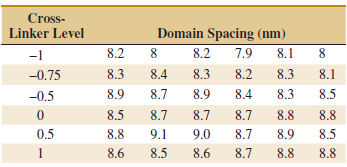
An article in Quality Engineering [€œEstimating Sources of Variation: A Case Study from Polyurethane Product Research€ (1999€“2000,)] reported a study on the effects of additives on final polymer properties. In this case, polyurethane additives were referred to as
An article in Nature describes an experiment to investigate the effect on consuming chocolate on cardiovascular health (“Plasma Antioxidants from Chocolate,” 2003, Vol. 424,). The experiment consisted of using three different types of chocolates: 100 g of dark chocolate, 100 g of dark chocolate
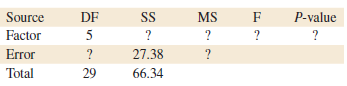
Consider the following computer output for an experiment.(a) How many replicates did the experimenter use?(b) Fill in the missing information in the ANOVA table. Use bounds for the P-value.(c) What conclusions can you draw about differences in the factor-level means?(d) Compute an estimate for
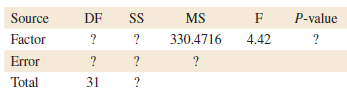
Consider the following computer output for an experiment.The factor was tested over four levels.(a) How many replicates did the experimenter use?(b) Fill in the missing information in the ANOVA table. Use bounds for the P-value.(c) What conclusions can you draw about differences in the factor-level
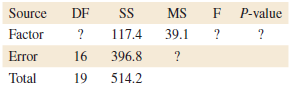
Consider the following computer output.(a) How many levels of the factor were used in this experiment?(b) How many replicates did the experimenter use?(c) Fill in the missing information in the ANOVA table. Use bounds for the P-value.(d) What conclusions can you draw about differences in the
Using the data from Exercise 6-22 on cloud seeding,(a) Find the median and quartiles for the unseeded cloud data.(b) Find the median and quartiles for the seeded cloud data.(c) Make two side-by-side box plots, one for each group on the same plot.(d) Compare the distributions from what you can see
Using the data from Exercise 6-24 on swim times,(a) Find the median and quartiles for the data.(b) Make a box plot of the data.(c) Repeat (a) and (b) for the data without the extreme outlier and comment.(d) Compare the distribution of the data with and without the extreme outlier.Data from 6-24
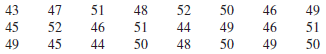
The following data are the temperatures of effluent at discharge from a sewage treatment facility on consecutive days:(a) Calculate the sample mean, sample median, sample variance, and sample standard deviation.(b) Construct a box plot of the data and comment on the information in this display. 50
The National Oceanic and Atmospheric Administration provided the monthly absolute estimates of global (land and ocean combined) temperature index (degrees C) from 2000. Read January to December from left to right in www.ncdc.noaa.gov/oa/climate/research/anomalies/anomalies. html). Construct and
It is possible to obtain a “quick-and-dirty” estimate of the mean of a normal distribution from the 50th percentile value on a normal probability plot. Provide an argument why this is so. It is also possible to obtain an estimate of the standard deviation of a normal distribution by subtracting
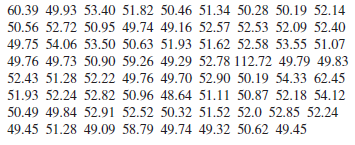
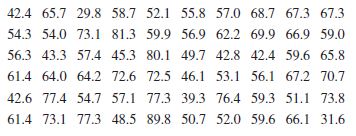
Construct a normal probability plot of the suspended solids concentration data in Exercise 6-40. Does it seem reasonable to assume that the concentration of suspended solids in water from this particular lake is normally distributed?Data from 6-40 42.4 65.7 29.8 58.7 52.1 55.8 57.0 68.7 67.3 67.3
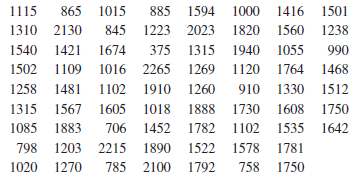
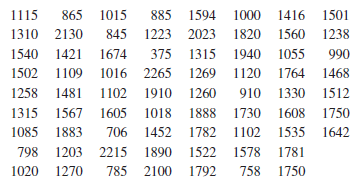
Construct a normal probability plot of the cycles to failure data in Exercise 6-31. Does it seem reasonable to assume that cycles to failure is normally distributed?Data from 6-31 1115 865 1015 885 1594 1000 1416 1501 1310 2130 845 1223 2023 1820 1560 1238 1540 1421 1674 375 1315 1940 1055 990 1502
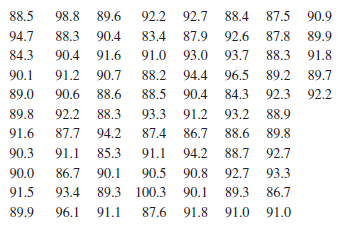
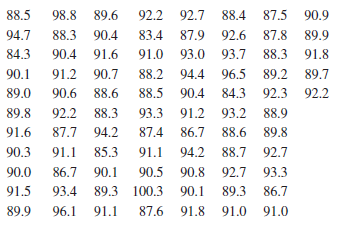
Construct a normal probability plot of the octane rating data in Exercise 6-30. Does it seem reasonable to assume that octane rating is normally distributed?Data from 6-30 88.5 98.8 89.6 92.2 92.7 88.4 87.5 90.9 88.3 90.4 94.7 83.4 87.9 92.6 87.8 89.9 84.3 90.4 91.6 91.0 93.0 93.7 88.3 91.8 90.1
Construct a normal probability plot of the O-ring joint temperature data in Exercise 6-19. Does it seem reasonable to assume that O-ring joint temperature is normally distributed? Discuss any interesting features that you see on the plot.Data from 6-19The following data are the joint temperatures
Construct a normal probability plot of the solar intensity data in Exercise 6-12. Does it seem reasonable to assume that solar intensity is normally distributed?Data from 6-12The following data are direct solar intensity measurements (watts/m2) on different days at a location in southern Spain:
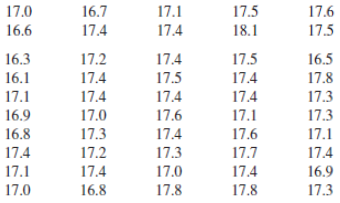
Construct a normal probability plot of the visual accommodation data in Exercise 6-11. Does it seem reasonable to assume that visual accommodation is normally distributed?Data from 6-11An article in Human Factors (June 1989) presented data on visual accommodation (a function of eye movement) when
Construct a normal probability plot of the insulating fluid breakdown time data in Exercise 6-8. Does it seem reasonable to assume that breakdown time is normally distributed?Data from 6-8In Applied Life Data Analysis (Wiley, 1982), Wayne Nelson presents the breakdown time of an insulating fluid
Construct a normal probability plot of the piston ring diameter data in Exercise 6-7. Does it seem reasonable to assume that piston ring diameter is normally distributed?Data from 6-7Eight measurements were made on the inside diameter of forged piston rings used in an automobile engine. The data
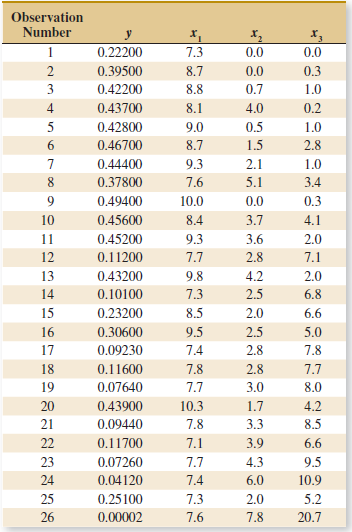
An article in the Journal of Pharmaceuticals Sciences (1991, Vol. 80, pp. 971€“977) presented data on the observed mole fraction solubility of a solute at a constant temperature and the dispersion, dipolar, and hydrogen-bonding Hansen partial solubility parameters. The data are as shown
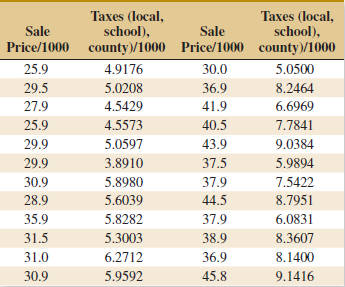
An article in Technometrics by S. C. Narula and J. F. Wellington [€œPrediction, Linear Regression, and a Minimum Sum of Relative Errors€ (1977, Vol. 19)] presents data on the selling price and annual taxes for 24 houses. The data are shown in Table 6E.7.Table 6E.7(a) Construct
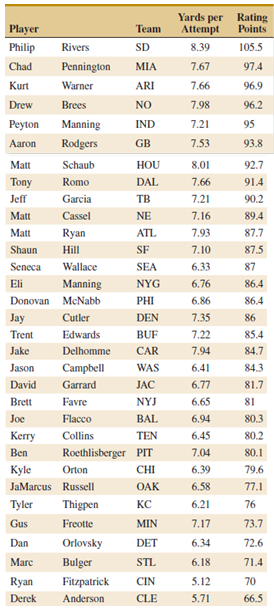
Table 6E.6 presents data on the ratings of quarterbacks for the 2008 National Football League season (source: The Sports Network). It is suspected that the rating (y) is related to the average number of yards gained per pass attempt (x). (a) Construct a scatter plot of quarterback rating
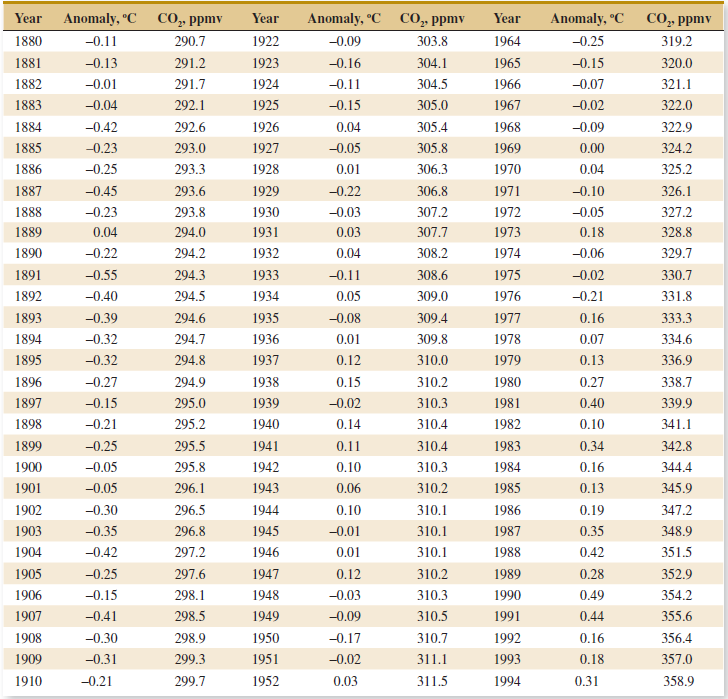
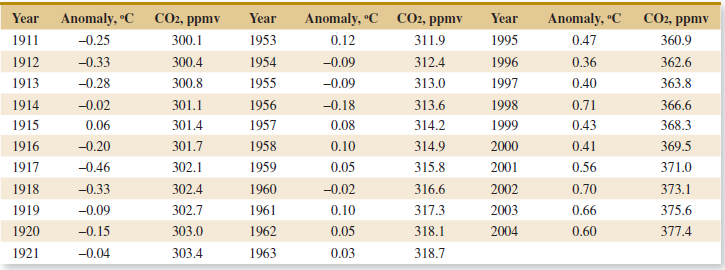
Table 6E.5 contains the global mean surface air temperature anomaly and the global CO2concentration for the years 1880€“2004. The temperature is measured at a number of locations around the world and averaged annually, and then subtracted from a base period average (1951€“1980)
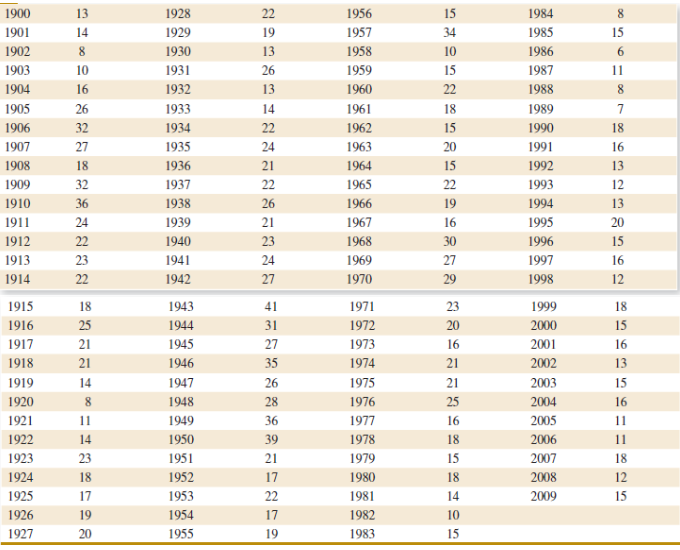
Table 6E.3 shows the number of earthquakes per year of magnitude 7.0 and higher since 1900 (source: Earthquake Data Base System of the U.S. Geological Survey, National Earthquake Information Center, Golden, Colorado). Construct and interpret either a digidot plot or a separate stemand - leaf and
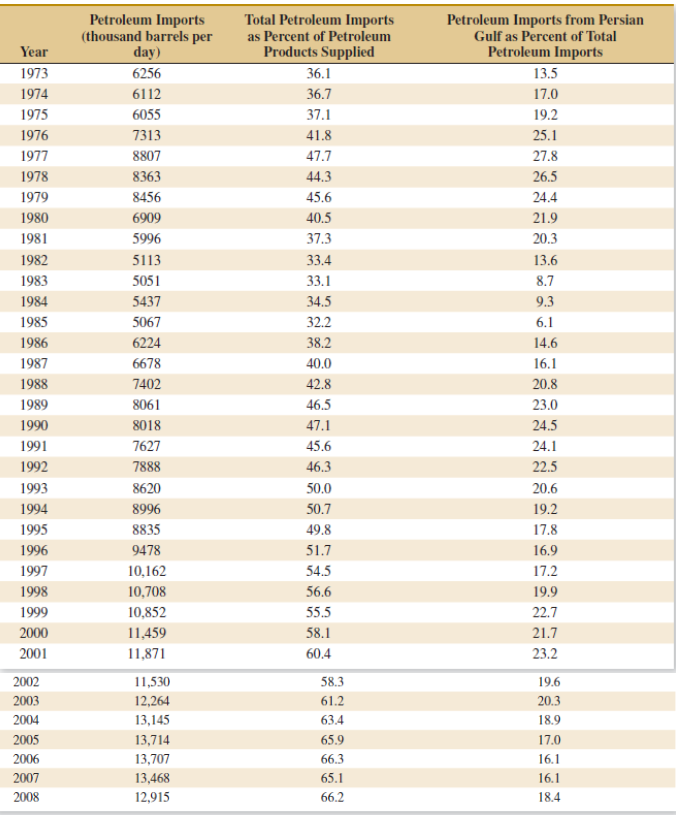
Table 6E.4 shows U.S. petroleum imports as a percentage of the totals, and Persian Gulf imports as a percentage of all imports by year since 1973 (source: U.S. Department of Energy Web site, www.eia.doe.gov/). Construct and interpret either a digidot plot or a separate stem-and-leaf and time series
The 100 annual Wolfer sunspot numbers from 1770 to 1869 follow. (For an interesting analysis and interpretation of these numbers, see the book by Box, Jenkins, and Reinsel referenced in Exercise 6-84. Their analysis requires some advanced knowledge of statistics and statistical model building.)
In their book Time Series Analysis, Forecasting, and Control (Prentice Hall, 1994), G. E. P. Box, G. M. Jenkins, and G. C. Reinsel present chemical process concentration readings made every two hours. Some of these data follow (read down, then left to right).Construct and interpret either a digidot
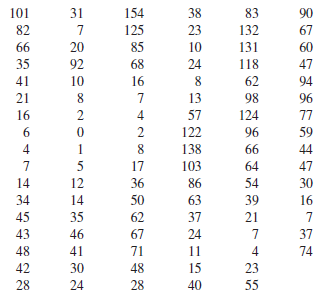
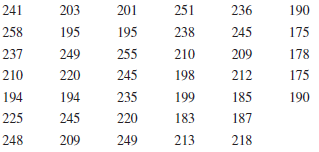
The pull-off force for a connector is measured in a laboratory test. Data for 40 test specimens follow (read down, then left to right). Construct and interpret either a digidot plot or a separate stem-and-leaf and time series plot of the data. 241 203 201 251 236 190 258 195 195 238 245 175 237 249
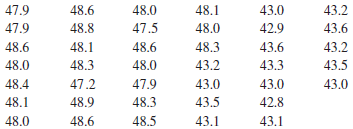
The following data are the viscosity measurements for a chemical product observed hourly (read down, then left to right). Construct and interpret either a digidot plot or a separate stem-and-leaf and time series plot of these data. Specifications on product viscosity are at 48 ± 2. What
In Exercise 6-69, data were presented on the cold start ignition time of a particular gasoline used in a test vehicle. A second formulation of the gasoline was tested in the same vehicle, with the following times (in seconds): 1.83, 1.99, 3.13, 3.29, 2.65, 2.87, 3.40, 2.46, 1.89, and 3.35. Use
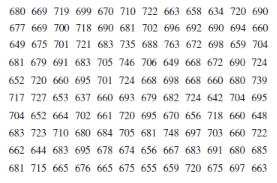
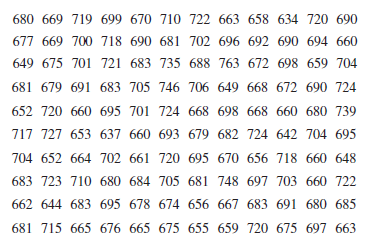
Reconsider the semiconductor speed data in Exercise 6-42. Construct a box plot of the data and write an interpretation of the plot. How does the box plot compare in interpretive value to the original stem-and-leaf diagram?Data from 6-42 680 669 719 699 670 710 722 663 658 634 720 690 677 669 700
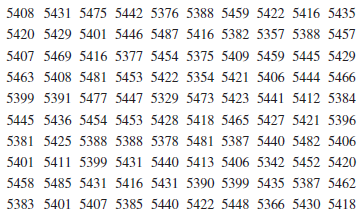
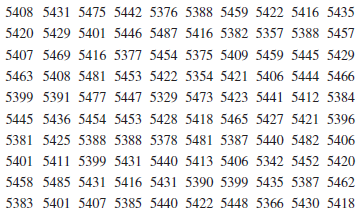
Reconsider the weld strength data in Exercise 6-39. Construct a box plot of the data and write an interpretation of the plot. How does the box plot compare in interpretive value to the original stem-and-leaf diagram?Data from 6-39 5408 5431 5475 5442 5376 5388 5459 5422 5416 5435 5420 5429 5401
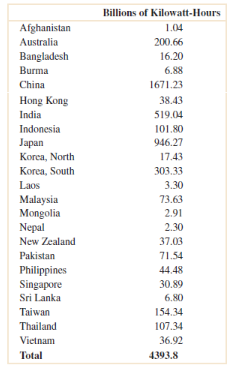
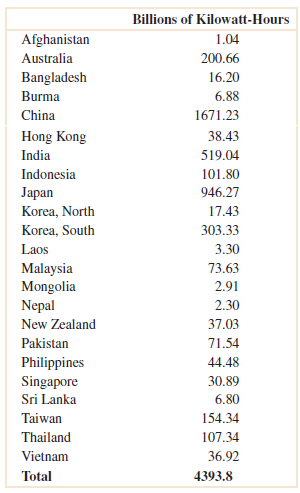
Reconsider the energy consumption data in Exercise 6-37. Construct a box plot of the data and write an interpretation of the plot. How does the box plot compare in interpretive value to the original stem-and-leaf diagram?Data from 6-37 Billions of Kilowatt-Hours Afghanistan 1.04 Australia 200.66
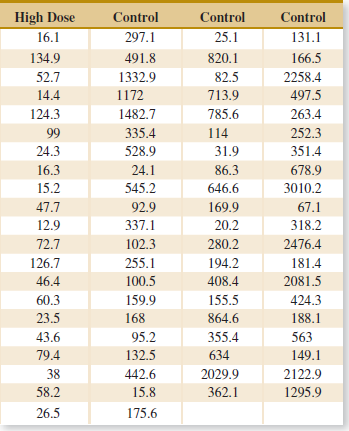
An article in Nature Genetics [€œTreatment-specifi c Changes in Gene Expression Discriminate in Vivo Drug Response in Human Leukemia Cells€ (2003, Vol. 34(1), pp. 85€“90)] studied gene expression as a function of treatments for leukemia. One group received a high dose
Exercise 6-19 presented the joint temperatures of the O-rings (°F) for each test firing or actual launch of the space shuttle rocket motor. In that exercise, you were asked to find the sample mean and sample standard deviation of temperature.(a) Find the median and the upper and lower quartiles of
The nine measurements that follow are furnace temperatures recorded on successive batches in a semiconductor manufacturing process (units are °F): 953, 950, 948, 955, 951, 949, 957, 954, 955. (a) Calculate the sample mean, sample variance, and standard deviation.(b) Find the median. How much
An article in Transactions of the Institution of Chemical Engineers (1956, Vol. 34, pp. 280–293) reported data from an experiment investigating the effect of several process variables on the vapor phase oxidation of naphthalene. A sample of the percentage mole conversion of naphthalene to maleic
Construct a histogram for the pinot noir wine rating data in Exercise 6-43. Comment on the shape of the histogram. Does it convey the same information as the stem-andleaf display?Data from 6-43 91 90 86 91 92 91 86 89 91 94 90 93 90 88 95 92 87 89 90 88 91 89 92 89 95 90 91 87 89 92 84 88 85
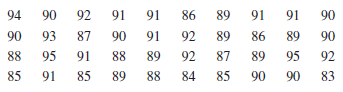
Construct a histogram for the semiconductor speed data in Exercise 6-42. Comment on the shape of the histogram. Does it convey the same information as the stem-andleaf display?Data from 6-42 680 669 719 699 670 710 722 663 658 634 720 690 677 669 700 718 690 681 702 696 692 690 694 660 649 675 701
Construct a histogram for the spot weld shear strength data in Exercise 6-39. Comment on the shape of the histogram. Does it convey the same information as the stem-and-leaf display?Data from 6-39 5408 5431 5475 5442 5376 5388 5459 5422 5416 5435 5420 5429 5401 5446 5487 5416 5382 5357 5388 5457
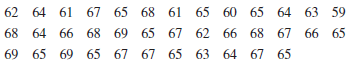
Construct a histogram for the female student height data in Exercise 6-38.Data from 6-38 62 64 61 67 65 68 61 65 60 65 64 63 59 65 67 62 66 68 67 66 65 67 65 68 64 66 68 69 69 65 69 65 67 67 65 63 4 67
Construct a histogram for the energy consumption data in Exercise 6-37.Data from 6-37 Billions of Kilowatt-Hours Afghanistan 1.04 Australia 200.66 Bangladesh 16.20 6.88 Burma 1671.23 China 38.43 Hong Kong India 519.04 Indonesia 101.80 Japan Korea, North Korea, South 946.27 17.43 303.33 3.30 Laos
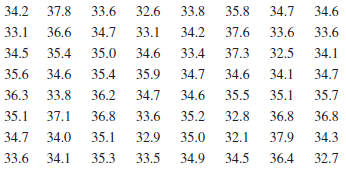
Construct histograms with 8 and 16 bins for the data in Exercise 6-32. Compare the histograms. Do both histograms display similar information?Data from 6-32 37.8 33.6 34.2 32.6 33.8 35.8 34.7 34.6 33.1 33.1 36.6 34.7 34.2 37.6 33.6 33.6 34.5 35.4 35.0 34.6 33.4 37.3 32.5 34.1 35.6 34.6 35.4 35.9
Construct histograms with 8 and 16 bins for the data in Exercise 6-31. Compare the histograms. Do both histograms display similar information?Data from 6-31 1115 865 1015 885 1594 1000 1416 1501 1310 2130 845 1223 2023 1820 1560 1238 1540 1421 1674 375 1315 1940 1055 990 1502 1109 1016 2265 1269
Construct frequency distributions and histograms with 8 bins and 16 bins for the motor fuel octane data in Exercise 6-30. Compare the histograms. Do both histograms display similar information?Data from 6-30 88.5 98.8 89.6 92.2 92.7 88.4 87.5 90.9 94.7 88.3 90.4 83.4 87.9 92.6 87.8 89.9 84.3 90.4
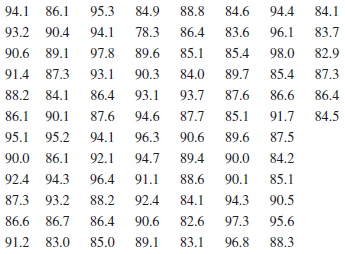
Construct a frequency distribution and histogram for the yield data in Exercise 6-33.Data from 6-33 94.1 86.1 95.3 84.9 88.8 84.6 94.4 84.1 78.3 93.2 90.4 94.1 86.4 83.6 96.1 83.7 89.6 98.0 90.6 89.1 97.8 85.1 85.4 82.9 91.4 87,3 89.7 87.3 93.1 90.3 84.0 85.4 87.6 88.2 84.1 86.4 93.1 93.7 86.6 86.4
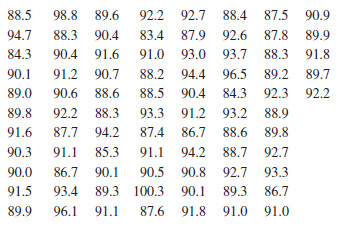
Construct a frequency distribution and histogram for the cotton content data in Exercise 6-32.Data from 6-32 88.5 98.8 89.6 92.2 92.7 88.4 87.5 90.9 94.7 89.9 88.3 90.4 83.4 87.9 92.6 87.8 84.3 90.4 91.6 91.0 93.0 93.7 88.3 91.8 90.1 96.5 91.2 90.7 88.2 94.4 89.2 89.7 89.0 90.6 88.6 88.5 90.4 84.3
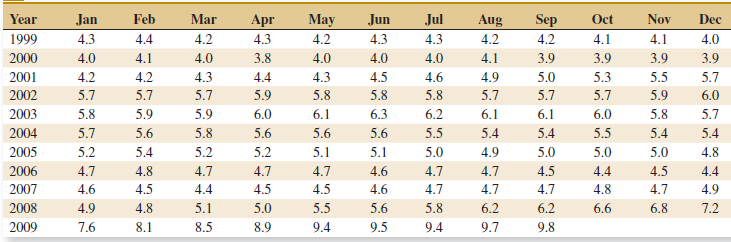
Table 6E.10 shows unemployment data for the United States that are seasonally adjusted. Construct a time series plot of these data and comment on any features (source: U.S. Bureau of Labor Web site, http://data.bls.gov).Table 6E.10 Year 1999 2000 2001 2002 2003 2004 2005 2006 2007 2008 2009 Mar May
A sample of six resistors yielded the following resistances (ohms): x1 = 45, x2 = 38, x3 = 47, x4 = 41, x5 = 35, and x6 = 43.(a) Compute the sample variance and sample standard deviation.(b) Subtract 35 from each of the original resistance measurements and compute s2 and s. Compare your results
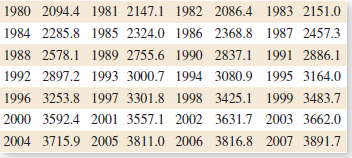
The total net electricity consumption of the United States by year from 1980 to 2007 (in billion kilowatt-hours) is in Table 6E.12. Net consumption excludes the energy consumed by the generating units.TABLE ˆ™ 6E.12 U.S. Electricity ConsumptionConstruct a time series plot of
The rate of return of an asset is the change in price divided by the initial price (denoted as r ). Suppose that $10,000 is used to purchase shares in three stocks with rates of returns X1,X2,X3. Initially, $2500, $3000, and $4500 are allocated to each one, respectively. After one year, the
In Exercise 5-31, the monthly demand for MMR vaccine was assumed to be approximately normally distributed with a mean and standard deviation of 1.1 and 0.3 million doses, respectively. Suppose that the demands for different months are independent, and let Z denote the demand for a year (in millions
Three electron emitters produce electron beams with changing kinetic energies that are uniformly distributed in the ranges [3,7], [2,5], and [4,10]. Let Y denote the total kinetic energy produced by these electron emitters. (a) Suppose that the three beam energies are independent. Determine
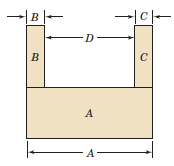
A U-shaped component is to be formed from the three parts A, B, and C. See Fig. 5-18. The length of A is normally distributed with a mean of 10 mm and a standard deviation of 0.1 mm. The thickness of parts B and C is normally distributed with a mean of 2 mm and a standard deviation of 0.05 mm.
For the Transaction Processing Performance Council’s benchmark in Exercise 5-10, let X, Y, and Z denote the average number of selects, updates, and inserts operations required for each type of transaction, respectively. Calculate the following: (a) Covariance between X and Y(b) Correlation
Patients are given a drug treatment and then evaluated. Symptoms either improve, degrade, or remain the same with probabilities 0.4, 0.1, 0.5, respectively. Assume that four independent patients are treated and let X and Y denote the number of patients who improve or degrade. Are X and Y
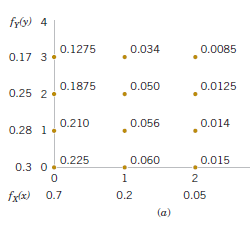
Determine the covariance and correlation for the joint probability distribution shown in Fig. 5-10(a) and described in Example 5-10.In figure 5-10 fy(y) 4 0.034 0.1275 0.0085 0.17 3 0.1875 0.050 0.0125 0.25 2 . 0.210 0.056 0.014 0.28 1. 0.225 0.060 0.015 0.3 0. 2 fx(x) 0.7 0.2 0.05 (a)
The systolic and diastolic blood pressure values (mm Hg) are the pressures when the heart muscle contracts and relaxes (denoted as Y and X, respectively). Over a collection of individuals, the distribution of diastolic pressure is normal with mean 73 and standard deviation 8. The systolic pressure
An article in Health Economics [€œEstimation of the Transition Matrix of a Discrete-Time Markov Chain€ (2002, Vol.11, pp. 33€“42)] considered the changes in CD4 white blood cell counts from one month to the next. The CD4 count is an important clinical measure to
An article in Clinical Infectious Diseases [“Strengthening the Supply of Routinely Administered Vaccines in the United States: Problems and Proposed Solutions” (2006, Vol.42(3), pp. S97–S103)] reported that recommended vaccines for infants and children were periodically unavailable or in
The lengths of the minor and major axes are used to summarize dust particles that are approximately elliptical in shape. Let X and Y denote the lengths of the minor and major axes (in micrometers), respectively. Suppose that fX (x) = exp(−x),0 < x and the conditional distribution fY|x (y) =
Determine the value of c that makes fXYZ (x, y, z) = c a joint probability density function over the region x > 0, y > 0, z > 0, and x + y + z < 1.Determine the following:(a) P(X <0.5, Y <0.5, Z <0.5) (b) P(X <0.5, Y <0.5)(c) P(X <0.5) (d) E(X)(e) Marginal
Suppose that the random variables X, Y, and Z have the joint probability density function fXYZ (x, y, z) = c over the cylinder x2 + y2 < 4 and 0 < z < 4. Determine the constant c so that fXYZ (x, y, z) is a probability density function.Determine the following:(a) P(X2 + Y2 <2) (b)
Suppose that the random variables X, Y, and Z have the joint probability density function f (x, y, z) = 8xyz for 0 < x < 1, 0 < y < 1, and 0 < z < 1. Determine the following:(a) P(X <0.5) (b) P(X <0.5, Y <0.5)(c) P(Z <2) (d) P(X <0.5 or Z <2)(e)
The blade and the bearings are important parts of a lathe. The lathe can operate only when both of them work properly. The lifetime of the blade is exponentially distributed with the mean three years; the lifetime of the bearings is also exponentially distributed with the mean four years. Assume
Two methods of measuring surface smoothness are used to evaluate a paper product. The measurements are recorded as deviations from the nominal surface smoothness in coded units. The joint probability distribution of the two measurements is a uniform distribution over the region 0 < x < 4, 0
Determine the value of c that makes the function f (x, y) = ce−2x−3y, a joint probability density function over the range 0 < x and x < y.Determine the following:(a) P(X <1, Y <2) (b) P(1< X <2)(c) P(Y >3) (d) P(X <2, Y <2)(e) E(X) (f) E(Y )(g) Marginal
Determine the value of c that makes the function f (x, y) = c(x + y) a joint probability density function over the range 0 < x < 3 and 0 < y < x.Determine the following:(a) P(X <1, Y <2) (b) P(1< X <2)(c) P(Y >1) (d) P(X <2, Y <2)(e) E(X) (f) E(Y)(g)
Determine the value of c that makes the function f (x, y) = ce− 2x− 3y a joint probability density function over the range 0 < x and 0 < y < x.Determine the following:(a) P(X <1, Y <2) (b) P(1< X <2)(c) P(Y >3) (d) P(X < 2,Y < 2)(e) E(X) (f) E(Y)(g)
In the transmission of digital information, the probability that a bit has high, moderate, or low distortion is 0.01, 0.04, and 0.95, respectively. Suppose that three bits are transmitted and that the amount of distortion of each bit is assumed to be independent. Let X and Y denote the number of
Determine the value of c that makes the function f (x, y) = c(x + y) a joint probability density function over the range 0 < x < 3 and x < y < x + 2.Determine the following:(a) P(X <1, Y <2) (b) P(1< X <2)(c) P(Y >1) (d) P(X <2, Y <2)(e) E(X) (f) V
Determine the value of c such that the function f (x, y) = cxy for 0 < x < 3 and 0 < y < 3 satisfies the properties of a joint probability density function.Determine the following:(a) P(X <2, Y <3) (b) P(X <2.5)(c) P(1(d) P(X >1.8, 1(e) E(X) (f) P(X <0, Y <
For the Transaction Processing Performance Council’s benchmark in Exercise 5-10, let X, Y , and Z denote the average number of selects, updates, and inserts operations required for each type of transaction, respectively. Calculate the following:(a) fXYZ (x, y, z)(b) Conditional probability mass
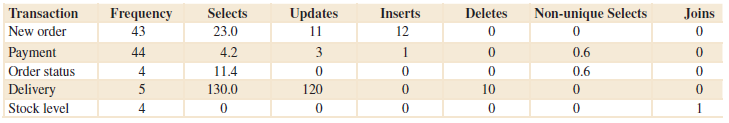
An article in the Journal of Database Management [“Experimental Study of a Self-Tuning Algorithm for DBMS Buffer Pools” (2005, Vol. 16, pp. 1–20)] provided the workload used in the TPC-C OLTP (Transaction Processing Performance Council’s Version C On-Line Transaction Processing) benchmark,
An engineering statistics class has 40 students; 60% are electrical engineering majors, 10% are industrial engineering majors, and 30% are mechanical engineering majors. A sample of four students is selected randomly without replacement for a project team. Let X and Y denote the number of
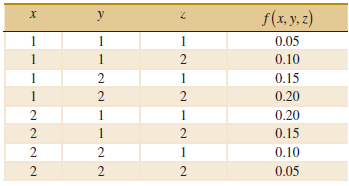
Suppose that the random variables X, Y , and Z have the following joint probability distribution.Determine the following:(a) P(X = 2) (b) P(X = 1, Y = 2)(c) P(Z <1.5) (d) P(X = 1 or Z = 2)(e) E(X ) (f) P(X = 1|Y = 1)(g) P(X = 1, Y = 1| Z = 2) (h) P(X = 1|Y = 1, Z = 2)(i)
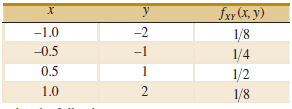
Show that the following function satisfies the properties of a joint probability mass function.Determine the following:(a) P(X <0.5, Y <1.5) (b) P(X <0.5)(c) P(Y <1.5) (d) P(X >0.25, Y < 4.5)(e) E(X ), E(Y ), V (X ), and V (Y )(f) Marginal probability distribution of
Determine the value of c that makes the function f (x, y) = c(x + y) a joint probability mass function over the nine points with x = 1, 2, 3 and y = 1, 2, 3. Determine the following:(a) P(X = 1, Y < 4) (b) P(X = 1)(c) P(Y = 2) (d) P(X < 2, Y < 2)(e) E(X), E(Y), V (X), and V (Y
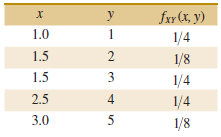
Show that the following function satisfies the properties of a joint probability mass function.Determine the following:(a) P(X <2.5, Y <3) (b) P(X <2.5)(c) P(Y <3) (d) P(X >1.8, Y > 4.7)(e) E(X), E(Y ), V (X), and V (Y ).(f) Marginal probability distribution of X(g) Conditional
The two-parameter exponential distribution uses a different range for the random variable X, namely, 0 ≤ γ ≤ x for a constant γ (and this equals the usual exponential distribution in the special case that γ = 0). The probability density function for X is f (x) = λexp[−λ(x − γ )] for 0
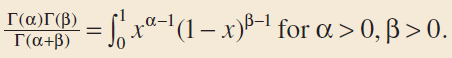
Determine the mean and variance of a beta random variable. Use the result that the probability density function integrates to 1. That is, Γ (α)Γ(β) T(a+ß) = [,x(1 – x)8-1 for a > 0, ß > 0. for a> 0, B>0.
Lack of Memory Property. Show that for an exponential random variable X, P(X < t1 + t2 u X > t1) = P(X < t2).
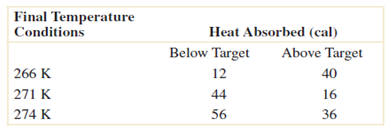
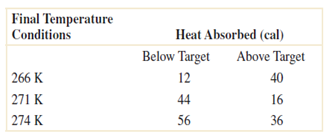
Consider the endothermic reactions given below. Let A denote the event that a reaction's final temperature is 271 K or less. Let B denote the event that the heat absorbed is above target.Determine the following probabilities.(a) P(A | B)(b) P(A' |B)(c) P(A | B')(d) P(B | A) Final
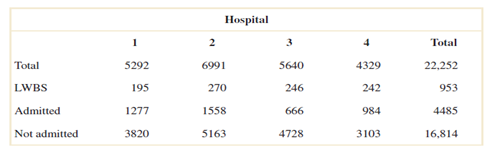
Consider the hospital emergency room data given below. Let A denote the event that a visit is to hospital 4, and let B denote the event that a visit results in LWBS (at any hospital). Use the addition rules to calculate the following probabilities.(a) P(AˆªB)(b) P(AˆªB')(c)
Consider the bar code 39 is a common bar code system that consists of narrow and wide bars (black) separated by either wide or narrow spaces (white). Each character contains nine elements (five bars and four spaces). The code for a character starts and ends with a bar (either narrow or wide) and a
The analysis of results from a leaf transmutation experiment (turning a leaf into a petal) is summarized by type of transformation completed:(a) If a leaf completes the color transformation, what is the probability that it will complete the textural transformation?(b) If a leaf does not complete
A computer system uses passwords that contain exactly eight characters, and each character is one of the 26 lowercase letters (a–z) or 26 uppercase letters (A–Z) or 10 integers (0–9). Assume all passwords are equally likely. Let A and B denote the events that consist of passwords with only
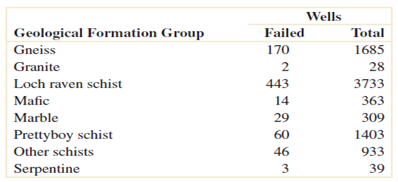
Consider the well failure data given below. Let A denote the event that the geological formation has more than 1000 wells, and let B denote the event that a well failed. Determine the following probabilities.(a) P(A ∩ B)(b) P(A ∪ B)(c) P(A' ∪B')(d)
An acticle in Biometrics [“Integrative Analysis of Transcriptomic and Proteomic Data of Desulfovibrio Vulgaris: A Nonlinear Model to Predict Abundance of Undetected Proteins” (2009)] reported that protein abundance from an operon (a set of biologically related genes) was less dispersed than
A hospital operating room needs to schedule three knee surgeries and two hip surgeries in a day. Suppose that an operating room needs to schedule three knee, four hip, and five shoulder surgeries. Assume that all schedules are equally likely. Determine the following probabilities:(a) All hip
The article [“Clinical and Radiographic Outcomes of Four Different Treatment Strategies in Patients with Early Rheumatoid Arthritis,” Arthritis & Rheumatism (2005, Vol. 52, pp. 3381– 3390)] considered four treatment groups. The groups consisted of patients with different drug
An article in the Journal of Cardiovascular Magnetic Resonance [“Right Ventricular Ejection Fraction Is Better Reflected by Transverse Rather Than Longitudinal Wall Motion in Pulmonary Hypertension” (2010, Vol.12(35)] discussed a study of the regional right ventricle transverse wall motion in
A computer system uses passwords that contain exactly eight characters, and each character is one of the 26 lowercase letters (a–z) or 26 uppercase letters (A–Z) or 10 integers (0–9). Let Ω denote the set of all possible password, and let A and B denote the
Redundant array of inexpensive disks (RAID) is a technology that uses multiple hard drives to increase the speed of data transfer and provide instant data backup. Suppose that the probability of any hard drive failing in a day is 0.001 and the drive failures are independent.(a) A RAID 0 scheme uses
A player of a video game is confronted with a series of four opponents and an 80% probability of defeating each opponent. Assume that the results from opponents are independent (and that when the player is defeated by an opponent the game ends).(a) What is the probability that a player defeats all
Six tissues are extracted from an ivy plant infested by spider mites. The plant in infested in 20% of its area. Each tissue is chosen from a randomly selected area on the ivy plant.(a) What is the probability that four successive samples show the signs of infestation?(b) What is the probability
In an acid-base titration, a base or acid is gradually added to the other until they have completely neutralized each other. Because acids and bases are usually colorless (as are the water and salt produced in the neutralization reaction), pH is measured to monitor the reaction. Suppose that the
Consider the endothermic reactions given below. Let A denote the event that a reaction's final temperature is 271 K or less. Let B denote the event that the heat absorbed is above target. Are these events independent? Final Temperature Conditions Heat Absorbed (cal) Below Target
Consider the well failure data given below. Let A denote the event that the geological formation has more than 1000 wells, and let B denote the event that a well failed. Are these events independent? Wells Geological Formation Group Failed Total Gneiss 170 1685 Granite 2 28 Loch raven schist 443
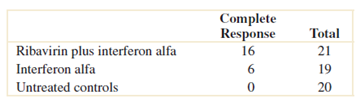
The article €œTerm Efficacy of Ribavirin Plus Interferon Alfa in the Treatment of Chronic Hepatitis C,€ [Gastroenterology (1996, Vol. 111, no. 5, pp. 1307€“1312)], considered the effect of two treatments and a control for treatment of hepatitis C. The following
The article [“Clinical and Radiographic Outcomes of Four Different Treatment Strategies in Patients with Early Rheumatoid Arthritis,” Arthritis & Rheumatism (2005, Vol. 52, pp. 3381– 3390)] considered four treatment groups. The groups consisted of patients with different drug
Showing 900 - 1000
of 1157
1
2
3
4
5
6
7
8
9
10
11
12
Step by Step Answers