New Semester
Started
Get
50% OFF
Study Help!
--h --m --s
Claim Now
Question Answers
Textbooks
Find textbooks, questions and answers
Oops, something went wrong!
Change your search query and then try again
S
Books
FREE
Study Help
Expert Questions
Accounting
General Management
Mathematics
Finance
Organizational Behaviour
Law
Physics
Operating System
Management Leadership
Sociology
Programming
Marketing
Database
Computer Network
Economics
Textbooks Solutions
Accounting
Managerial Accounting
Management Leadership
Cost Accounting
Statistics
Business Law
Corporate Finance
Finance
Economics
Auditing
Tutors
Online Tutors
Find a Tutor
Hire a Tutor
Become a Tutor
AI Tutor
AI Study Planner
NEW
Sell Books
Search
Search
Sign In
Register
study help
mathematics
applied statistics and probability
Applied Statistics And Probability For Engineers 6th Edition Douglas C. Montgomery, George C. Runger - Solutions
For the hypothesis test H0: μ = 10 against H1:μ >10 and variance known, calculate the P-value for each of the following test statistics.(a) z0 = 2.05 (b) z0 = −1.84 (c) z0 = 0.4
For the hypothesis test H0: μ = 7 against H1: μ ≠ 7 and variance known, calculate the P-value for each of the following test statistics.(a) z0 = 2.05 (b) z0 =−1.84 (c) z0 = 0.4
A hypothesis will be used to test that a population mean equals 5 against the alternative that the population mean is less than 5 with known variance σ. What is the critical value for the test statistic Z0 for the following significance levels? (a) 0.01 (b) 0.05 (c) 0.10
A hypothesis will be used to test that a population mean equals 10 against the alternative that the population mean is more than 10 with known variance σ. What is the critical value for the test statistic Z0 for the following significance levels? (a) 0.01 (b) 0.05 (c) 0.10
A hypothesis will be used to test that a population mean equals 7 against the alternative that the population mean does not equal 7 with known variance σ. What are the critical values for the test statistic Z0 for the following significance levels? (a) 0.01 (b) 0.05 (c) 0.10
State the null and alternative hypothesis in each case.(a) A hypothesis test will be used to potentially provide evidence that the population mean is more than 10.(b) A hypothesis test will be used to potentially provide evidence that the population mean is not equal to 7.(c) A hypothesis test will
In the quality-control example of Exercise 9-29, the manager says that the probability of a type I error is too large and that it must be no larger than 0.01.(a) How does this change the rule for deciding whether a board is “good”?(b) How does this affect the type II error?(c) Do you think this
A quality-control inspector is testing a batch of printed circuit boards to see whether they are capable of performing in a high temperature environment. He knows that the boards that will survive will pass all five of the tests with probability 98%. They will pass at least four tests with
If we plot the probability of accepting H0: μ = μ0 versus various values of μ and connect the points with a smooth curve, we obtain the operating characteristic curve (or the OC curve) of the test procedure. These curves are used extensively in industrial applications of hypothesis testing to
In Exercise 9-20, calculate the probability of a type II error if the true mean output is 5.05 volts and(a) α = 0.05 and n = 10 (b) α = 0.05 and n = 16(c) Compare the values of β calculated in the previous parts. What conclusion can you draw?
In Exercise 9-20, calculate the P-value if the observed statistic is(a) x̅ = 5.2 (b) x̅ = 4.7 (c) x̅ = 5.1
In Exercise 9-20, find the boundary of the critical region if the type I error probability is(a) α = 0.01 and n = 8(b) α = 0.05 and n = 8 (c) α = 0.01 and n = 16(d) α = 0.05 and n = 16
In Exercise 9-15, calculate the P-value if the observed statistic is(a) x̅ = 180 (b) x̅ = 190 (c) x̅ = 170
In Exercise 9-15, calculate the probability of a type II error if the true mean foam height is 185 millimeters and(a) α = 0.05 and n = 10 (b) α = 0.05 and n = 16(c) Compare the values of β calculated in the previous parts. What conclusion can you draw?
In Exercise 9-15, find the boundary of the critical region if the type I error probability is(a) α = 0.01 and n = 10(b) α = 0.05 and n = 10 (c) α = 0.01 and n = 16(d) α = 0.05 and n = 16
A consumer products company is formulating a new shampoo and is interested in foam height (in millimeters). Foam height is approximately normally distributed and has a standard deviation of 20 millimeters. The company wishes to test H0: μ = 175 millimeters versus H1: μ > 175 millimeters, using
In Exercise 9-10, calculate the P-value if the observed statistic is(a) x̅ = 98 (b) x̅ = 101 (c) x̅ = 102
In Exercise 9-10, calculate the probability of a type II error if the true mean heat evolved is 103 and(a) α = 0.05 and n = 9 (b) α = 0.05 and n = 5(c) Compare the values of β calculated in the previous parts. What conclusion can you draw?
In Exercise 9-10, find the boundary of the critical region if the type I error probability is(a) α = 0.01 and n = 9 (b) α = 0.05 and n = 9(c) α = 0.01 and n = 5(d) α = 0.05 and n = 5
Repeat Exercise 9-10 using a sample size of n = 5 and the same acceptance region.Exercise 9-10The heat evolved in calories per gram of a cement mixture is approximately normally distributed. The mean is thought to be 100, and the standard deviation is 2. You wish to test H0: μ = 100 versus H1: μ
In Exercise 9-5, calculate the P-value if the observed statistic is(a) x̅ = 11.25 (b) x̅ = 11.0 (c) x̅ = 11.75
In Exercise 9-5, calculate the probability of a type II error if the true mean elongation is 11.5 kilograms and(a) α = 0.05 and n = 4(b) α = 0.05 and n = 16(c) Compare the values of β calculated in the previous parts. What conclusion can you draw?
In Exercise 9-5, find the boundary of the critical region if the type I error probability is(a) α = 0.01 and n = 4(b) α = 0.05 and n = 4(c) α = 0.01 and n = 16(d) α = 0.05 and n = 16
The mean pull-off force of a connector depends on cure time.(a) State the null and alternative hypotheses used to demonstrate that the pull-off force is below 25 newtons.(b) Assume that the previous test does not reject the null hypothesis. Does this result provide strong evidence that the pulloff
The standard deviation of critical dimension thickness in semiconductor manufacturing is σ = 20 nm. (a) State the null and alternative hypotheses used to demonstrate that the standard deviation is reduced.(b) Assume that the previous test does not reject the null hypothesis. Does this result
A semiconductor manufacturer collects data from a new tool and conducts a hypothesis test with the null hypothesis that a critical dimension mean width equals 100 nm. The conclusion is to not reject the null hypothesis. Does this result provide strong evidence that the critical dimension mean
A biology student finds that of 35 males with Drosophila melanogaster, 2 have Adh genotypes with a male mating advantage.(a) Using the standard methods, find a 95% confidence interval for the true proportion of males with this genotype.(b) Compare the confidence interval you found in part (a) with
The confidence interval for a population proportion depends on the central limit theorem. A common rule of thumb is that to use the normal approximation for the sampling distribution for ˆp, you should have at least 10 “successes” and 10 “failures.” However, Agresti and Coull developed a
An article in the Journal of Human Nutrition and Dietetics [€œThe Validation of Energy and Protein Intakes by Doubly Labeled Water and 24-Hour Urinary Nitrogen Excretion in Post-Obese Subjects€ (1995, Vol. 8, pp. 51€“64)] showed the energy intake expressed as a basal
An article in the Journal of Applied Physiology [€œHumidity Does Not Affect Central Nervous System Oxygen Toxicity€ (2001, Vol. 91, pp. 1327€“1333)] reported that central nervous system (CNS) oxygen toxicity can appear in humans on exposure to oxygen pressures >180
Consider the bottle-wall thickness measurements described in Exercise 8-42.(a) Compute a 90% tolerance interval on bottle-wall thickness that has confidence level 90%.(b) Compute a 90% lower tolerance bound on bottle-wall thickness that has confidence level 90%. Why would a lower tolerance bound
Consider the strength-of-concrete data in Exercise 8-39. Compute a 90% tolerance interval on the compressive strength of the concrete that has 90% confidence.
Consider the rainfall in Exercise 8-35. Compute a 95% prediction interval on the rainfall for the next year. Compare the length of the prediction interval with the length of the 95% CI on the population mean.
Consider the natural frequency of beams described in Exercise 8-34. Compute a 90% prediction interval on the diameter of the natural frequency of the next beam of this type that will be tested. Compare the length of the prediction interval with the length of the 90% CI on the population
Use the data from Exercise 8-66 to compute a two-sided Agresti-Coull CI on the proportion of correct digits that can be automatically read. Compare and discuss the CI to the one computed in Exercise 8-66.
Use the data from Exercise 8-60 to compute a two-sided Agresti-Coull CI on the proportion of tears that will heal. Compare and discuss the CI to the one computed in Exercise 8-60.Exercise-60An article in Knee Surgery, Sports Traumatology, Arthroscopy [“Arthroscopic Meniscal Repair with an
Use the data from Exercise 8-68 to compute a two-sided Agresti-Coull CI on the proportion of seeds that germinate. Compare and discuss the CI to the one computed in Exercise 8-68.
Use the data from Exercise 8-59 to compute a two-sided Agresti-Coull CI on the proportion of defective circuits. Compare and discuss the CI to the one computed in Exercise 8-59.
Information on a packet of seeds claims that 93% of them will germinate. Of the 200 seeds that I planted, only 180 germinated.(a) Find a 95% confidence interval for the true proportion of seeds that germinate based on this sample.(b) Does this seem to provide evidence that the claim is wrong?
The U.S. Postal Service (USPS) has used optical character recognition (OCR) since the mid-1960s. In 1983, USPS began deploying the technology to major post offices throughout the country (www.britannica.com). Suppose that in a random sample of 500 handwritten zip code digits, 466 were read
An article in the Journal of the American Statistical Association (1990, Vol. 85, pp. 972–985) measured the weight of 30 rats under experiment controls. Suppose that 12 were underweight rats. (a) Calculate a 95% two-sided confidence interval on the true proportion of rats that would show
Of 1000 randomly selected cases of lung cancer, 823 resulted in death within 10 years. (a) Calculate a 95% two-sided confidence interval on the death rate from lung cancer.(b) Using the point estimate of p obtained from the preliminary sample, what sample size is needed to be 95% confident
The 2004 presidential election exit polls from the critical state of Ohio provided the following results. The exit polls had 2020 respondents, 768 of whom were college graduates. Of the college graduates, 412 voted for George Bush. (a) Calculate a 95% confidence interval for the proportion of
An article in Knee Surgery, Sports Traumatology, Arthroscopy [“Arthroscopic Meniscal Repair with an Absorbable Screw: Results and Surgical Technique” (2005, Vol. 13, pp. 273–279)] showed that only 25 out of 37 tears (67.6%) located between 3 and 6 mm from the meniscus rim were healed.(a)
The fraction of defective integrated circuits produced in a photolithography process is being studied. A random sample of 300 circuits is tested, revealing 13 defectives. (a) Calculate a 95% two-sided CI on the fraction of defective circuits produced by this particular tool.(b) Calculate a 95%
From the data on CAT scans in Exercise 8-45(a) Find a two-sided 95% confidence interval for the standard deviation.(b) What should you do to address any reservations about the confidence interval you found in part (a)?Exercise-45A healthcare provider monitors the number of CAT scans performed each
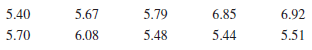
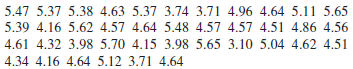
From the data on the pH of rain in Ingham County, Michigan:Find a two-sided 95% confidence interval for the standard deviation of pH. 5.47 5.37 5.38 4.63 5.37 3.74 3.71 4.96 4.64 5.11 5.65 5.39 4.16 5.62 4.57 4.64 5.48 4.57 4.57 4.51 4.86 4.56 4.61 4.32 3.98 5.70 4.15 3.98 5.65 3.10 5.04 4.62
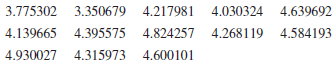
An article in the Australian Journal of Agricultural Research [€œNon-Starch Polysaccharides and Broiler Performance on Diets Containing Soyabean Meal as the Sole Protein Concentrate€ (1993, Vol. 44(8), pp. 1483€“1499)] determined that the essential amino acid (Lysine)
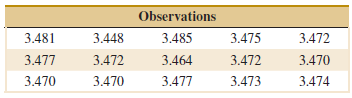
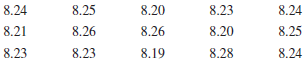
An article in Technometrics (1999, Vol. 41, pp. 202€“ 211) studied the capability of a gauge by measuring the weight of paper. The data for repeated measurements of one sheet of paper are in the following table. Construct a 95% one-sided upper confidence interval for the standard
An article in Cancer Research [€œAnalyses of Litter- Matched Time-to-Response Data, with Modifications for Recovery of Interlitter Information€ (1977, Vol. 37, pp. 3863€“ 3868)] tested the tumorigenesis of a drug. Rats were randomly selected from litters and given the
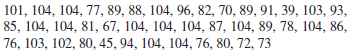
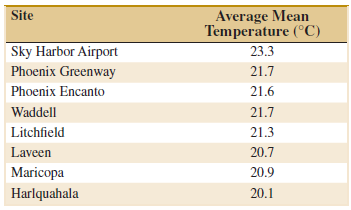
An article in Urban Ecosystems, €œUrbanization and Warming of Phoenix (Arizona, USA): Impacts, Feedbacks and Mitigation€ (2002, Vol. 6, pp. 183€“203), mentions that Phoenix is ideal to study the effects of an urban heat island because it has grown from a population of
An article in Medicine and Science in Sports and Exercise [“Electro stimulation Training Effects on the Physical Performance of Ice Hockey Players” (2005, Vol. 37, pp. 455–460)] considered the use of electromyostimulation (EMS) as a method to train healthy skeletal muscle. EMS sessions
Consider the situation in Exercise 8-48. Find a 99% lower confidence bound on the standard deviation.
A healthcare provider monitors the number of CAT scans performed each month in each of its clinics. The most recent year of data for a particular clinic follows (the reported variable is the number of CAT scans each month expressed as the number of CAT scans per thousand members of the health
Using the data from Exercise 8-22 on adhesion without assuming that the standard deviation is known,(a) Check the assumption of normality by using a normal probability plot.(b) Find a 95% confidence interval for the mean adhesion.
An article in Computers & Electrical Engineering [€œParallel Simulation of Cellular Neural Networks€ (1996, Vol. 22, pp. 61€“84)] considered the speedup of cellular neural networks (CNN) for a parallel general-purpose computing architecture based on six
A machine produces metal rods used in an automobile suspension system. A random sample of 15 rods is selected, and the diameter is measured. The resulting data (in millimeters) are as follows:(a) Check the assumption of normality for rod diameter.(b) Calculate a 95% two-sided confidence interval on
The compressive strength of concrete is being tested by a civil engineer who tests 12 specimens and obtains the following data:(a) Check the assumption that compressive strength is normally distributed. Include a graphical display in your answer.(b) Construct a 95% two-sided confidence interval on
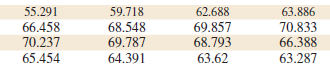
The solar energy consumed (in trillion BTU) in the United States by year from 1989 to 2004 is shown in the following table. Read down then across for year.Check the assumption of normality in the population. Construct a 95% confidence interval for the mean solar energy consumed. 62.688 69.857
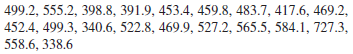
The Bureau of Meteorology of the Australian Government provided the mean annual rainfall (in millimeters) in Australia 1983€“2002 as follows (http://www.bom.gov.au/ climate/change/rain03.txt):Check the assumption of normality in the population. Construct a 95% confidence interval for the
An article in Obesity Research [“Impaired Pressure Natriuresis in Obese Youths” (2003, Vol. 11, pp. 745–751)] described a study in which all meals were provided for 14 lean boys for three days followed by one stress test (with a videogame task). The average systolic blood pressure (SBP)
An article in Medicine and Science in Sports and Exercise [“Maximal Leg-Strength Training Improves Cycling Economy in Previously Untrained Men” (2005, Vol. 37, pp. 131–136)] studied cycling performance before and after eight weeks of legstrength training. Seven previously untrained males
A random sample has been taken from a normal distribution. Output from a software package follows:(a) Fill in the missing quantities.(b) Find a 95% CI on the population mean. Variable N Mean SE Mean StDev Varianc ? ? 1.58 Sum х 751.40 6.11
A random sample has been taken from a normal distribution. Output from a software package follows:(a) Fill in the missing quantities.(b) Find a 95% CI on the population mean. Variable N Mean SE Mean StDev Varianc 0.507 Sum Sum 251.848 10 1.605 х
Dairy cows at large commercial farms often receive injections of bST (Bovine Somatotropin), a hormone used to spur milk production. Bauman et al. (Journal of Dairy Science, 1989) reported that 12 cows given bST produced an average of 28.0 kg/d of milk. Assume that the standard deviation of milk
Ishikawa et al. (Journal of Bioscience and Bioengineering, 2012) studied the adhesion of various biofilms to solid surfaces for possible use in environmental technologies. Adhesion assay is conducted by measuring absorbance at A590. Suppose that for the bacterial strain Acinetobacter, five
An article in the Journal of Agricultural Science [€œThe Use of Residual Maximum Likelihood to Model Grain Quality Characteristics of Wheat with Variety, Climatic and Nitrogen Fertilizer Effects€ (1997, Vol. 128, pp. 135€“142)] investigated means of wheat grain crude
Following are two confidence interval estimates of the mean m of the cycles to failure of an automotive door latch mechanism (the test was conducted at an elevated stress level to accelerate the failure). 3124.9 ≤ μ ≤ 3215.7 3110.5 ≤ μ ≤ 3230.1(a) What is the value of the sample mean
Consider the gain estimation problem in Exercise 8-4.(a) How large must n be if the length of the 95% CI is to be 40?(b) How large must n be if the length of the 99% CI is to be 40?
A random sample has been taken from a normal distribution and the following confidence intervals constructed using the same data: (37.53, 49.87) and (35.59, 51.81)(a) What is the value of the sample mean?(b) One of these intervals is a 99% CI and the other is a 95% CI. Which one is the 95% CI and
A random sample has been taken from a normal distribution and the following confidence intervals constructed using the same data: (38.02, 61.98) and (39.95, 60.05)(a) What is the value of the sample mean?(b) One of these intervals is a 95% CI and the other is a 90% CI. Which one is the 95% CI and
Consider the one-sided confidence interval expressions for a mean of a normal population.(a) What value of zα would result in a 90% CI?(b) What value of zα would result in a 95% CI?(c) What value of zα would result in a 99% CI?
For a normal population with known variance σ2, answer the following questions: (a) What is the confidence level for the interval x̅ − 2.14σ √n ≤ μ ≤ x̅ + 2.14σ √n ?(b) What is the confidence level for the interval x̅ − 2.49σ √n x − 2.49σ n ≤ μ ≤ x̅ + 2.49σ √n
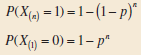
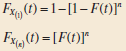
Order Statistics. Let X1, X2, €¦. Xnbe a random sample of size n from X, a random variable having distribution function F(x). Rank the elements in order of increasing numerical magnitude, resulting in X(1), X(2),€¦, X(n), where X(1)is the smallest sample element (X(1)=
Consistent Estimator. Another way to measure the closeness of an estimator Θ to the parameter θ is in terms of consistency. If Θnis an estimator of θ based on a random sample of n observations, Θnis consistent for θ ifThus,
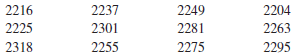
An electric utility has placed special meters on 10 houses in a subdivision that measures the energy consumed (demand) at each hour of the day. The company is interested in the energy demand at one specific hour—the hour at which the system experiences the peak consumption. The data from these 10
You plan to use a rod to lay out a square, each side of which is the length of the rod. The length of the rod is μ, which is unknown. You are interested in estimating the area of the square, which is μ2. Because μ is unknown, you measure it n times, obtaining observations X1, X2, …., Xn.
Let f x = (1 / θ)x (1- θ)/θ , 0 < x < 1, and < θ < ∞ show that Θ = −(1 / n)Σni=1 ln(X ) is the maximum likelihood estimator for θ and that Θ is an unbiased estimator for q.
Let f (x) = θxθ−1 , 0<θ< ∞, and 0< x <1. Show that Θ = − n / (ln Πni=1 Xi) is the maximum likelihood estimator for θ.
A manufacturer of semiconductor devices takes a random sample of 100 chips and tests them, classifying each chip as defective or nondefective. Let Xi= 0 if the chip is nondefective and Xi= 1 if the chip is defective. The sample fraction defective is X, + X2 +.+ X100 P= 100
A random sample of size n = 16 is taken from a normal population with μ = 40 and σ2 = 5. Find the probability that the sample mean is less than or equal to 37.
The time between failures of a machine has an exponential distribution with parameter λ. Suppose that the prior distribution for λ is exponential with mean 100 hours. Two machines are observed, and the average time between failures is x̅ = 1125 hours.(a) Find the Bayes estimate for λ.(b) What
The weight of boxes of candy is a normal random variable with mean μ and variance 1/10 pound. The prior distribution for μ is normal with mean 5.03 pound and variance 1/ 25 pound. A random sample of 10 boxes gives a sample mean of x̅ = . 5 05 pounds.(a) Find the Bayes estimate of μ.(b) Compare
Suppose that X is a normal random variable with unknown mean and known variance σ2 = 9. The prior distribution for μ is normal with μ0 = 4 and σ20 = 1. A random sample of n = 25 observations is taken, and the sample mean is x = 4.85. (a) Find the Bayes estimate of μ.(b) Compare the Bayes
Suppose that X is a Poisson random variable with parameter λ. Let the prior distribution for λ be a gamma distribution with parameters m + 1 and (m +1) / λ0.(a) Find the posterior distribution for λ.(b) Find the Bayes estimator for λ.
Suppose that X is a normal random variable with unknown mean μ and known variance σ2. The prior distribution for μ is a uniform distribution defined over the interval [a, b]. (a) Find the posterior distribution for μ.(b) Find the Bayes estimator for μ.
Suppose that X is a normal random variable with unknown mean μ and known variance σ2. The prior distribution for μ is a normal distribution with mean μ0 and variance σ20 . Show that the Bayes estimator for μ becomes the maximum likelihood estimator when the sample size n is large.
Reconsider the oxide thickness data in Exercise 7-35 and suppose that it is reasonable to assume that oxide thickness is normally distributed. (a) Compute the maximum likelihood estimates of μ and σ2.(b) Graph the likelihood function in the vicinity of μ̂ and σ̂2, the maximum likelihood
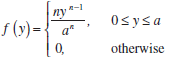
Let X1, X2, €¦ , Xnbe uniformly distributed on the interval 0 to a. Recall that the maximum likelihood estimator of a is aÌ‚ = max(Xi).(a) Argue intuitively why ˆa cannot be an unbiased estimator for a.(b) Suppose that E(aÌ‚) = na / (n +1). Is it
The Rayleigh distribution has probability density function(a) It can be shown that E(X2) = 2θ. Use this information to construct an unbiased estimator for θ.(b) Find the maximum likelihood estimator of θ. Compare your answer to part (a).(c) Use the invariance
Consider the Poisson distribution with parameter λ. Find the maximum likelihood estimator of λ, based on a random sample of size n.
Suppose that two independent random samples (of size n1 and n2) from two normal distributions are available. Explain how you would estimate the standard error of the difference in sample means X̅1 – X̅2 with the bootstrap method.
Consider a normal random variable with mean 10 and standard deviation 4. Suppose that a random sample of size 16 is drawn from this distribution and the sample mean is computed. We know that the standard error of the sample mean in this case is σ / √n = σ / √16 = 1. Use the bootstrap method
An exponential distribution is known to have a mean of 10. You want to find the standard error of the median of this distribution if a random sample of size 8 is drawn. Use the bootstrap method to find the standard error, using nB = 100 bootstrap samples.
Suppose that the random variable X has a lognormal distribution with parameters θ = 1.5 and ω = 0.8. A sample of size n = 15 is drawn from this distribution. Find the standard error of the sample median of this distribution with the bootstrap method using nB = 200 bootstrap samples.
X̅1and S21are the sample mean and sample variance from a population with mean μ1 and variance σ12. Similarly, X̅2and S22are the sample mean and sample variance from a second independent population with mean μ2and variance
Suppose that we have a random sample X1, X2, …., Xn from a population that is N(μ, σ2). We plan to use Θ = Σni=1 (Xi – X̅)2 / c to estimate σ2. Compute the bias in Θ as an estimator of σ2 as a function of the constant c.
Let X1and X2be independent random variables with mean μ and variance σ2. Suppose that we have two estimators of μ:(a) Are both estimators unbiased estimators of μ?(b) What is the variance of each estimator? X1 +3X2 4 X1 + X2 2 and 6.
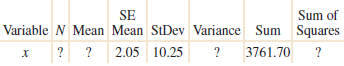
A computer software package calculated some numerical summaries of a sample of data. The results are displayed here:(a) Fill in the missing quantities.(b) What is the estimate of the mean of the population from which this sample was drawn? Sum of Sum Squares ? SE Variable N Mean Mean StDev Variance
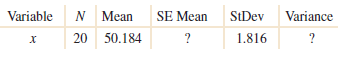
A computer software package calculated some numerical summaries of a sample of data. The results are displayed here:(a) Fill in the missing quantities.(b) What is the estimate of the mean of the population from which this sample was drawn? SE Mean StDev Variance Variable N Mean 20 50.184 ? 1.816
Showing 500 - 600
of 1157
1
2
3
4
5
6
7
8
9
10
11
12
Step by Step Answers
![fx(1) = n[1– F(0)]](https://dsd5zvtm8ll6.cloudfront.net/si.question.images/images/question_images/1528/6/8/9/2525b1df264e9f301528689270802.jpg)