New Semester
Started
Get
50% OFF
Study Help!
--h --m --s
Claim Now
Question Answers
Textbooks
Find textbooks, questions and answers
Oops, something went wrong!
Change your search query and then try again
S
Books
FREE
Study Help
Expert Questions
Accounting
General Management
Mathematics
Finance
Organizational Behaviour
Law
Physics
Operating System
Management Leadership
Sociology
Programming
Marketing
Database
Computer Network
Economics
Textbooks Solutions
Accounting
Managerial Accounting
Management Leadership
Cost Accounting
Statistics
Business Law
Corporate Finance
Finance
Economics
Auditing
Tutors
Online Tutors
Find a Tutor
Hire a Tutor
Become a Tutor
AI Tutor
AI Study Planner
NEW
Sell Books
Search
Search
Sign In
Register
study help
mathematics
applied statistics and probability
Applied Statistics And Probability For Engineers 6th Edition Douglas C. Montgomery, George C. Runger - Solutions
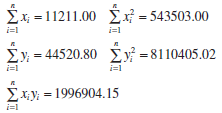
On average, do people gain weight as they age? Using data from the same study as in Exercise 11-1, we provide some summary statistics for both age and weight.(a) Calculate the least squares estimates of the slope and intercept. Graph the regression line.(b) Use the equation of the fitted line to
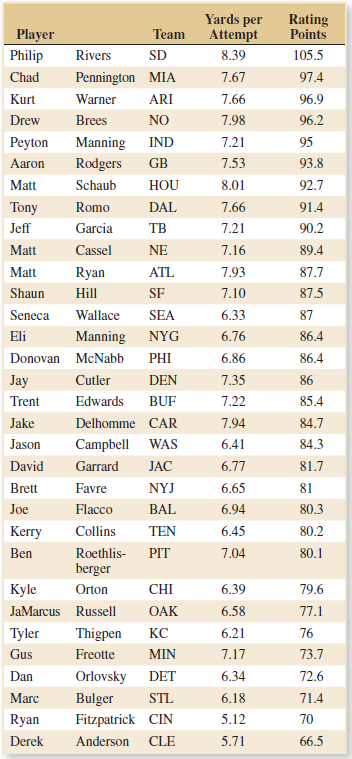
Diabetes and obesity are serious health concerns in the United States and much of the developed world. Measuring the amount of body fat a person carries is one way to monitor weight control progress, but measuring it accurately involves either expensive X-ray equipment or a pool in which to dunk
Diabetes and obesity are serious health concerns in the United States and much of the developed world. Measuring the amount of body fat a person carries is one way to monitor weight control progress, but measuring it accurately involves either expensive X-ray equipment or a pool in which to dunk
Derive an expression for β for the test of the equality of the variances of two normal distributions. Assume that the two-sided alternative is specified.
In some situations involving proportions, you are interested in the ratio θ = p1 / p2 rather than the difference p1 – p2. Let θ = p1 / p2. It can be shown that ln(θ) has an approximate normal distribution with the mean (n / θ) and variance (n1 – x1) / (n1 x1) + (n2 – x2) / (n2 x2)1/2.(a)
Construct a data set for which the paired t-test statistic is very large, indicating that when this analysis is used, the two population means are different, but t0 for the two-sample t-test is very small so that the incorrect analysis would indicate that there is no significant difference for the
Suppose that you wish to test H0: μ = μ0 versus H1: μ ≠ μ0, where the population is normal with known σ. Let 0 < ε < α, and define the critical region so that you will reject H0 if z0 > zε or if z0 < −zα−ε where z0 is the value of the usual test statistic for these
Suppose that you wish to test the hypothesis H0: μ1 = μ2 versus H1: μ1 ≠ μ2, where both variances σ21 and σ22 are known. A total of n1 + n2 = N observations can be taken. How should these observations be allocated to the two populations to maximize the probability that H0 will be
Suppose that you wish to test H0: l1 = l2 versus H1: μ1 ≠ μ2, where σ21 and σ22 are known. The total sample size N is to be determined, and the allocation of observations to the two populations such that n1 + n1 = N is to be made on the basis of cost. If the cost of sampling for populations 1
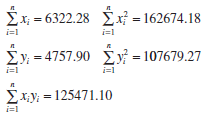
Three different pesticides can be used to control pest infestation of grapes. It is suspected that pesticide 3 is more effective than the other two. In a particular vineyard, three different plantings of pinot noir grapes are selected for study. The following results on yield are obtained:If
Consider the unlisted telephone number data in Exercise 10-101. Find 95% CIs on the difference in the proportions of unlisted telephone numbers for Phoenix and Scottsdale residents using both procedures described in this chapter. Compare the lengths of these two intervals and comment on any
Consider the seat belt usage data in Exercise 10-102. Find 95% CIs on the difference in the proportions of seat belt usage for drivers of foreign and domestic cars using both procedures described in this chapter. Compare the lengths of these two intervals and comment on any difference you may
Consider the grinding force data in Exercise 10-40. Is there any indication that the variances of grinding force are different at the two different levels of temperature?Exercise 10-40An article in Quality Engineering [2012, Vol. 24(1)] described an experiment on a grinding wheel. The following are
Consider the foam thickness data from Exercise 10-39. Is there any indication that the variances of foam thickness are different at the two different levels of temperature?Exercise 10-39An article in Polymer Degradation and Stability (2006, Vol. 91) presented data from a nine-year aging study on
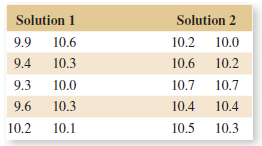
Consider the situation described in Exercise 10-87.(a) Redefine the parameters of interest to be the proportion of lenses that are unsatisfactory following tumble polishing with polishing fluids 1 or 2. Test the hypothesis that the two polishing solutions give different results using α = 0.01.(b)
Two machines are used to fill plastic bottles with dishwashing detergent. The standard deviations of fill volume are known to be σ1 = 0.10 fluid ounces and σ2 = 0.15 fluid ounces for the two machines, respectively. Two random samples of n1 = 12 bottles from machine 1 and n2 = 10 bottles from
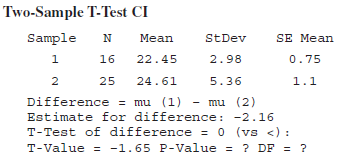
Consider the following computer output.(a) Is this a one-sided or a two-sided test?(b) Fill in the missing values. You may use bounds for the P-value.(c) What are your conclusions if α = 0.05? What if α = 0.10?(d) Find a 95% upper-confidence bound on the difference in
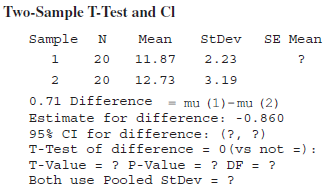
Consider the following computer output.(a) Fill in the missing values. You may use bounds for the P-value.(b) Is this a two-sided test or a one-sided test?(c) What are your conclusions if α = 0.05? What if α = 0.10? Two-Sample T-Test and Cl Sample SE Mean Mean StDev 20
Consider the highway speed limit data introduced in Exercise 10-88. Find a 99% CI on the difference in the two proportions using the alternate CI procedure described in this section. Compare the lengths of the CI from Exercise 10-88 with these in this one. Discuss the possible causes of any
Rework the election data reported in Exercise 10-85 using the alternate CI procedure described in this section. Compare the lengths of the CI from Exercise 10-85 with this one. Discuss the possible causes of any differences that you observe.Exercise 10-85In the 2004 presidential election, exit
The New England Journal of Medicine reported an experiment to judge the efficacy of surgery on men diagnosed with prostate cancer. The randomly assigned half of 695 (347) men in the study had surgery, and 18 of them eventually died of prostate cancer compared with 31 of the 348 who did not have
Air pollution has been linked to lower birthweight in babies. In a study reported in the Journal of the American Medical Association, researchers examined the proportion of low-weight babies born to mothers exposed to heavy doses of soot and ash during the World Trade Center attack of September 11,
A random sample of 500 adult residents of Maricopa County indicated that 385 were in favor of increasing the highway speed limit to 75 mph, and another sample of 400 adult residents of Pima County indicated that 267 were in favor of the increased speed limit.(a) Do these data indicate that there is
Two different types of injection-molding machines are used to form plastic parts. A part is considered defective if it has excessive shrinkage or is discolored. Two random samples, each of size 300, are selected, and 15 defective parts are found in the sample from machine 1, and 8 defective parts
In the 2004 presidential election, exit polls from the critical state of Ohio provided the following results: For respondents with college degrees, 53% voted for Bush and 46% voted for Kerry. There were 2020 respondents.(a) Is there a significant difference in these proportions? Use α = 0.05. What
An article in Knee Surgery, Sports Traumatology, Arthroscopy (2005, Vol. 13, pp. 273–279) considered arthroscopic meniscal repair with an absorbable screw. Results showed that for tears greater than 25 millimeters, 14 of 18 (78%) repairs were successful, but for shorter tears, 22 of 30(73%)
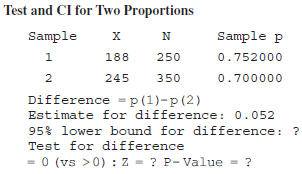
Consider the following computer output.(a) Is this one-sided or a two-sided test?(b) Fill in the missing values.(c) Can the null hypothesis be rejected if = 0.10? What if = 0.05? Test and CI for Two Proportions Sample Sample p 188 250 0.752000 2 245 350 0.700000 Difference =p(1)-p(2) Estimate for
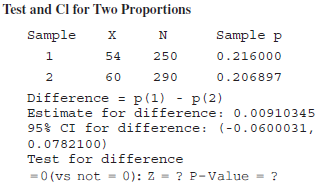
Consider the following computer output.(a) Is this a one-sided or a two-sided test?(b) Fill in the missing values.(c) Can the null hypothesis be rejected?(d) Construct an approximate 90% CI for the difference in the two proportions. Test and Cl for Two Proportions Sample Sample p 0.216000 1. 54 250
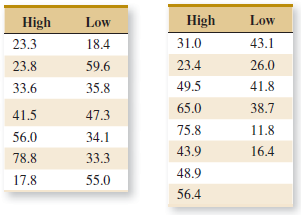
Is there evidence to suggest that the standard deviations of the algae concentrations in the two types of rivers (flow rates) in Exercise 10-36 differ? Use α = 0.05.
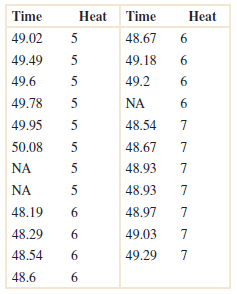
Consider the swimming data in Exercise 10-37. Is there evidence to suggest that the standard deviations of the heats differ for slower swimmers in heat five and the faster swimmers in heat seven? What about the standard deviations of the two sets of elite swimmers in heats six and seven? Use
Consider the etch rate data in Exercise 10-23.(a) Test the hypothesis H0: σ21 = σ22 against H1: σ21 ‰ σ22 using α = 0.05, and draw conclusions.(b) Suppose that if one population variance is twice as large as the other, you want to
Consider the film speed data in Exercise 10-26.(a) Test H0: σ21 = σ22 versus H1: σ21 ≠ σ22 using α = 0.02.(b) Suppose that one population standard deviation is 50% larger than the other. Is the sample size n1 = n2 = 8 adequate to detect this difference with high probability? Use α = 0.01 in
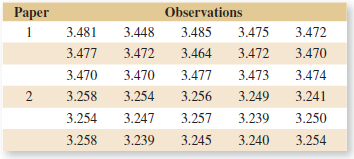
Consider the weight of paper data from Technometrics in Exercise 10-32. Is there evidence that the variance of the weight measurement differs for the sheets of paper? Use α = 0.05. Explain how this test can be conducted with a confidence interval.Exercise 10-32An article in
Reconsider the coefficient of restitution data in Exercise 10-34. Do the data suggest that the standard deviation is the same for both brands of drivers (use α = 0.05)? Explain how to answer this question with a confidence interval on σ1/σ2.Exercise 10-34The
Reconsider the overall distance data for golf balls in Exercise 10-33. Is there evidence to support the claim that the standard deviation of overall distance is the same for both brands of balls (use α = 0.05)? Explain how this question can be answered with a 95% confidence interval on σ1 /
Exercise 10-28 presented measurements of plastic coating thickness at two different application temperatures. Test H0: σ21 = σ22 against H1 : σ21 ≠ σ22 using α = 0.01.Exercise 10-28The thickness of a plastic film (in mils) on a substrate material is thought to be influenced by the
Consider the melting-point data in Exercise 10-25. Do the sample data support a claim that both alloys have the same variance of melting point? Use α = 0.05 in reaching your conclusion.Exercise 10-25The melting points of two alloys used in formulating solder were investigated by melting 21 samples
Consider the gear impact strength data in Exercise 10-24. Is there sufficient evidence to conclude that the variance of impact strength is different for the two suppliers? Use α = 0.05.Exercise 10-24(a) Is there evidence to support the claim that supplier 2 provides gears with higher mean impact
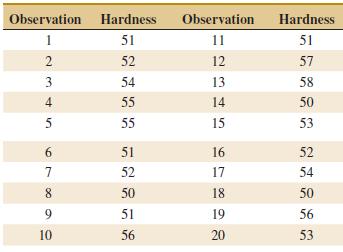
Reconsider the hardness measurements in Exercise 15-19. Suppose that the specifications are 45 to 60.(a) Estimate the process standard deviation.(b) Calculate PCR and PCRk for the process.Exercise 15-19Twenty successive hardness measurements are made on a metal alloy, and the data are shown in the
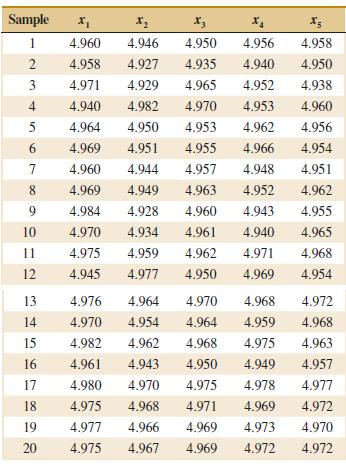
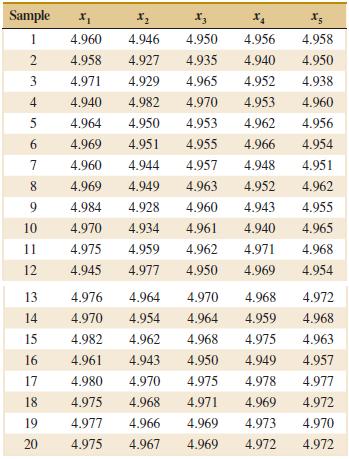
Reconsider the syringe lengths in Exercise 15-10. Suppose that the specifications are set at 4.90 and 5.00.(a) Estimate the process standard deviation.(b) Calculate PCR and PCRk for the process.Exercise 15-10The following data were considered in Quality Engineering [€œAn SPC Case Study on
A study was performed to determine whether men and women differ in repeatability in assembling components on printed circuit boards. Random samples of 25 men and 21 women were selected, and each subject assembled the units. The two sample standard deviations of assembly time were smen = 0.98
Reconsider the pull-strength measurements in Exercise 15-9. Estimate the fallout level if the specifications are 16 ± 5. Estimate PCR and interpret this ratio.Exercise 15-9The pull strength of a wire-bonded lead for an integrated circuit is monitored. The following table provides data for 20
Reconsider the copper-content measurements in Exercise 15-8. Given that the specifications are at 6.0 ± 1.0, estimate PCR and PCRkand interpret these ratios.Exercise 15-8The copper content of a plating bath is measured three times per day, and the results are reported in ppm. The
Reconsider the diameter measurements in Exercise 15-7. Use the revised control limits and process estimates.(a) Estimate PCR and PCRk. Interpret these ratios.(b) What percentage of defectives is being produced by this process?Exercise 15-7An extrusion die is used to produce aluminum rods. The
Consider the hypothesis test H0: σ21 = σ22 against H1: σ21 ≠ σ22. Suppose that the sample sizes are n1 = 15 and n2 = 15, and the sample variances are s21 = 2.3 and s22 = 1.9. Use α = 0.05.(a) Test the hypothesis and explain how the test could be conducted with a confidence interval on σ1 /
Consider the hypothesis test H0: σ21 = σ22 against H1: σ21 > σ22. Suppose that the sample sizes are n1 = 20 and n2 = 8, and that s21 = 4.5 and s22 = 2.3. Use α = 0.01. Test the hypothesis and explain how the test could be conducted with a confidence interval on σ1 / σ2.
Reconsider Exercise 15-4(a). Assuming that both charts exhibit statistical control and that the process specifications are at 20 ± 5, estimate PCR and PCRk and interpret these ratios.Data from 15-4Samples of size n = 6 are collected from a process every hour. After 20 samples have been collected,
Consider the hypothesis test H0: σ21 = σ22 against H1: σ21 < σ22 respectively. Suppose that the sample sizes are n1 = 5 and n2 = 10, and that s21 = 23.2 and s22 = 28.8. Use α = 0.05. Test the hypothesis and explain how the test could be conducted with a confidence interval on σ1 / σ2.
In a series of tests to study the efficacy of ginkgo biloba on memory, Solomon et al. first looked at differences in memory tests of people six weeks before and after joining the study [“Ginkgo for Memory Enhancement: A Randomized Controlled Trial,” Journal of the American Medical Association
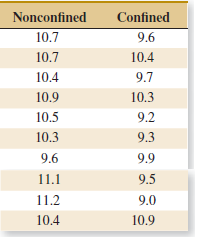
Neuroscientists conducted research in a Canadian prison to see whether solitary confinement affects brain wave activity [€œChanges in EEG Alpha Frequency and Evoked Response Latency During Solitary Confinement,€ Journal of Abnormal Psychology 1972, Vol. 7, pp.
Repeat Exercise 10-59 using the Wilcoxon signe drank test. State carefully what hypothesis is being tested and how it differs from the one tested in Exercise 10-59.
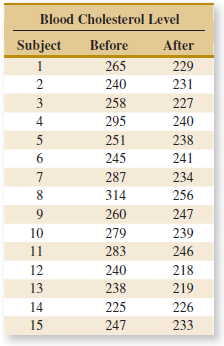
Use the sign test on the blood cholesterol data in Exercise 10-53. Is there evidence that diet and exercise reduce the median cholesterol level?Exercise 10-53Fifteen adult males between the ages of 35 and 50 participated in a study to evaluate the effect of diet and exercise on blood cholesterol
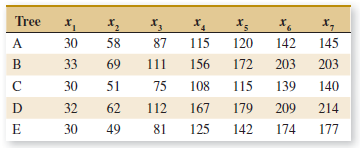
In Biometrics (1990, Vol. 46, pp. 673€“87), the authors analyzed the circumference of five orange trees (labeled as A€“E) measured on seven occasions (xi).(a) Compare the mean increase in circumference in periods 1 to 2 to the mean increase in periods 2 to 3. The increase is the
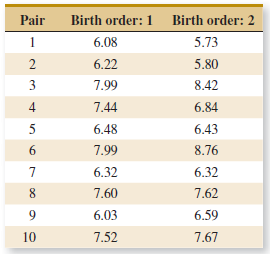
An article in Neurology (1998, Vol. 50, pp. 1246€“1252) discussed that monozygotic twins share numerous physical, psychological, and pathological traits. The investigators measured an intelligence score of 10 pairs of twins, and the data follow:(a) Is the assumption that the difference in
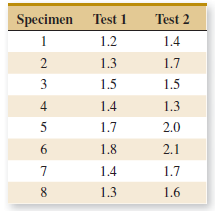
Two different analytical tests can be used to determine the impurity level in steel alloys. Eight specimens are tested using both procedures, and the results are shown in the following tabulation.(a) Is there sufficient evidence to conclude that tests differ in the mean impurity level, using
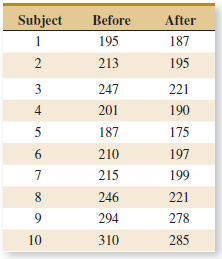
Ten individuals have participated in a diet-modification program to stimulate weight loss. Their weight both before and after participation in the program is shown in the following list.(a) Is there evidence to support the claim that this particular diet-modifi cation program is effective in
Fifteen adult males between the ages of 35 and 50 participated in a study to evaluate the effect of diet and exercise on blood cholesterol levels. The total cholesterol was measured in each subject initially and then three months after participating in an aerobic exercise program and switching to a
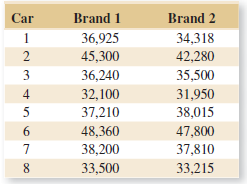
The manager of a fleet of automobiles is testing two brands of radial tires and assigns one tire of each brand at random to the two rear wheels of eight cars and runs the cars until the tires wear out. The data (in kilometers) follow. Find a 99% confidence interval on the difference in mean life.
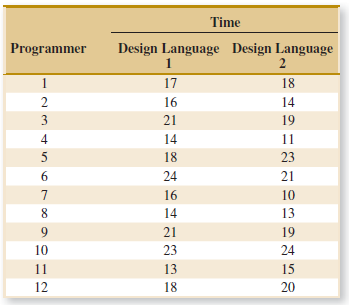
A computer scientist is investigating the usefulness of two different design languages in improving programming tasks. Twelve expert programmers who are familiar with both languages are asked to code a standard function in both languages and the time (in minutes) is recorded. The data follow:(a) Is
Consider the parking data in Example 10-12.(a) Use the paired t-test to investigate the claim that the two types of cars have different levels of difficulty to parallel park. Use α = 0.10.(b) Compare your results with the confidence interval constructed in Example 10-12 and comment on why they are
Consider the shear strength experiment described in Example 10-11.(a) Construct a 95% confidence interval on the difference in mean shear strength for the two methods. Is the result you obtained consistent with the findings in Example 10-11? Explain why.(b) Do each of the individual shear strengths
Reconsider Exercise 15-3. Suppose that the variable is normally distributed with specifications at 220 ± 50. What is the proportion out of specifications? Estimate and interpret PCR and PCRk.Exercise 15-3Control charts are to be constructed for samples of size n = 4, and xÌ… and
Using the data from Exercise 10-37, test the hypotheses using Tukey’s quick test and see whether you reach the same conclusions as you did for Exercise 10-37.Exercise 10-37Olympic swimmers are seeded according to their previous 12-month performances with faster swimmers going into the later
Reconsider Exercise 15-2 in which the specification limits are 14.50 ± 0.50.(a) What conclusions can you draw about the ability of the process to operate within these limits? Estimate the percentage of defective items that is produced.(b) Estimate PCR and PCRk. Interpret these
Another nonparametric test known as Tukey’s quick test can be useful with two groups when one group has the minimum value overall (which we call the lower group) and the other (which we call the upper group) has the maximum. The Tukey test works by counting the “exceedences,” the number of
Consider the distance traveled by a golf ball in Exercise 10-33.(a) Use the Wilcoxon rank-sum test to investigate if the means differ. Use α = 0.05.(b) Use the normal approximation for the Wilcoxon rank-sum test with α = 0.05. Find the approximate P-value for this test.
Reconsider Exercise 15-1. Suppose that the quality characteristic is normally distributed with specification at 220 ± 40. What is the fallout level? Estimate PCR and PCRk and interpret these ratios.Exercise 15-1Control charts for X̅ and R are to be set up for an important quality characteristic.
Consider the pipe deflection data in Exercise 10-22.(a) Use the Wilcoxon rank-sum test for the pipe deflection temperature experiment. If α = 0.05, what are your conclusions?(b) Use the normal approximation for the Wilcoxon rank-sum test. Assume that α = 0.05. Find the approximate P-value for
Consider the chemical etch rate data in Exercise 10-23.(a) Use the Wilcoxon rank-sum test to investigate the claim that the mean etch rate is the same for both solutions. If α = 0.05, what are your conclusions?(b) Use the normal approximation for the Wilcoxon rank-sum test. Assume that α = 0.05.
The manufacturer of a hot tub is interested in testing two different heating elements for its product. The element that produces the maximum heat gain after 15 minutes would be preferable. The manufacturer obtains 10 samples of each heating unit and tests each one. The heat gain after 15 minutes
An electrical engineer must design a circuit to deliver the maximum amount of current to a display tube to achieve sufficient image brightness. Within her allowable design constraints, she has developed two candidate circuits and tests prototypes of each. The resulting data (in microamperes) are as
An article in Quality Engineering [2012, Vol. 24(1)] described an experiment on a grinding wheel. The following are some of the grinding force data (in N) from this experiment at two different vibration levels.(a) Is there evidence to support the claim that the mean grinding force increases with
A normally distributed process uses 85% of the specification band. It is centered at the nominal dimension, located halfway between the upper and lower specification limits.(a) Estimate PCR and PCRk. Interpret these ratios.(b) What fallout level (fraction defective) is produced?
A normally distributed process uses 66.7% of the specification band. It is centered at the nominal dimension, located halfway between the upper and lower specification limits.(a) Estimate PCR and PCRk. Interpret these ratios.(b) What fallout level (fraction defective) is produced?
An article in Polymer Degradation and Stability (2006, Vol. 91) presented data from a nine-year aging study on S537 foam. Foam samples were compressed to 50% of their original thickness and stored at different temperatures for nine years. At the start of the experiment as well as during each year,
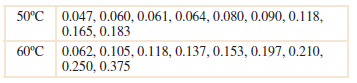
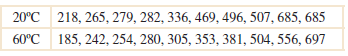
A paper in Quality Engineering [2013, Vol. 25(1)] presented data on cycles to failure of solder joints at different temperatures for different types of printed circuit boards (PCB). Failure data for two temperatures (20 and 60ºC) for a copper-nickel-gold PCB follow.(a) Test the null hypothesis
Suppose that a quality characteristic is normally distributed with specifications at 100 ± 20. The process standard deviation is 6.(a) Suppose that the process mean is 100. What are the natural tolerance limits? What is the fraction defective? Calculate PCR and PCRk and interpret these ratios.(b)
Suppose that a quality characteristic is normally distributed with specifications from 20 to 32 units.(a) What value is needed for σ to achieve a PCR of 1.5?(b) What value for the process mean minimizes the fraction defective? Does this choice for the mean depend on the value of σ?
Suppose that a quality characteristic is normally distributed with specifications from 10 to 30 units. The process standard deviation is 2 units.(a) Calculate the natural tolerance limits, fraction defective, PCR, and PCRk when the process mean is 20.(b) Suppose that the process mean shifts higher
Olympic swimmers are seeded according to their previous 12-month performances with faster swimmers going into the later heats. The last 24 swimmers, however, are distributed among the last three heats more evenly. So we should see large differences in times of heats one€“five but not
An article in Quality & Safety in Health Care [€œStatistical Process Control as a Tool for Research and Healthcare Improvement,€ (2003)Vol. 12, pp. 458€“464] considered a number of control charts in healthcare. The following approximate data were used to construct
An X̅ control chart with 3-sigma control limits and subgroup size n = 4 has control limits UCL = 48.75 and LCL = 40.55.(a) Estimate the process standard deviation.(b) Does the response to part (a) depend on whether r or s was used to construct the X̅ control chart?
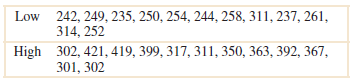
European scientists sampled rivers in various seasons for chemical composition and algae growth (http://archive.ics.uci. edu/ml/datasets/Coil+1999+Competition+Data). The following is a random sample of 15 measurements from high-flow rivers and 13 from low-flow rivers of a total algae content (units
An article in Technometrics (1999, Vol. 41, pp. 202€“211) studied the capability of a gauge by measuring the weights of two sheets of paper. The data follow.(a) Check the assumption that the data from each sheet are from normal distributions.(b) Test the hypothesis that the mean weight of
Consider the data in Exercise 15-10. Calculate the sample standard deviation of all 100 measurements and compare this result to the estimate of σ obtained from your revised X̅ and R charts. Explain any differences.Exercise 15-10The following data were considered in Quality Engineering
Reconsider the paper towel absorbency data from Exercise 10-13. Find a 95% confidence interval on the difference in the towels’ mean absorbency produced by the two processes. Assume the standard deviations are estimated from the data. How would you interpret this CI? Is the value zero in the
Consider the data in Exercise 15-9. Calculate the sample standard deviation of all 60 measurements and compare this result to the estimate of σ obtained from your revised X̅ and R charts. Explain any differences.Exercise 15-9The pull strength of a wire-bonded lead for an
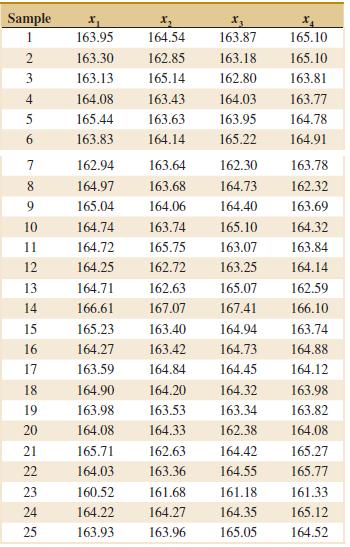
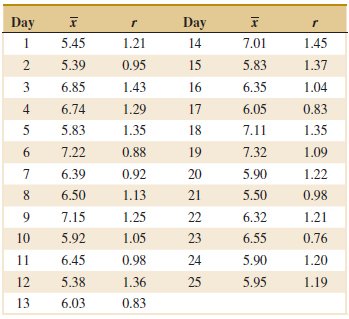
Web traffic can be measured to help highlight security problems or indicate a potential lack of bandwidth. Data on Webtraffic (in thousand hits) fromhttp://en.wikipedia.org/wiki/Web_traffic are given in the following table for 25 samples each of size 4.(a) Use all the data to determine trial
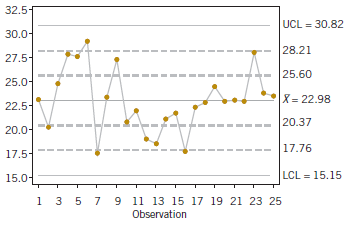
Apply the Western Electric Rules to the following control chart. The warning limits are shown as dotted lines. Describe any rule violations. 32.5- UCL = 30.82 30.0- 28.21 27,5- 25.60 25.0- X = 22.98 22.5- 20.37 20.0- 17.76 17.5- LCL = 15.15 15.0- 5 7 9 11 13 15 17 19 21 23 25 Observation
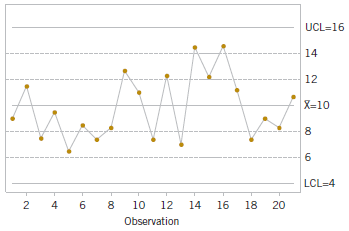
Apply the Western Electric Rules to the following X control chart. The warning limits are shown as dotted lines. Describe any rule violations. UCL=16 14 12 X=10 6. LCL=4 4 10 12 14 16 18 20 Observation LO 2.
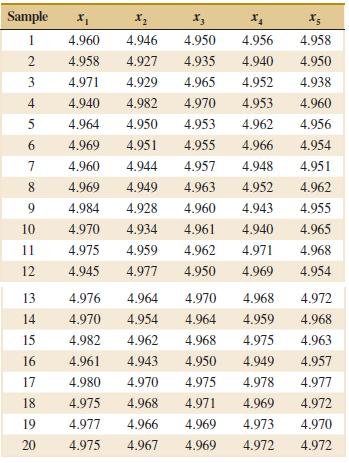
The following data were considered in Quality Engineering [€œAn SPC Case Study on Stabilizing Syringe Lengths€ (1999€“2000, Vol. 12(1))]. The syringe length is measured during a pharmaceutical manufacturing process. The following table provides data (in inches) for 20 samples each of
The pull strength of a wire-bonded lead for an integrated circuit is monitored. The following table provides data for 20 samples each of size 3.(a) Use all the data to determine trial control limits for X and R charts, construct the control limits, and plot the data.(b) Use the control limits from
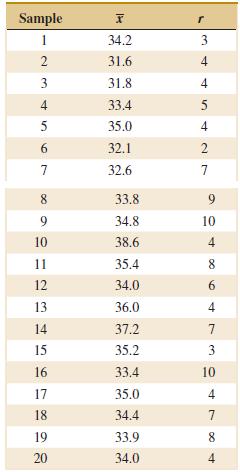
The copper content of a plating bath is measured three times per day, and the results are reported in ppm. The xÌ… and r values for 25 days are shown in the following table:(a) Using all the data, find trial control limits for XÌ… and R charts, construct the chart, and plot
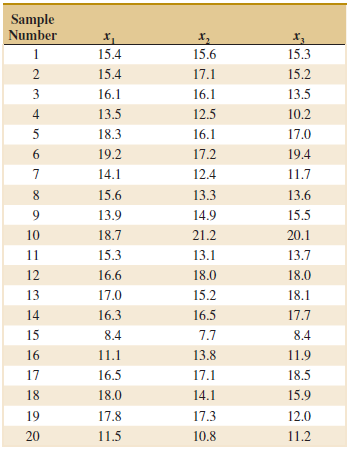
An article in Radio Engineering and Electronic Physics [1984, Vol. 29 No. (3), pp. 63–66] investigated the behavior of a stochastic generator in the presence of external noise. The number of periods was measured in a sample of 100 trains for each of two different levels of noise voltage, 100 and
An article in IEEE International Symposium on Electromagnetic Compatibility (2002, Vol. 2, pp. 667–670) quantified the absorption of electromagnetic energy and the resulting thermal effect from cellular phones. The experimental results were obtained from in vivo experiments conducted on rats. The
An article in Electronic Components and Technology Conference (2001, Vol. 52, pp. 1167–1171) compared single versus dual spindle saw processes for copper metallized wafers. A total of 15 devices of each type were measured for the width of the backside chipouts, x̅single = 66.385, ssingle = 7.895
The thickness of a plastic film (in mils) on a substrate material is thought to be influenced by the temperature at which the coating is applied. In completely randomized experiment, 11 substrates are coated at 125°F, resulting in a sample mean coating thickness of x̅1 = 103.5 and a sample
The melting points of two alloys used in formulating solder were investigated by melting 21 samples of each material. The sample mean and standard deviation for alloy 1 was x̅1 = 420°F and s1 = 4°F, and for alloy 2, they were x̅2 = 426°F and s2 = 3°F.(a) Do the sample data support the claim
Two catalysts may be used in a batch chemical process. Twelve batches were prepared using catalyst 1, resulting in an average yield of 86 and a sample standard deviation of 3. Fifteen batches were prepared using catalyst 2, and they resulted in an average yield of 89 with a standard deviation of 2.
Consider the hypothesis test H0: μ1 = μ2 against H1: μ1 ≠ μ2. Suppose that sample sizes n1 = 10 and n2 = 10, that x̅1 = 7.8 and x̅2 = 5.6, and that s21 = 4 and s22 = 9. Assume that σ21 = σ22 and that the data are drawn from normal distributions. Use α = 0.05.(a) Test the hypothesis and
Showing 300 - 400
of 1157
1
2
3
4
5
6
7
8
9
10
11
12
Step by Step Answers