New Semester
Started
Get
50% OFF
Study Help!
--h --m --s
Claim Now
Question Answers
Textbooks
Find textbooks, questions and answers
Oops, something went wrong!
Change your search query and then try again
S
Books
FREE
Study Help
Expert Questions
Accounting
General Management
Mathematics
Finance
Organizational Behaviour
Law
Physics
Operating System
Management Leadership
Sociology
Programming
Marketing
Database
Computer Network
Economics
Textbooks Solutions
Accounting
Managerial Accounting
Management Leadership
Cost Accounting
Statistics
Business Law
Corporate Finance
Finance
Economics
Auditing
Tutors
Online Tutors
Find a Tutor
Hire a Tutor
Become a Tutor
AI Tutor
AI Study Planner
NEW
Sell Books
Search
Search
Sign In
Register
study help
mathematics
applied statistics and probability
Applied Statistics And Probability For Engineers 6th Edition Douglas C. Montgomery, George C. Runger - Solutions
Consider an X̅ control chart with r̅ = 0.344, UCL = 14.708, LCL = 14.312, and n = 5. Suppose that the mean shifts to 14.6.(a) What is the probability that this shift is detected on the next sample?(b) What is the ARL after the shift?
Consider the X control chart in Fig. 15-3. Suppose that the mean shifts to 74.010 millimeters.(a) What is the probability that this shift is detected on the next sample?(b) What is the ARL after the shift?Fig. 15-13 15 10 5 18 19 20 21 22 23 24 25 26 27 28 29 30 31 32 33 34 35 36 37 38 39 40 41 42
An X̅ chart uses samples of size 4. The center line is at 100, and the upper and lower 3-sigma control limits are at 106 and 94, respectively.(a) What is the process σ?(b) Suppose that the process mean shifts to 96. Find the probability that this shift is detected on the next sample.(c) Find the
An X chart uses samples of size 1. The center line is at 100, and the upper and lower 3-sigma limits are at 112 and 88, respectively.(a) What is the process σ?(b) Suppose that the process mean shifts to 96. Find the probability that this shift is detected on the next sample.(c) Find the ARL to
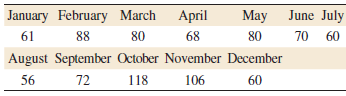
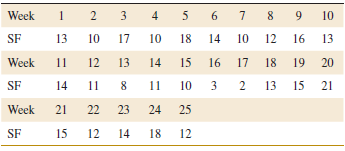
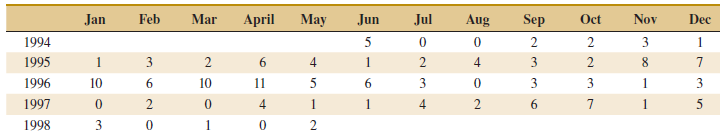
A article in Graefe€™s Archive for Clinical and Experimental Ophthalmology [€œStatistical Process Control Charts for Ophthalmology,€ considered the number of cataract surgery cases by month. The data are shown in the following table.(a) What type of control chart is
A article of Epilepsy Research [€œStatistical Process Control (SPC): A Simple Objective Method for Monitoring Seizure Frequency and Evaluating Effectiveness of Drug Interventions in Refractory Childhood Epilepsy,€ (2010, Vol 91,pp. 205€“213)] used control charts to
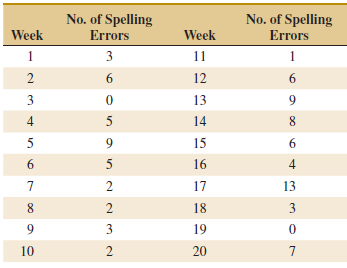
The following data are the number of spelling errors detected for every 1000 words on a news Web site over 20 weeks.(a) What control chart is most appropriate for these data?(b) Using all the data, compute trial control limits for the chart in part (a), construct the chart, and plot the data.(c)
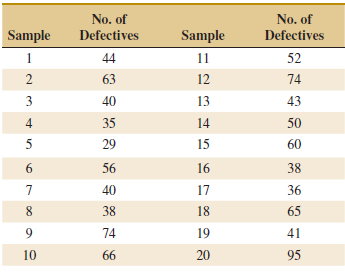
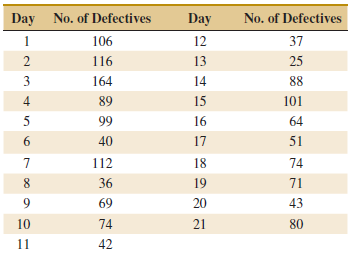
In a semiconductor manufacturing company, samples of 200 wafers are tested for defectives in the lot. See the number of defectives in 20 such samples in the following table.(a) Set up a P chart for this process. Is the process in statistical control?(b) Suppose that instead of samples of size 200,
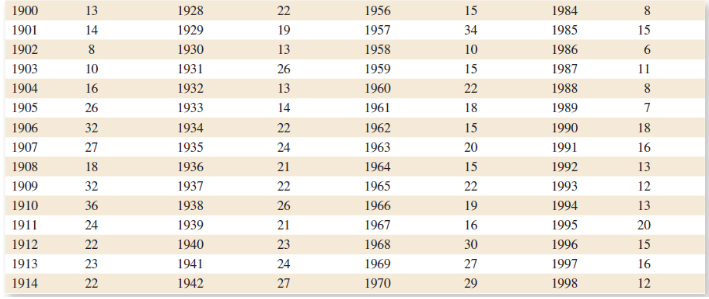
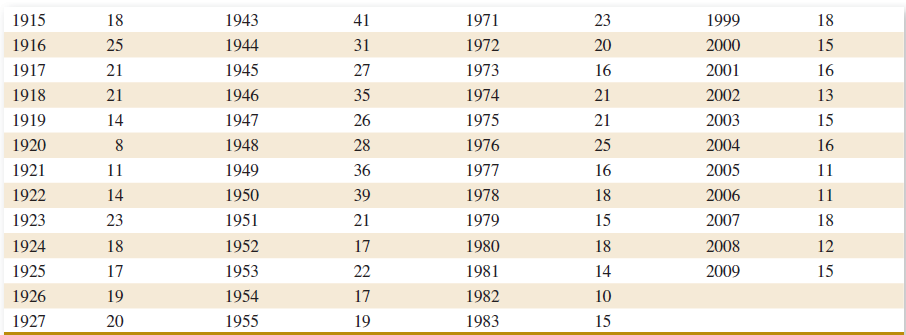
Consider the data on the number of earthquakes of magnitude 7.0 or greater by year in Exercise 6-87.(a) Construct a U chart for this data with a sample size of n = 1.(b) Do the data appear to be generated by an in-control process? Explain.Exercise 6-87Table 6E.3 shows the number of earthquakes per
The following represent the number of solder defects observed on 24 samples of five printed circuit boards: 7, 6, 8, 10, 24, 6, 5, 4, 8, 11, 15, 8, 4, 16, 11, 12, 8, 6, 5, 9, 7, 14, 8, 21.(a) Using all the data, compute trial control limits for a U control chart, construct the chart, and plot
The following represent the number of defects per 1000 feet in rubber-covered wire: 1, 1, 3, 7, 8, 10, 5, 13, 0, 19, 24, 6, 9, 11, 15, 8, 3, 6, 7, 4, 9, 20, 11, 7, 18, 10, 6, 4, 0, 9, 7, 3,1, 8, 12. Do the data come from a controlled process?
The following are the numbers of defective solder joints found during successive samples of 500 solder joints:(a) Using all the data, compute trial control limits for a fraction- defective control chart, construct the chart, and plot the data.(b) Determine whether the process is in statistical
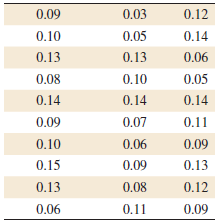
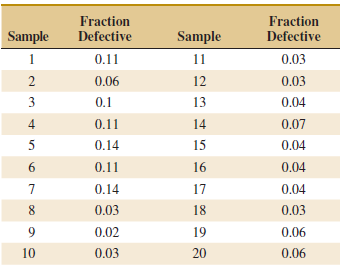
Suppose that the following fraction defective has been found in successive samples of size 100 (read down):(a) Using all the data, compute trial control limits for a fraction- defective control chart, construct the chart, and plot the data.(b) Determine whether the process is in statistical
Consider the inventory accuracy in Exercise 15-27. Because lower values are better, only the UCL = 0 3 . is specified. Use the revised control chart to calculate PCRk.Exercise 15-27An article in Journal of the Operational Research Society [€œA Quality Control Approach for Monitoring
Consider the turnaround time (TAT) for complete blood counts in Exercise 15-18. Suppose that the specifications for TAT are set at 20 and 80 minutes. Use the control chart summary statistics for the following.(a) Estimate the process standard deviation.(b) Calculate PCR and PCRk for the process.
The control limits for an X̅ chart with n = 4 are 12.8 and 24.8, and the PCR for a measurement is 1.33.(a) Estimate the process standard deviation σ.(b) Calculate the specification limits. Assume that they are centered around the process mean.
A article in the Journal of Quality in Clinical Practice [€œThe Application of Statistical Process Control Charts to the Detection and Monitoring of Hospital-Acquired Infections,€ (2001, Vol. 21, pp. 112€“117)] reported the use of SPC methods to monitor
An article in Microelectronics Reliability [€œAdvanced Electronic Prognostics through System Telemetry and Pattern Recognition Methods,€ (2007, 47(12), pp. 1865€“1873)] presented an example of electronic prognostics (a technique to detect faults in order to decrease the system downtime
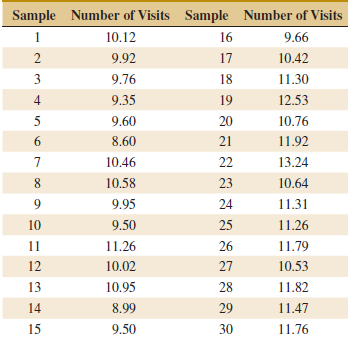
The number of visits (in millions) on a Web site is recorded every day. The following table shows the samples for 25 consecutive days.(a) Estimate the process standard estimation.(b) Set up a CUSUM control chart for this process, assuming the target is 10. Does the process appear to be in control?
Consider an X̅ control chart with UCL = 32.802, UCL = 24.642, and n = 5. Suppose that the mean shifts to 30.(a) What is the probability that this shift is detected on the next sample?(b) What is the ARL to detect the shift?
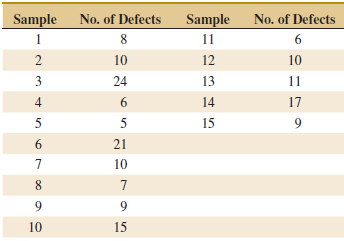
The following are the number of defects observed on 15 samples of transmission units in an automotive manufacturing company. Each lot contains five transmission units.(a) Using all the data, compute trial control limits for a U control chart, construct the chart, and plot the data.(b) Determine
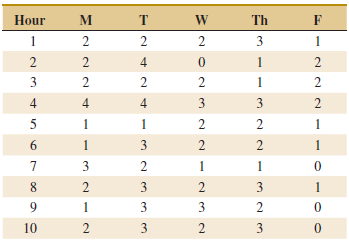
The following table shows the number of e-mails a student received each hour from 8:00 a.m. to 6:00 p.m. The samples are collected for five days from Monday to Friday.(a) Use the rational subgrouping principle to comment on why an XÌ… chart that plots one point each hour with a subgroup
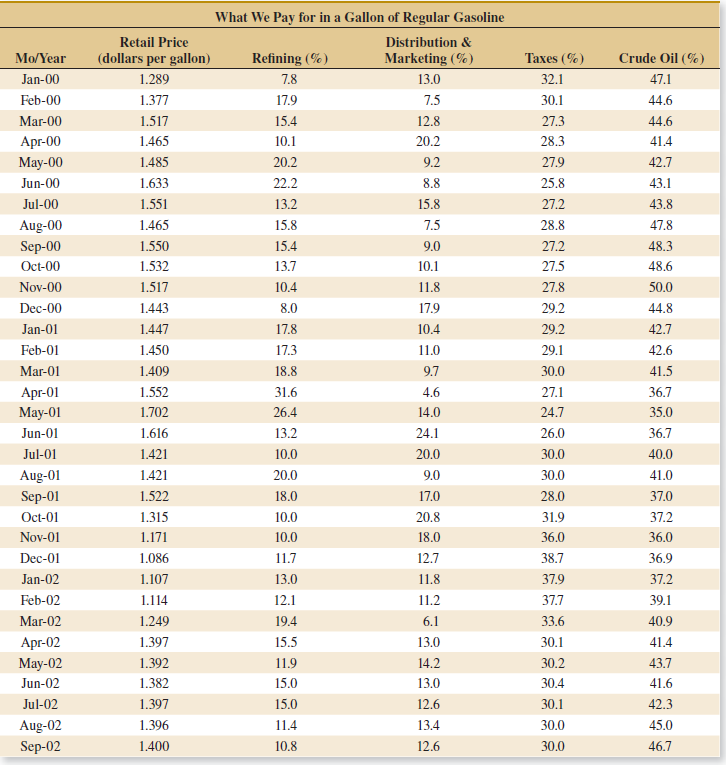
The following table provides the costs for gasoline by month in the United States over recent years and the percentage of the cost due to refining, distribution and marketing, taxes, and crude oil. The table is from the U.S. Department of Energy Web site
An EWMA chart with λ = 0.5 and L = 3.07 is to be used to monitor a process. Suppose that the process mean is μ0 = 10 and σ = 2.(a) Assume that n = 1. What is the ARL without any shift in the process mean? What is the ARL to detect a shift to μ = 12.(b) Assume that n = 4. Repeat part (a)
Suppose that the average number of defects in a unit is known to be 10. If the mean number of defects in a unit shifts to 14, what is the probability that it is detected by a U chart on the first sample following the shift(a) if the sample size is n = 1?(b) if the sample size is n = 4? Use a normal
Suppose that the average number of defects in a unit is known to be 8. If the mean number of defects in a unit shifts to 16, what is the probability that it is detected by a U chart on the first sample following the shift(a) if the sample size is n = 4?(b) if the sample size is n = 10? Use a normal
Suppose that a process has a PCR = 2, but the mean is exactly 3 standard deviations above the upper specification limit. What is the probability of making a product outside the specification limits?
Consider a control chart for individuals with 3-sigma limits. What is the probability that there is not a signal in 3 samples? In 6 samples? In 10 samples?
The depth of a keyway is an important part quality characteristic. Samples of size n = 5 are taken every four hours from the process, and 20 samples are summarized in the following table.(a) Using all the data, find trial control limits for XÌ… and R charts. Is the process in control?(b) Use the
Consider a control chart for individuals applied to a continuous 24-hour chemical process with observations taken every hour.(a) If the chart has 3-sigma limits, verify that the in-control ARL is 370. How many false alarms would occur each 30-day month, on the average, with this chart?(b) Suppose
Consider the control chart for individuals with 3-sigma limits.(a) Suppose that a shift in the process mean of magnitude σ occurs. Verify that the ARL for detecting the shift is ARL = 43.9.(b) Find the ARL for detecting a shift of magnitude 2σ in the process mean.(c) Find the ARL for detecting a
Suppose that a process is in control and an X chart is used with a sample size of 4 to monitor the process. Suddenly there is a mean shift of 1.5σ.(a) If 3-sigma control limits are used on the X chart, what is the probability that this shift remains undetected for three consecutive samples?(b) If
The following data were considered in Quality Progress [€œDigidot Plots for Process Surveillance€ (1990, May, pp. 66€“68)]. Measurements of center thickness (in mils) from 25 contact lenses sampled from the production process at regular intervals are shown in the
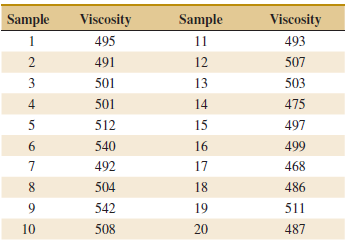
Reconsider the viscosity data in Exercise 15-22. Construct a CUSUM control chart for this process using μ0= 500 as the process target. Explain how you determined your estimate of σ and the CUSUM parameters H and K.Exercise 15-22The viscosity of a chemical intermediate is
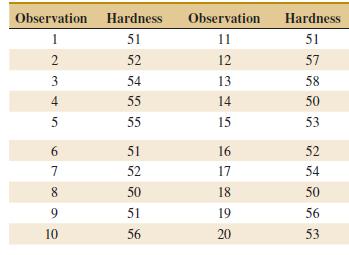
Consider the hardness measurement data in Exercise 15-19. Set up a CUSUM scheme for this process using μ = 50 and σ = 2 so that K = 1 and H = 10. Is the process in control?Exercise 15-19Twenty successive hardness measurements are made on a metal alloy, and the data are shown in the following
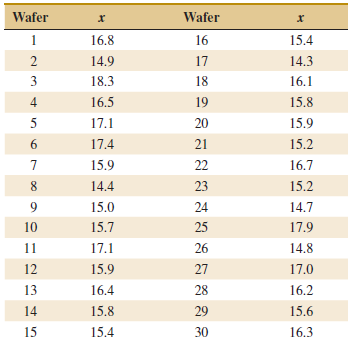
Consider the data in Exercise 15-20. Set up a CUSUM scheme for this process assuming that μ = 16 is the process target. Explain how you determined your estimate of σ and the CUSUM parameters K and H.Exercise 15-20In a semiconductor manufacturing process, CVD metal thickness
Consider the hub data in Exercise 15-95.(a) Construct an EWMA control chart with λ = 0.2 and L = 3. Comment on process control.(b) Construct an EWMA control chart with λ = 0.5 and L = 3 and compare your conclusion to part (a).Exercise 15-95An article in Quality Engineering
Consider the renewable energy data in Exercise 15-96.(a) Construct an EWMA control chart with λ = 0.2 and L = 3. Do the data appear to be generated from an in control process?(b) Construct an EWMA control chart with λ = 0.5 and L = 3 and compare your conclusion to part
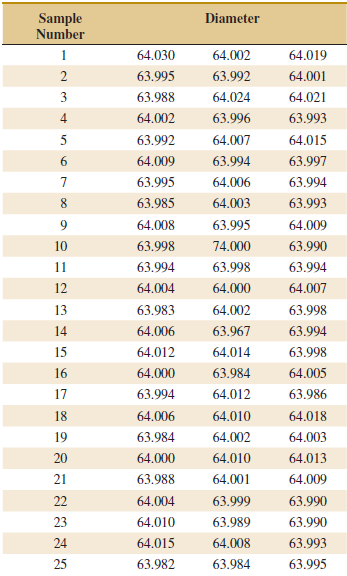
Consider the diameter data in Exercise 15-91.(a) Construct an EWMA control chart with λ = 0.2 and L = 3. Comment on process control.(b) Construct an EWMA control chart with λ = 0.5 and L = 3 and compare your conclusion to part (a).Exercise 15-91The diameter of fuse pins
Suppose that an X̅ control chart with 2-sigma limits is used to control a process. Find the probability that a false out-of-control signal is produced on the next sample. Compare this with the corresponding probability for the chart with 3-sigma limits and discuss. Comment on when you would prefer
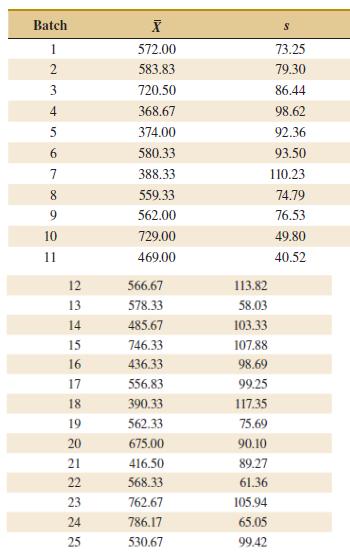
The following dataset was considered in Quality Engineering [€œAnalytic Examination of Variance Components€ (1994€“1995, Vol. 7(2)]. A quality characteristic for cement mortar briquettes was monitored. Samples of size n = 6 were taken from the process, and 25 samples from the process are
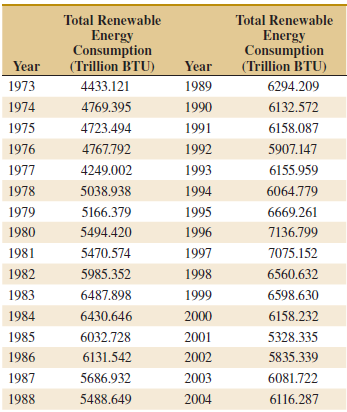
The following data from the U.S. Department of Energy Web site (www.eia.doe.gov) reported the total U.S. renewable energy consumption by year (trillion BTU) from 1973 to 2004.(a) Using all the data, find calculate control limits for a control chart for individual measurements, construct the chart,
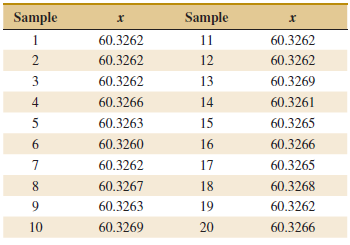
An article in Quality Engineering [€œIs the Process Capable? Tables and Graphs in Assessing Cpm€ (1992, Vol. 4(4)]. Considered manufacturing data. Specifications for the outer diameter of the hubs were 60.3265 ± 0.001 mm. A random sample with size n = 20 was taken and
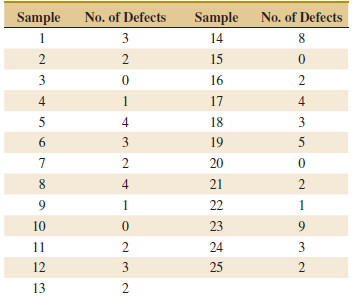
Cover cases for a personal computer are manufactured by injection molding. Samples of five cases are taken from the process periodically, and the number of defects is noted. Twenty-five samples follow:(a) Using all the data, find trial control limits for a U chart for the process.(b) Use the trial
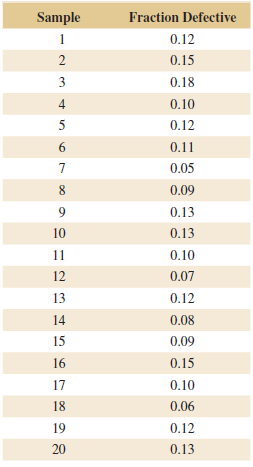
Plastic bottles for liquid laundry detergent are formed by blow molding. Twenty samples of n = 100 bottles are inspected in time order of production, and the fraction defective in each sample is reported. The data are as follows:(a) Set up a P chart for this process. Is the process in statistical
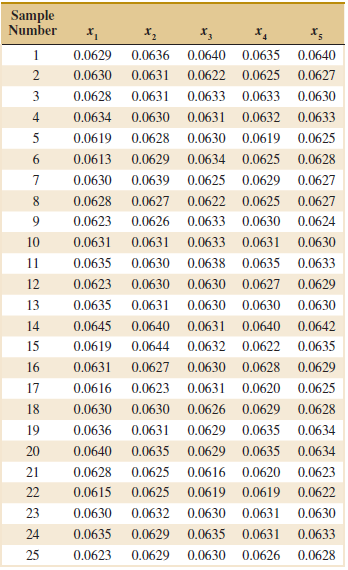
Rework Exercise 15-91 with XÌ… and S charts.Exercise 15-91The diameter of fuse pins used in an aircraft engine application is an important quality characteristic. Twenty-five samples of three pins each are shown as follows:(a) Set up XÌ… and R charts for this process. If
The diameter of fuse pins used in an aircraft engine application is an important quality characteristic. Twenty-five samples of three pins each are shown as follows:(a) Set up XÌ… and R charts for this process. If necessary, revise limits so that no observations are out of control.(b)
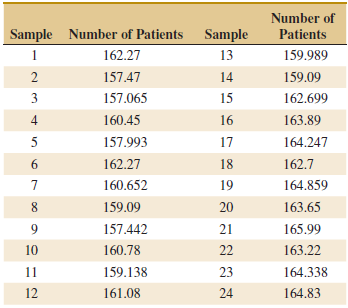
Consider the influenza data in Exercise 15-84. Use μ =160 and σ = 2.(a) Construct an EWMA control chart with λ = 0.1. Use L = 2.81. Does the process appear to be in control?(b) Construct an EWMA control chart with λ = 0.5. Use L = 3.07. Compare
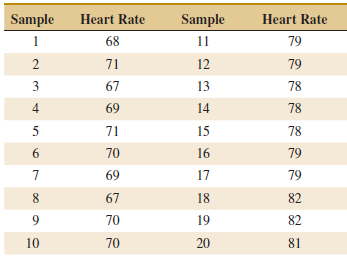
Consider the heart rate data in Exercise 15-83. Use μ = 70 and σ = 3.(a) Construct an EWMA control chart with λ = 0.1. Use L = 2.81. Does the process appear to be in control?(b) Construct an EWMA control chart with λ = 0.5. Use L = 3.07. Compare
The number of influenza patients (in thousands) visiting hospitals weekly is shown in the following table. Suppose that the standard deviation is σ = 2 and the target value is 160.(a) Design a CUSUM scheme for the process. Does the process appear to be in control at the target?(b) How
Heart rate (in counts/minute) is measured every 30 minutes. The results of 20 consecutive measurements are as follows:Suppose that the standard deviation of the heart rate is σ = 3 and the target value is 70.(a) Design a CUSUM scheme for the heart rate process. Does the process appear to
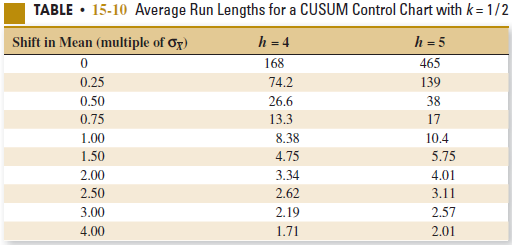
A process has a target of μ0= 100 and a standard deviation of σ = 4. Samples of size n = 1 are taken every two hours. Use Table 15-10.(a) Suppose that the process mean shifts to μ = 102. How many hours of production occur before the process shift is detected
An early example of SPC was described in Industrial Quality Control [€œThe Introduction of Quality Control at Colonial Radio Corporation€ (1944, Vol. 1(1), pp. 4€“9)]. The following are the fractions defective of shaft and washer assemblies during the month of April
The PCR for a measurement is 1.5 and the control limits for an X chart with n = 4 are 24.6 and 32.6.(a) Estimate the process standard deviation σ.(b) Assume that the specification limits are centered around the process mean. Calculate the specification limits.
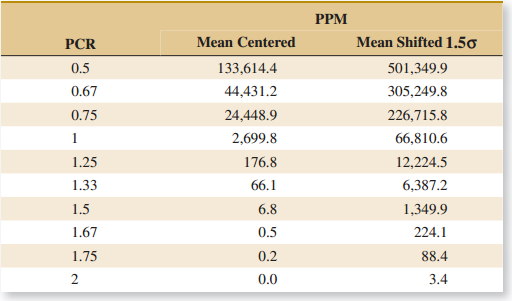
A process mean is centered between the specification limits and PCR = 1.33. Assume that the process mean increases by 1.5σ.(a) Calculate PCR and PCRk for the shifted process.(b) Calculate the estimated fallout from the shifted process and compare your result to those in Table 15-4.
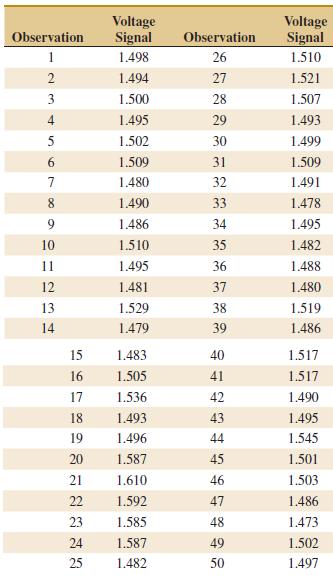
A control chart for individual observations has 3-sigma control limits UCL = 1.80 and LCL = 1.62. The process specification limits are (1.64, 1.84).(a) Estimate the process standard deviation.(b) Calculate PCR and PCRk for the process.
An X control chart with 3-sigma control limits and subgroup size n = 4 has control limits UCL = 28.8 and LCL = 24.6. The process specification limits are (24, 32).(a) Estimate the process standard deviation.(b) Calculate PCR and PCRk for the process.
Suppose that a quality characteristic is normally distributed with specifications at 150 ± 20. Natural tolerance limits for the process are 150 ± 18.(a) Calculate the process standard deviation.(b) Calculate PCR and PCRk of the process. Calculate the percentage of the specification width used by
Suppose that a quality characteristic is normally distributed with specifications at 120 ± 20. The process standard deviation is 6.5.(a) Suppose that the process mean is 120. What are the natural tolerance limits? What is the fraction defective? Calculate PCR and PCRk and interpret these
Reconsider the viscosity measurements in Exercise 15-22. The specifications are 500 ± 25. Calculate estimates of the process capability ratios PCR and PCRkfor this process and provide an interpretation.Exercise 15-22The viscosity of a chemical intermediate is measured every hour. Twenty
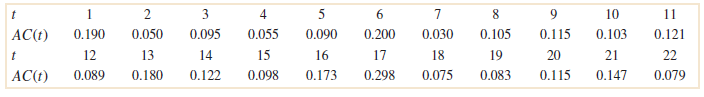
An article in Journal of the Operational Research Society [€œA Quality Control Approach for Monitoring Inventory Stock Levels,€ (1993, pp. 1115€“1127)] reported on a control chart to monitor the accuracy of an inventory management system. Inventory accuracy at time t,
An article in Quality & Safety in Health Care [€œStatistical Process Control as a Tool for Research and Healthcare Improvement,€ (2003 Vol. 12, pp. 458€“464)] considered a number of control charts in healthcare. An X chart was constructed for the amount of
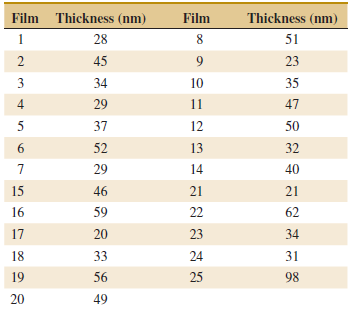
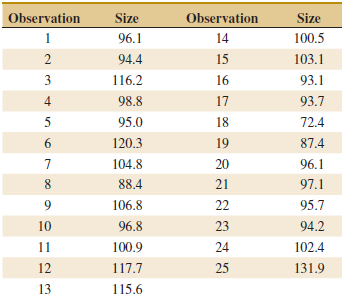
Pulsed laser deposition technique is a thin film deposition technique with a high-powered laser beam. Twenty-five films were deposited through this technique. The thicknesses of the films obtained are shown in the following table.(a) Using all the data, compute trial control limits for individual
The following table of data was analyzed in Quality Engineering [1991€“1992, Vol. 4(1)]. The average particle size of raw material was obtained from 25 successive samples.(a) Using all the data, compute trial control limits for individual observations and moving-range charts. Construct
The viscosity of a chemical intermediate is measured every hour. Twenty samples each of size n = 1 are in the following table.(a) Using all the data, compute trial control limits for individual observations and moving-range charts. Determine whether the process is in statistical control. If not,
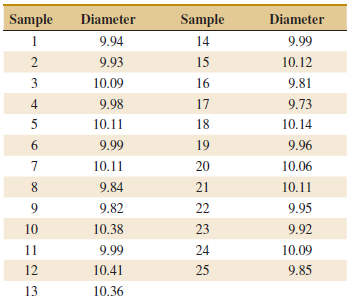
An automatic sensor measures the diameter of holes in consecutive order. The results of measuring 25 holes are in the following table.(a) Using all the data, compute trial control limits for individual observations and moving-range charts. Construct the control chart and plot the data. Determine
In a semiconductor manufacturing process, CVD metal thickness was measured on 30 wafers obtained over approximately two weeks. Data are shown in the following table.(a) Using all the data, compute trial control limits for individual observations and moving-range charts. Construct the chart and plot
The thickness of a metal part is an important quality parameter. Data on thickness (in inches) are given in the following table, for 25 samples of five parts each.(a) Using all the data, find trial control limits for X and R charts, construct the chart, and plot the data. Is the process in
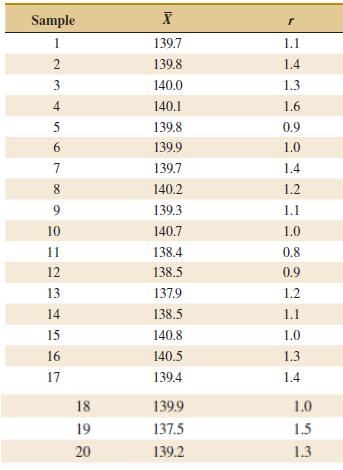
An extrusion die is used to produce aluminum rods. The diameter of the rods is a critical quality characteristic. The following table shows xÌ… and r values for 20 samples of five rods each. Specifications on the rods are 0.5035 ± 0.0010 inch. The values given are the last three digits of the
An X̅ control chart with three-sigma control limits has UCL = 48.75 and LCL = 42.71. Suppose that the process standard deviation is σ = 2.25. What subgroup size was used for the chart?
The level of cholesterol (in mg/dL) is an important index for human health. The sample size is n = 5. The following summary statistics are obtained from cholesterol measurements:(a) Find trial control limits for X and R charts.(b) Repeat part (a) for X and S charts. 30 30 30 Σ-140.03, Ση-13.63 ,
Samples of size n = 6 are collected from a process every hour. After 20 samples have been collected, we calculate x̅̅ = 20.0 and r̅ / d2 = 1.4.(a) Calculate trial control limits for X and R charts.(b) If s̅ / c4 = 1.5, calculate trial control limits for X̅ and S charts.
Control charts are to be constructed for samples of size n = 4, and xÌ… and s are computed for each of 20 preliminary samples as follows:(a) Calculate trial control limits for XÌ… and S charts.(b) Assuming the process is in control, estimate the process mean and standard
Twenty-five samples of size 5 are drawn from a process at one-hour intervals, and the following data are obtained:(a) Calculate trial control limits for XÌ… and R charts.(b) Repeat part (a) for XÌ… and S charts. 25 25 25 Ση-8.60 Σ5-3.64 i=1 Σ362.75 i=1 i=1
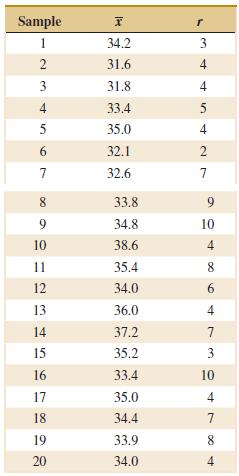
Control charts for XÌ… and R are to be set up for an important quality characteristic. The sample size is n = 5, and xÌ… and r are computed for each of 35 preliminary samples. The summary data are(a) Calculate trial control limits for XÌ… and R charts.(b)
Show that can express the residuals from a multiple regression model as e =−(I - H)y where H = X(X X)-1 X'.
A regression model is used to relate a response to k = 4 regressors with n = 20. What is the smallest value of R2 that will result in a significant regression if α = 0.05? Use the results of the previous exercise. Are you surprised by how small the value of R2 is?
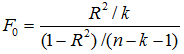
Consider a multiple regression model with k regressors. Show that the test statistic for significance of regression can be written as Suppose that n = 20, k = 4, and R2 = 090. If α = 0.05, what conclusion would you draw about the relationship between and the four regressors? R? Ik F = (1–
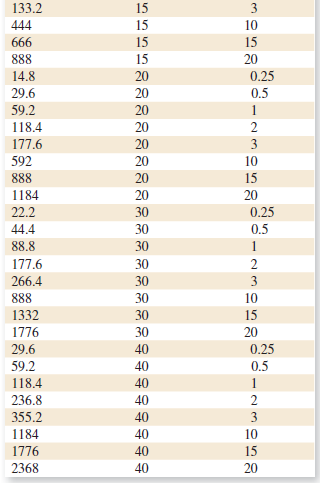
Consider the following inverse model matrix.
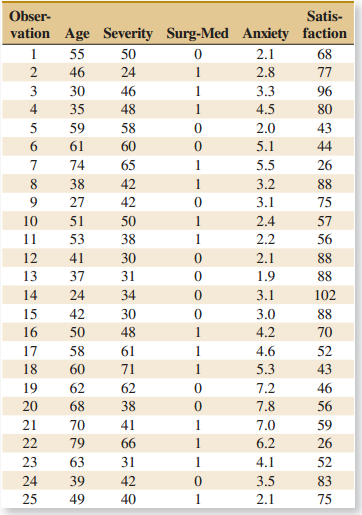
Exercise 12-9 introduced the hospital patient satisfaction survey data. One of the variables in that data set is a categorical variable indicating whether the patient is a medical patient or a surgical patient. Fit a model including this indicator variable to the data using all three of the other
A multiple regression model was used to relate y = viscosity of a chemical product to x1 = temperature and x2 = reaction time. The data set consisted of n = 15 observations.(a) The estimated regression coefficients were β0 = 300.00, β1 = 1.085, and β2 = 10.40. Calculate an estimate of mean
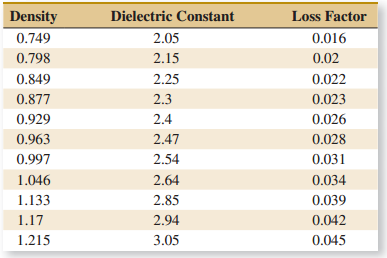
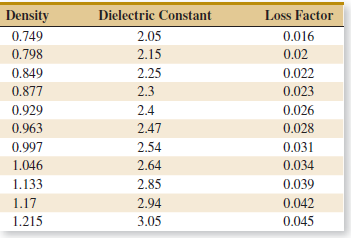
An article in IEEE Transactions on Instrumentation and Measurement (2001, Vol. 50, pp. 2033€“2040) reported on a study that had analyzed powdered mixtures of coal and limestone for permittivity. The errors in the density measurement was the response. The data are reported in Table
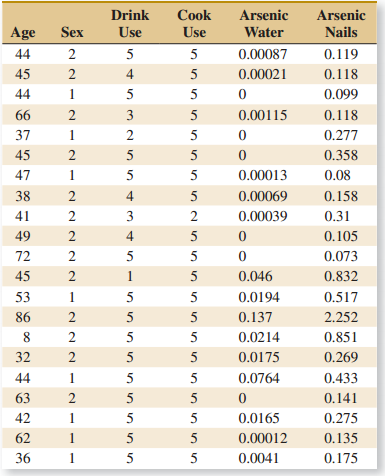
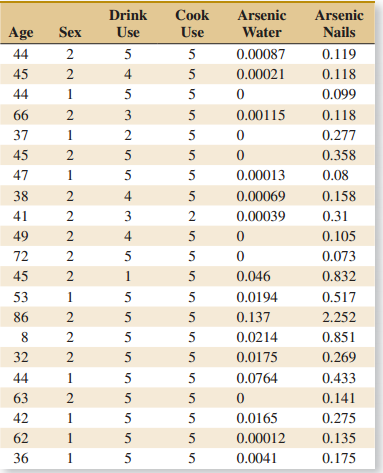
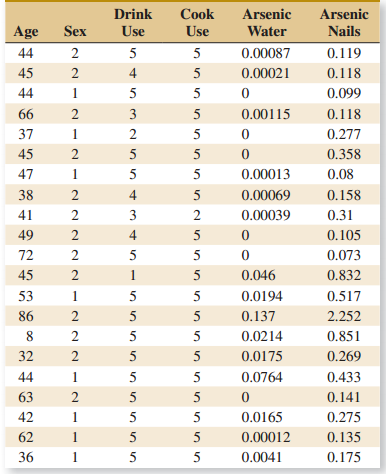
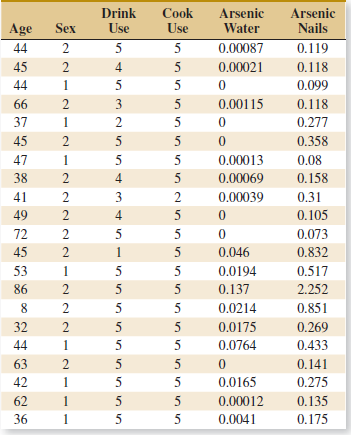
An article in Cancer Epidemiology, Biomarkers and Prevention (1996, Vol. 5, pp. 849€“852) reported on a pilot study to assess the use of toenail arsenic concentrations as an indicator of ingestion of arsenic-containing water. Twenty-one participants were interviewed regarding use of their
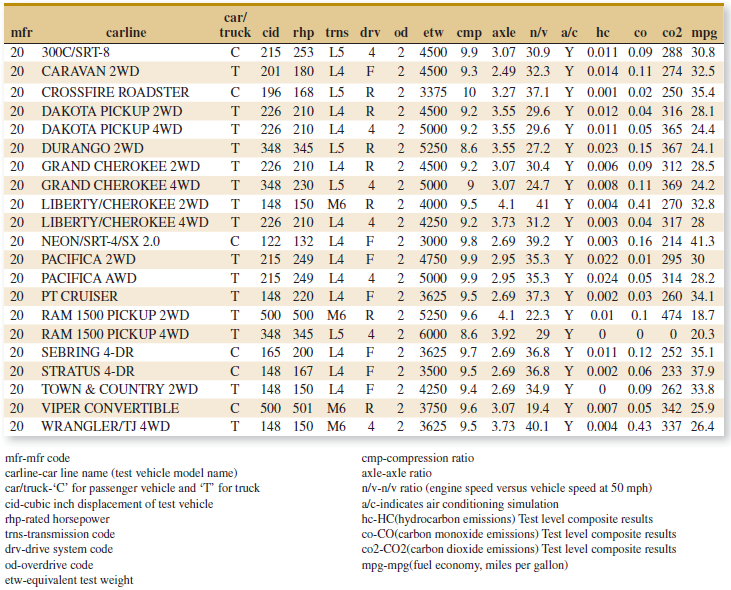
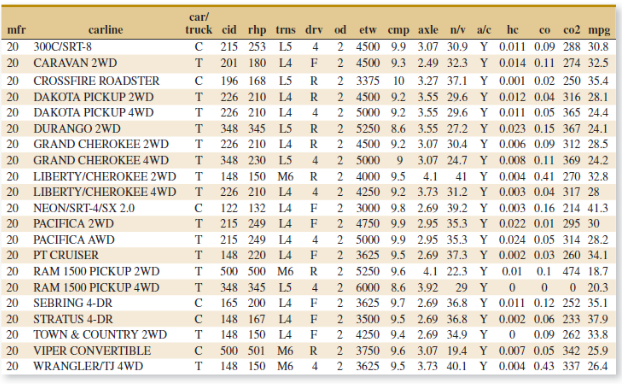
Table E12-3 provides the highway gasoline mileage test results for 2005 model year vehicles from DaimlerChrysler.The full table of data (available on the book€™s Web site) contains the same data for 2005 models from over 250 vehicles from many manufacturers (Environmental Protection
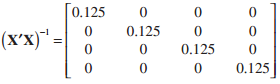
Consider the following inverse of the model matrix:
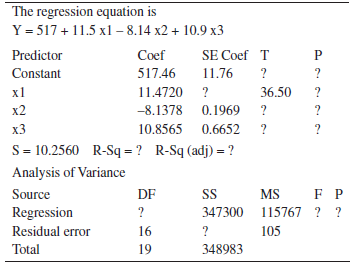
Consider the following computer output.(a) Fill in the missing values. Use bounds for the P-values.(b) Is the overall model significant at α = 0.05? Is it significant at α = 0.01?(c) Discuss the contribution of the individual regressors to the model. The regression
Consider the gas mileage data in Exercise 12-11. Build regression models for the data from the numerical regressors using the following techniques:(a) All possible regressions.(b) Stepwise regression.(c) Forward selection.(d) Backward elimination.(e) Comment on the models obtained. Which model
Consider the arsenic data in Exercise 12-16. Use arsenic in nails as the response and age, drink use, and cook use as the regressors. Build regression models for the data using the following techniques:(a) All possible regressions.(b) Stepwise regression.(c) Forward selection.(d) Backward
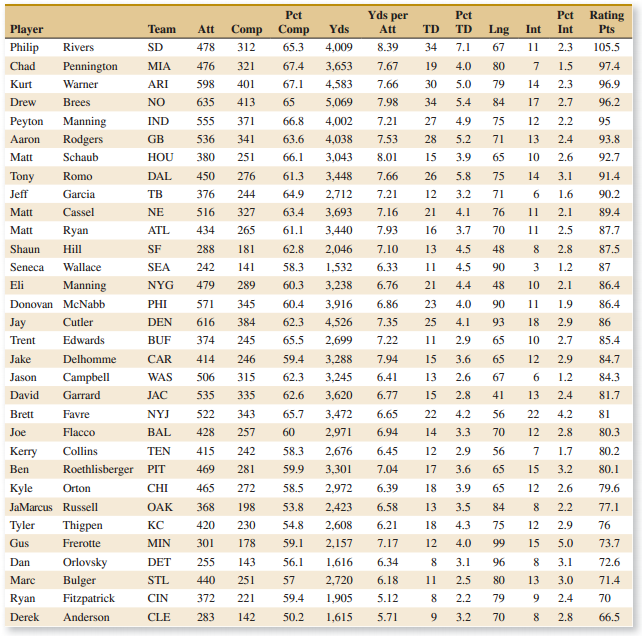
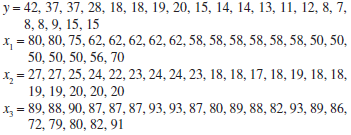
Use the football data in Exercise 12-21 to build regression models using the following techniques:(a) All possible regressions. Find the equations that minimize MSE and that minimize Cp.(b) Stepwise regression.(c) Forward selection.(d) Backward elimination.(e) Comment on the various models
Consider the stack loss data in Exercise 12-20. Build regression models for the data using the following techniques:(a) All possible regressions.(b) Stepwise regression.(c) Forward selection.(d) Backward elimination.(e) Comment on the models obtained. Which model would you prefer? Why?(f) Remove
Consider the nisin extraction data in Exercise 12-18. Build regression models for the data using the following techniques:(a) All possible regressions.(b) Stepwise regression.(c) Forward selection.(d) Backward elimination.(e) Comment on the models obtained. Which model would you prefer?
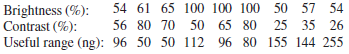
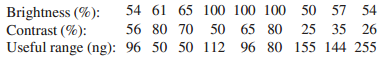
Consider the gray range modulation data in Exercise 12-19. Use the useful range as the response. Build regression models for the data using the following techniques:(a) All possible regressions.(b) Stepwise regression.(c) Forward selection.(d) Backward elimination.(e) Comment on the models
Consider the regression model fit to the coal and limestone mixture data in Exercise 12-17. Use density as the response. Build regression models for the data using the following techniques:(a) All possible regressions.(b) Stepwise regression.(c) Forward selection.(d) Backward elimination.(e)
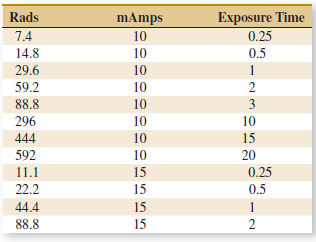
Consider the X-ray inspection data in Exercise 12-15.Use rads as the response. Build regression models for the data using the following techniques:(a) All possible regressions.(b) Stepwise regression.(c) Forward selection.(d) Backward elimination.(e) Comment on the models obtained. Which model
Consider the arsenic concentration data in Exercise 12-16.(a) Discuss how you would model the information about the person€™s sex.(b) Fit a regression model to the arsenic in nails using age, drink use, cook use, and the person€™s sex as the regressors.(c) Is there evidence that
Consider the stack loss data in Exercise 12-20.(a) What proportion of total variability is explained by this model?(b) Construct a normal probability plot of the residuals. What conclusion can you draw from this plot?(c) Plot the residuals versus ˆy and versus each regressor, and comment
Consider the regression model fit to the gray range modulation data in Exercise 12-19. Use the useful range as the response.(a) What proportion of total variability is explained by this model?(b) Construct a normal probability plot of the residuals. What conclusion can you draw from this plot?(c)
Consider the regression model fit to the nisin extraction data in Exercise 12-18.(a) What proportion of total variability is explained by this model?(b) Construct a normal probability plot of the residuals. What conclusion can you draw from this plot?(c) Plot the residuals versus y and versus each
Consider the regression model fit to the coal and limestone mixture data in Exercise 12-17. Use density as the response.(a) What proportion of total variability is explained by this model?(b) Construct a normal probability plot of the residuals. What conclusion can you draw from this plot?(c) Plot
Consider the regression model fit to the arsenic data in Exercise 12-16. Use arsenic in nails as the response and age, drink use, and cook use as the regressors.(a) What proportion of total variability is explained by this model?(b) Construct a normal probability plot of the residuals. What
Showing 100 - 200
of 1157
1
2
3
4
5
6
7
8
9
10
11
12
Step by Step Answers


![0.893758 -0.0175641] 0.0001547 -0.028245 0.0013329 |(X'X)](https://dsd5zvtm8ll6.cloudfront.net/si.question.images/images/question_images/1529/6/6/1/1075b2cc6b38024b1529661123850.jpg)