New Semester
Started
Get
50% OFF
Study Help!
--h --m --s
Claim Now
Question Answers
Textbooks
Find textbooks, questions and answers
Oops, something went wrong!
Change your search query and then try again
S
Books
FREE
Study Help
Expert Questions
Accounting
General Management
Mathematics
Finance
Organizational Behaviour
Law
Physics
Operating System
Management Leadership
Sociology
Programming
Marketing
Database
Computer Network
Economics
Textbooks Solutions
Accounting
Managerial Accounting
Management Leadership
Cost Accounting
Statistics
Business Law
Corporate Finance
Finance
Economics
Auditing
Tutors
Online Tutors
Find a Tutor
Hire a Tutor
Become a Tutor
AI Tutor
AI Study Planner
NEW
Sell Books
Search
Search
Sign In
Register
study help
mathematics
applied statistics and probability
Applied Statistics And Probability For Engineers 6th Edition Douglas C. Montgomery, George C. Runger - Solutions
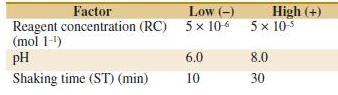
Suppose that in Exercise 14-16 only a ¼ fraction of the 25design could be run. Construct the design and analyze the data that are obtained by selecting only the response for the eight runs in your design.Exercise 14-16The following data represent a single replicate of a 25 design that is used in
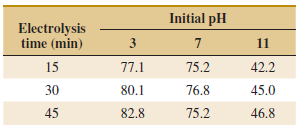
An article in Industrial and Engineering Chemistry [€œMore on Planning Experiments to Increase Research Efficiency€ (1970, pp. 60€“65)] uses a 25€“2 design to investigate the effect on process yield of A = condensation temperature, B = amount of material 1,
An article in Quality Engineering [€œA Comparison of Multi-Response Optimization: Sensitivity to Parameter Selection€ (1999, Vol. 11, pp. 405€“415)] conducted a half replicate of a 25factorial design to optimize the retort process of beef stew MREs, a military ration.
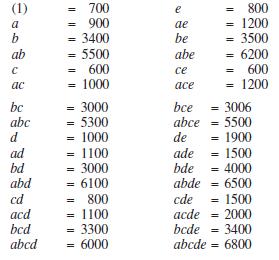
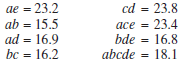
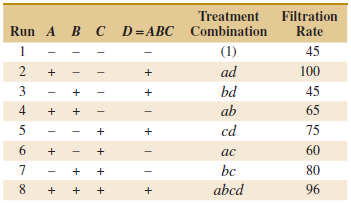
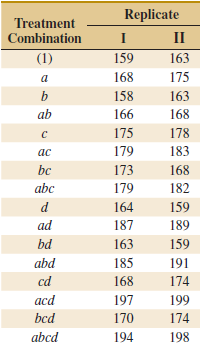
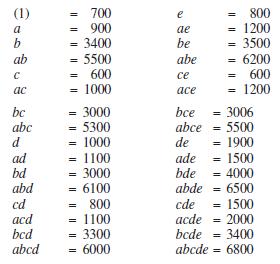
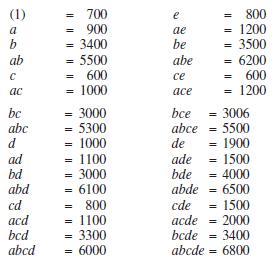
Montgomery (2012) described a 24€“1fractional factorial design used to study four factors in a chemical process. The factors are A = temperature, B = pressure, C = concentration, and D = stirring rate, and the response is filtration rate. The design and the data are as follows:(a) Write
An article by L. B. Hare [€œIn the Soup: A Case Study to Identify Contributors to Filling Variability,€ Journal of Quality Technology 1988 (Vol. 20, pp. 36€“43)] described a factorial experiment used to study filling variability of dry soup mix packages. The factors
Suppose that in Exercise 14-22 it was possible to run only a 12 fraction of the 24design. Construct the design and use only the data from the eight runs you have generated to perform the analysis.Exercise 14-22A 24 factorial design was run in a chemical process. The design factors are A = time, B =
Consider the problem in Exercise 14-19. Suppose that only half of the 32 runs could be made.(a) Choose the half that you think should be run.(b) Write out the alias relationships for your design.(c) Estimate the factor effects.(d) Plot the effect estimates on normal probability paper and interpret
An article in Journal of Hazardous Materials [€œBiosorption of Reactive Dye Using Acid-Treated Rice Husk: Factorial Design Analysis€ (2007, Vol. 142(1), pp. 397€“403)] described an experiment using biosorption to remove red color from water. A 24full factorial design
Consider the earth-moving experiment in Exercise 14-34. The experiment actually used two different operators with the production in columns 1 and 3 from operator 1 and 2, respectively. Analyze the results from only columns 1 and 3 handled as blocks.(a) Assuming that the operator is a nuisance
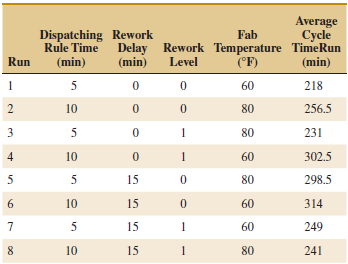
An article in Advanced Semiconductor Manufacturing Conference (ASMC) (May 2004, pp. 325€“29) stated that dispatching rules and rework strategies are two major operational elements that impact productivity in a semiconductor fabrication plant (fab). A four-factor experiment was conducted
Consider the following computer output from a single replicate of a 24experiment in two blocks with ABCD confounded.(a) Comment on the value of blocking in this experiment.(b) What effects were used to generate the residual error in the ANOVA?(c) Calculate the entries marked with
An article in Industrial and Engineering Chemistry [€œFactorial Experiments in Pilot Plant Studies€ (1951, pp. 1300€“1306)] reports on an experiment to investigate the effect of temperature (A), gas throughput (B), and concentration (C) on the strength of product solution in a
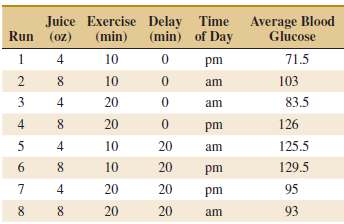
An article in Quality Engineering [€œDesigned Experiment to Stabilize Blood Glucose Levels€ (1999€“2000, Vol. 12, pp. 83€“87)] reported on an experiment to minimize variations in blood glucose levels. The factors were volume of juice intake before exercise
Consider the 26 factorial design. Set up a design to be run in four blocks of 16 runs each. Show that a design that confounds three of the four-factor interactions with blocks is the best possible blocking arrangement.
Construct a 25 design in four blocks. Select the appropriate effects to confound so that the highest possible interactions are confounded with blocks.
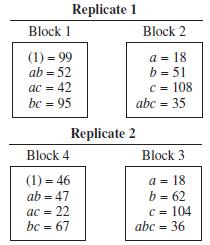
Consider the data from the first replicate of Exercise 14-15, assuming that four blocks are required. Confound ABD and ABC (and consequently CD) with blocks.(a) Construct a design with four blocks of four observations each.(b) Analyze the data.Exercise 14-15Four factors are thought to influence the
Construct a 25 design in two blocks. Select the ABCDE interaction to be confounded with blocks.
Consider the data from Exercise 14-20.(a) Construct the design that would have been used to run this experiment in two blocks of eight runs each.(b) Analyze the data and draw conclusions.Exercise 14-20An experiment described by M. G. Natrella in the National Bureau of Standards€™ Handbook of
Consider the data from the first replicate of Exercise 14-15.(a) Construct a design with two blocks of eight observations each with ABCD confounded.(b) Analyze the data.Exercise 14-15Four factors are thought to influence the taste of a soft-drink beverage: type of sweetener (A), ratio of syrup to
Consider the data from the first replicate of Exercise 14-14.(a) Suppose that these observations could not all be run under the same conditions. Set up a design to run these observations in two blocks of four observations each with ABC confounded.(b) Analyze the data.Exercise 14-14An engineer is
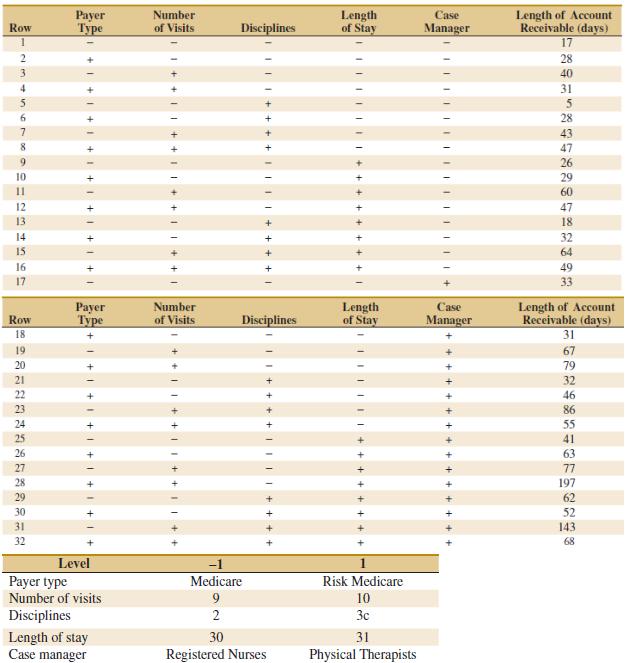
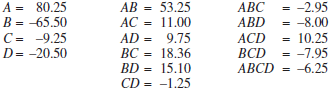
The book Using Designed Experiments to Shrink Health Care Costs [1997, ASQ Quality Press] presented a case study of an unreplicated 25factorial design to investigate the effect of five factors on the length of accounts receivable measured in days. A summary of the investigated factors and the
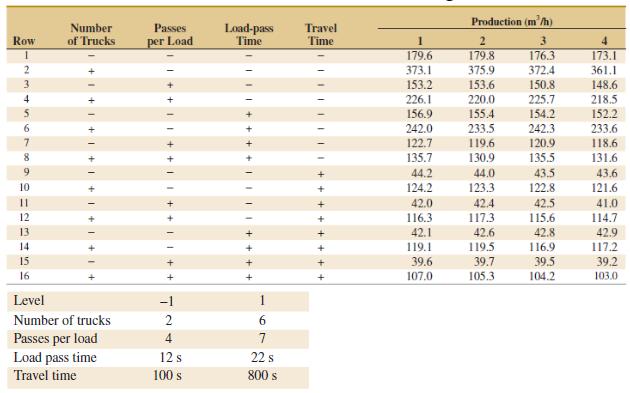
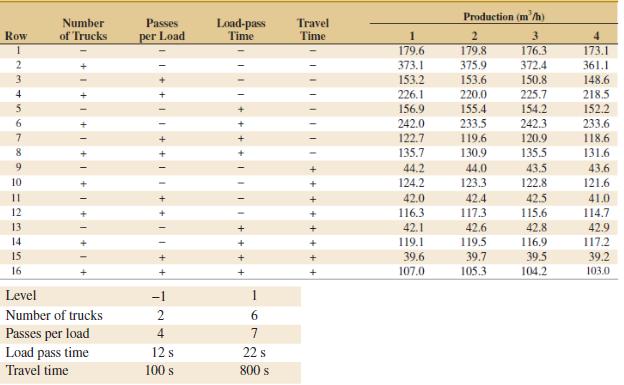
An article in Journal of Construction Engineering and Management (€œAnalysis of Earth-Moving Systems Using Discrete€”Event Simulation,€ 1995, Vol. 121(4), pp. 388€“396) considered a replicated two-level factorial experiment to study the factors most important to output in an
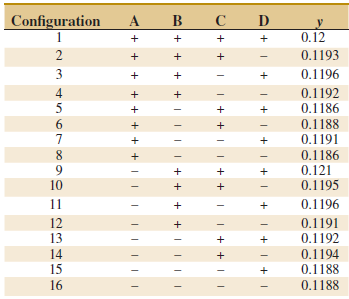
An article in Analytica Chimica Acta [€œDesign-of- Experiment Optimization of Exhaled Breath Condensate Analysis Using a Miniature Differential Mobility Spectrometer (DMS)€ (2008, Vol. 628(2), pp. 155€“161)] examined four parameters that affect the sensitivity and
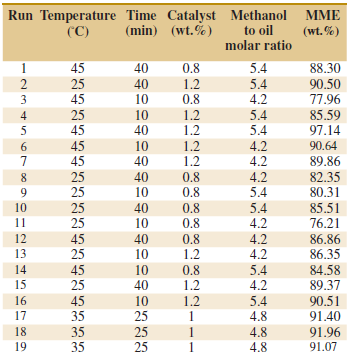
An article in Bioresource Technology (€œInfluence of Vegetable Oils Fatty-Acid Composition on Biodiesel Optimization,€ (2011, Vol. 102(2), pp. 1059€“1065)] described an experiment to analyze the influence of the fatty-acid composition on biodiesel. Factors were the
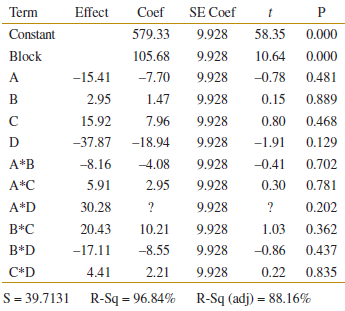
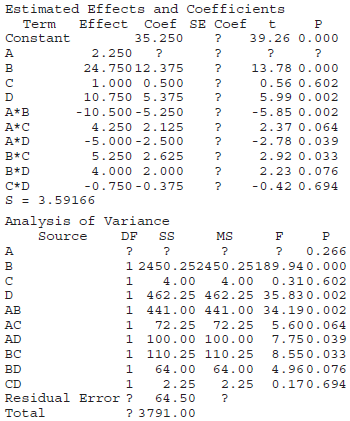
Consider the following computer output for one replicate of a 24factorial experiment.(a) What effects are used to estimate error?(b) Calculate the entries marked with €œ?€ in the output. Estimated Effects and Coefficients Effect Coef SE Coef Term Constant 35.250 39.26 0.000
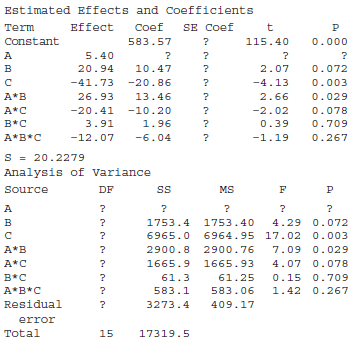
Consider the following computer output for a 23 factorial experiment.(a) How many replicates were used in the experiment?(b) Use the appropriate equation to calculate the standard error of a coefficient.(c) Calculate the entries marked with €œ?€ in the output. Estimated Effects
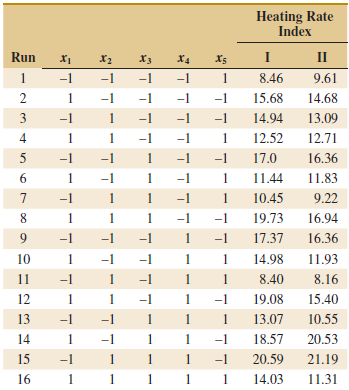
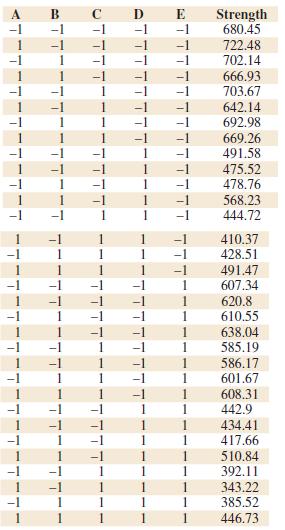
An experiment to study the effect of machining factorson ceramic strength was described atwww.itl.nist.gov/div898/handbook/. Five factors were considered at two levels each: A = Table Speed, B = Down Feed Rate, C = Wheel Grit, D = Direction, E = Batch. The response is the average of the ceramic
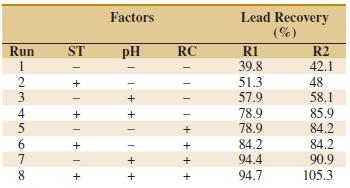
An article in Talanta (2005, Vol. 65, pp. 895€“899) presented a 23factorial design to find lead level by using flame atomic absorption spectrometry (FAAS). The data are in the following table.The factors and levels are in the following table.(a) Construct a normal probability plot of the effect
Consider the experiment in Exercise 14-19. Suppose that a center point with five replicates is added to the factorial runs and the responses are 45, 40, 41, 47, and 43.(a) Estimate the experimental error using the center points. Compare this to the estimate obtained originally in Exercise 14-19 by
Consider the experiment in Exercise 14-16. Suppose that a center point with five replicates is added to the factorial runs and the responses are 2800, 5600, 4500, 5400, 3600. Compute an ANOVA with the sum of squares for curvature and conduct an F-test for curvature. Use α = 0.05.Exercise
Consider a 22 factorial experiment with four center points. The data are (1) = 21, a = 125, b = 154, ab = 352, and the responses at the center point are 92, 130, 98, 152. Compute an ANOVA with the sum of squares for curvature and conduct an F-test for curvature. Use α = 0.05.
A two-level factorial experiment in four factors was conducted by Chrysler and described in the article €œSheet Molded Compound Process Improvement€ by P. I. Hsieh and D. E. Goodwin (Fourth Symposium on Taguchi Methods, American Supplier Institute, Dearborn, MI, 1986, pp.
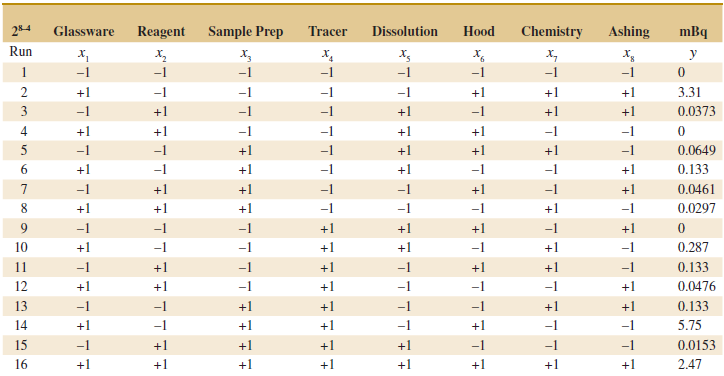
The following data represent a single replicate of a 25 design that is used in an experiment to study the compressive strength of concrete. The factors are mix (A), time (B), laboratory (C), temperature (D), and drying time (E).(a) Estimate the factor effects.(b) Which effects appear important? Use
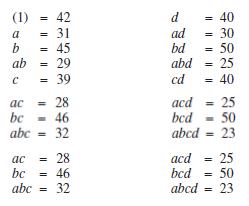
An experiment has run a single replicate of a 24design and calculated the following factor effects:(a) Construct a normal probability plot of the effects.(b) Identify a tentative model, based on the plot of effects in part (a).(c) Estimate the regression coefficients in this model, assuming that
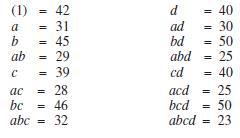
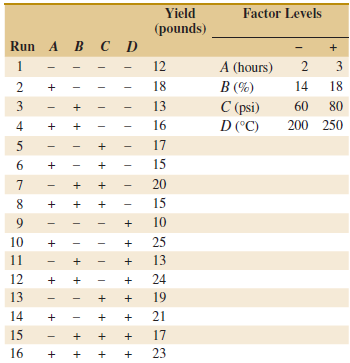
A 24factorial design was run in a chemical process. The design factors are A = time, B = concentration, C = pressure, and D = temperature. The response variable is yield. The data follow:(a) Estimate the factor effects. Based on a normal probability plot of the effect estimates, identify a model
Consider the data from Exercise 14-14. Suppose that the data from the second replicate were not available. Analyze the data from replicate I only and comment on your findings.Exercise 14-14An engineer is interested in the effect of cutting speed (A), metal hardness (B), and cutting angle (C) on the
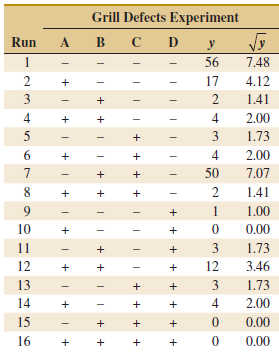
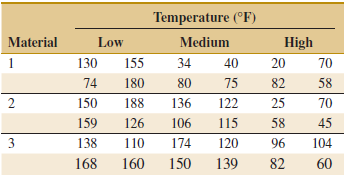
An experiment described by M. G. Natrella in the National Bureau of Standards€™ Handbook of Experimental Statistics (1963, No. 91) involves flame-testing fabrics after applying fire-retardant treatments. The four factors considered are type of fabric (A), type of fire-retardant treatment (B),
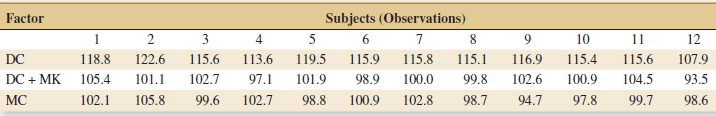
An experiment was run in a semiconductor fabrication plant in an effort to increase yield. Five factors, each at two levels, were studied. The factors (and levels) were A = aperture setting (small, large), B = exposure time (20% below nominal, 20% above nominal), C = development time (30 and 45
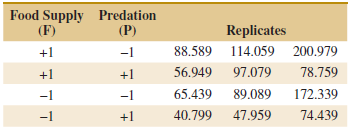
An article in Oikos: A Journal of Ecology [€œRegulation of Root Vole Population Dynamics by Food Supply and Predation: A Two-Factor Experiment€ (2005, Vol. 109, pp. 387€“395)] investigated how food supply interacts with predation in the regulation of root vole
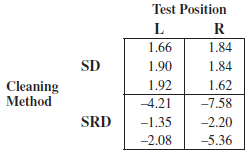
An article in IEEE Transactions on Semiconductor Manufacturing (1992, Vol. 5, pp. 214€“222) described an experiment to investigate the surface charge on a silicon wafer. The factors thought to influence induced surface charge are cleaning method (spin rinse dry or SRD and spin dry or SD)
Four factors are thought to influence the taste of a soft-drink beverage: type of sweetener (A), ratio of syrup to water (B), carbonation level (C), and temperature (D). Each factor can be run at two levels, producing a 24design. At each run in the design, samples of the beverage are given to a
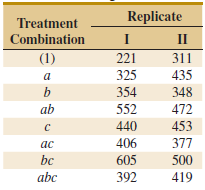
An engineer is interested in the effect of cutting speed (A), metal hardness (B), and cutting angle (C) on the life of a cutting tool. Two levels of each factor are chosen, and two replicates of a 23factorial design are run. The tool life data (in hours) are shown in the following table.(a) Analyze
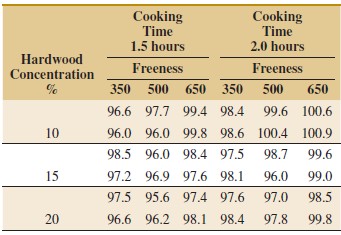
The percentage of hardwood concentration in raw pulp, the freeness, and the cooking time of the pulp are being investigated for their effects on the strength of paper. The data from a three-factor factorial experiment are shown in the following table.(a) Analyze the data using the analysis of
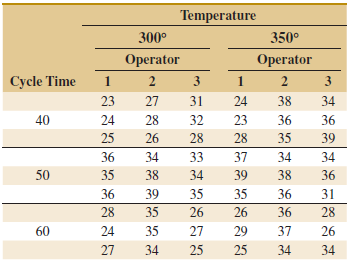
The quality control department of a fabric finishing plant is studying the effects of several factors on dyeing for a blended cotton/synthetic cloth used to manufacture shirts. Three operators, three cycle times, and two temperatures were selected, and three small specimens of cloth were dyed under
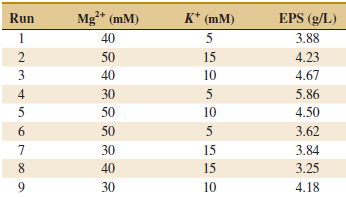
An article in Bioresource Technology [€œQuantitative Response of Cell Growth and Tuber Polysaccharides Biosynthesis by Medicinal Mushroom Chinese Truffle Tuber Sinense to Metal Ion in Culture Medium€ (2008, Vol. 99(16), pp. 7606€“7615)] described an experiment to
An article in Journal of Chemical Technology and Biotechnology [“A Study of Antifungal Antibiotic Production by Thermomonospora sp MTCC 3340 Using Full Factorial Design” (2003, Vol. 78, pp. 605-610)] considered the effects of several factors on antifungal activities. The antifungal yield was
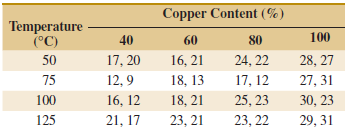
Consider a two-factor factorial experiment. Develop a formula for finding a 100(1 − α)% confidence interval on the difference between any two means for either a row or column factor. Apply this formula to find a 95% CI on the difference in mean warping at the levels of copper content 60 and 80%
An article in the Journal of Testing and Evaluation (1988, Vol. 16, pp. 508€“515) investigated the effects of cyclic loading frequency and environment conditions on fatigue crack growth at a constant 22 MPa stress for a particular material. The data follow. The response variable is
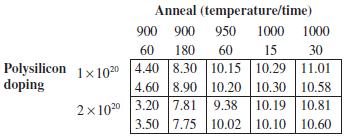
An article in the IEEE Transactions on Electron Devices (November 1986, p. 1754) described a study on the effects of two variables€”polysilicon doping and anneal conditions (time and temperature)€”on the base current of a bipolar transistor. The data from this experiment
Johnson and Leone (Statistics and Experimental Design in Engineering and the Physical Sciences, John Wiley, 1977) described an experiment conducted to investigate warping of copper plates. The two factors studied were temperature and the copper content of the plates. The response variable is the
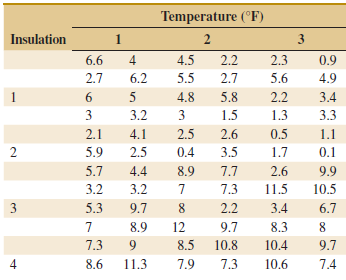
An article in Technometrics [€œExact Analysis of Means with Unequal Variances€ (2002, Vol. 44, pp. 152€“160)] described the technique of the analysis of means (ANOM) and presented the results of an experiment on insulation. Four insulation types were tested at three
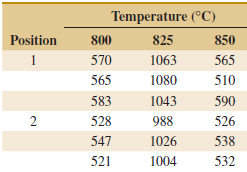
An experiment was conducted to determine whether either firing temperature or furnace position affects the baked density of a carbon anode. The data are as follows:(a) State the hypotheses of interest.(b) Test the hypotheses in part (a) using the analysis of variance with α = 0.05.
In the book Design and Analysis of Experiments, 8th edition (2012, John Wiley & Sons), the results of an experiment involving a storage battery used in the launching mechanism of a shoulder-fired ground-to-air missile were presented. Three material types can be used to make the battery plates.
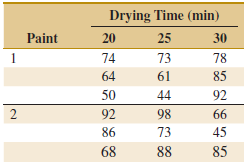
An engineer suspects that the surface finish of metal parts is influenced by the type of paint used and the drying time. He selected three drying times€”20, 25, and 30 minutes€”and used two types of paint. Three parts are tested with each combination of paint type and drying
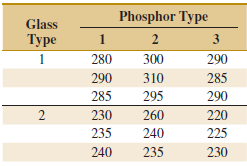
An article in Industrial Quality Control (1956) describes an experiment to investigate the effect of two factors (glass type and phosphor type) on the brightness of a television tube. The response variable measured is the current (in microamps) necessary to obtain a specified brightness level. The
Sample Size Determination. In the single-factor completely randomized design, the accuracy of a100(1 ˆ’ α)% confidence interval on the difference in any two treatment means is ta/2,a(n€“1)ˆš2MSE/ n.(a) Show that if A is the desired accuracy of the
Consider the fixed-effects model of the completely randomized single-factor design. The model parameters are restricted by the constraint Σai=1τi= 0. (Actually, other restrictions could be used, but this one is simple and results in intuitively pleasing estimates for the
Consider a random-effects model for the singlefactor completely randomized design.(a) Show that a 100(1 ˆ’ α)% confidence interval on the ratio σ2Ï„ / σ2 + σ2Ï„) iswhere L and U are as defined in Exercise 13-74.(b) Use the
Consider the random-effects model for the single factor completely randomized design. Show that a 100(1 ˆ’ α)% confidence interval on the ratio of variance components σ2Ï„/σ2is given byWhereAnd L: SU
Consider the single-factor completely randomized design. Show that a 100(1 ˆ’ α) percent confidence interval for σ2iswhere N is the total number of observations in the experimental design. |(N – a)MSg Xá/2,N-a so's N-a)MS Xi-a/2, N-a
Consider the single-factor completely randomized design with a treatments and n replicates. Show that if the difference between any two treatment means is as large as D, the minimum value that the OC curve parameter Φ2can take is nD? Ф? 2ao?
In a fixed-effects model, suppose that there are n observations for each of four treatments. Let Q21 Q22, and Q23 be single-degree-of-freedom sums of squares for orthogonal contrasts. A contrast is a linear combination of the treatment means with coefficients that sum to zero. The coefficient
Show that the variance of the linear combination Σςχ. is σΣn i=1 i=1
Consider the ANOVA with a = 2 treatments. Show that the MSE in this analysis is equal to the pooled variance estimate used in the two-sample t-test.
Consider testing the equality of the means of two normal populations for which the variances are unknown but are assumed to be equal. The appropriate test procedure is the two-sample t-test. Show that the two-sample t-test is equivalent to the single-factor analysis of variance F-test.
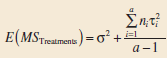
Show that in the fixed-effects model analysis of variance E (MSE ) = σ2. How would your development change if the random-effects model had been specified?
An article in Journal of Hazardous Materials [€œToxicity Assessment from Electro-Coagulation Treated-Textile Dye Waste Waters by Bioassays,€ 2009, Vol. 172(1)] discussed a study of pollutant removal from textile dyeing waste water with an electro-coagulation technique. Chemical
Reconsider Exercise 13-9 in which the effect of different coating types on conductivity was investigated. Suppose that the five coating types were selected at random from a large number of types.(a) How does this change the interpretation of the experiment?(b) What is an appropriate statistical
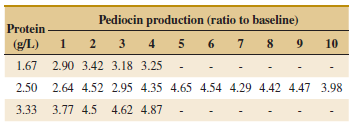
An article in Bioresource Technology [€œPreliminary Tests on Nisin and Pediocin Production Using Waste Protein Sources: Factorial and Kinetic Studies€ (2006, Vol. 97(4))] described an experiment in which pediocin was produced from waste protein. Nisin and pediocin are
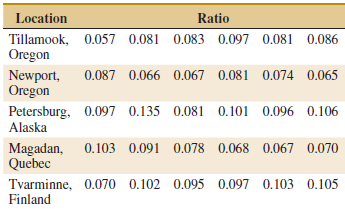
An article in Marine Biology [€œAllozymes an Morphometric Characters of Three Species of Mytilus in the Northern and Southern Hemispheres€ (1991, Vol. 111)] discussed the ratio of the anterior adductor muscle scar length to shell length for shells from five different geographic
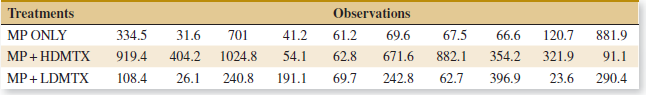
An article in Nature Genetics [(2003, Vol. 34(1)], €œTreatment-Specific Changes in Gene Expression Discriminate in vivo Drug Response in Human Leukemia Cells,€ reported the results of a study of gene expression as a function of different treatments for leukemia. Three treatment
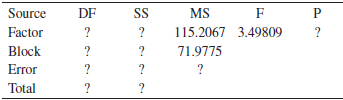
Consider the following computer output.(a) How many levels of the factor were used in this experiment?(b) How many blocks were used?(c) Fill in the missing information. Use bounds for the P-value.(d) What conclusions would you draw if α = 0.05? What if α = 0.01? Source
Consider the following computer output.(a) How many levels of the factor were used in this experiment?(b) How many replicates were used?(c) Fill in the missing information. Use bounds for the P-value.(d) What conclusions would you draw if α = 0.05? What if α = 0.01?
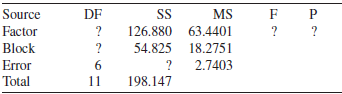
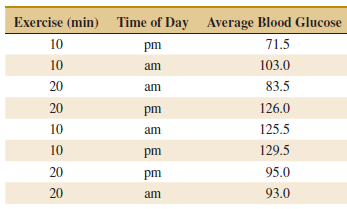
An article in Quality Engineering [€œDesigned Experiment to Stabilize Blood Glucose Levels€ (1999€“2000,)] described an experiment to minimize variations in blood glucose levels. The treatment was the exercise time on a Nordic Track cross-country skier (10 or 20 min).
Reconsider the experiment of Exercise 13-5. Suppose that the experiment was conducted as a RCBD with blocks formed by days (denoted as columns in the data table). In the experiment, the primary interest is still in the effect of cotton percentage and day is considered a nuisance factor.(a) Consider
Exercise 13-4 introduced you to an experiment to investigate the potential effect of consuming chocolate on cardiovascular health. The experiment was conducted as a completely randomized design, and the exercise asked you to use the ANOVA to analyze the data and draw conclusions. Now assume that
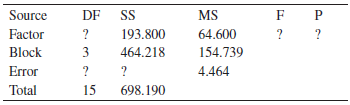
Consider the following computer output from a RCBD. There are four levels of the factor and five blocks.(a) Fill in the missing information. Use bounds for the P-value.(b) What conclusions would you draw if α = 0.05? What would you conclude if α = 0.01? Source DF ? SS MS
Consider the following computer output from a RCBD.(a) How many levels of the factor were used in this experiment?(b) How many blocks were used in this experiment?(c) Fill in the missing information. Use bounds for the P-value.(d) What conclusions would you draw if α = 0.05? What
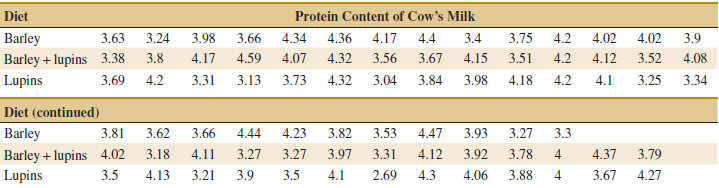
Reconsider Exercise 13-15 in which the effect of different diets on the protein content of cow€™s milk was investigated. Suppose that the three diets reported were selected at random from a large number of diets. To simplify, delete the last two observations in the diets with n = 27 (to
Reconsider Exercise 13-8 in which the effect of different circuits on the response time was investigated. Suppose that the three circuits were selected at random from a large number of circuits.(a) How does this change the interpretation of the experiment?(b) What is an appropriate statistical
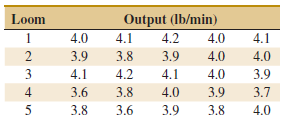
Consider the cloth experiment described in Exercise 13-35.(a) Estimate the total variability in the output response.(b) How much of the total variability in the output response is due to the difference between looms?(c) To what level could the variability in the output response be reduced if the
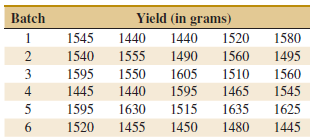
In the book Bayesian Inference in Statistical Analysis (1973, John Wiley and Sons) by Box and Tiao, the total product yield for five samples was determined randomly selected from each of six randomly chosen batches of raw material.(a) Do the different batches of raw material significantly affect
Suppose that five normal populations with common variance σ2 are to be compared with a sample size of seven observations from each. Suppose that τ1 = ⋅ ⋅ ⋅ = τ4 = 0. What is the smallest value for τ25 σ2 that can be detected with power 90% and α = 0.01?
Suppose that four normal populations with common variance σ2 are to be compared with a sample size of eight observations from each population. Determine the smallest value for Σ4i=1 τ2i/ σ2 that can be detected with power 90%. Use α = 0.05.
Diets in Exercise 13-15. Use α = 0.01.(a) Apply Fisher€™s LSD method with α = 0.05 and determine which levels of the factor differ.(b) Use the graphical method to compare means described in this section and compare your conclusions to those from
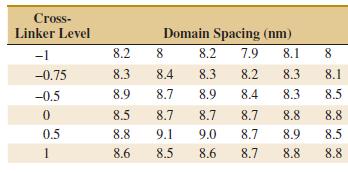
Cross-linker Exercise 13-14. Use α = 0.05.(a) Apply Fisher€™s LSD method with α = 0.05 and determine which levels of the factor differ.(b) Use the graphical method to compare means described in this section and compare your conclusions to those from
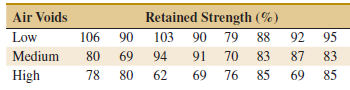
Air voids in Exercise 13-13. Use α = 0.05.(a) Apply Fisher€™s LSD method with α = 0.05 and determine which levels of the factor differ.(b) Use the graphical method to compare means described in this section and compare your conclusions to those from
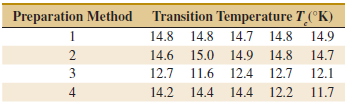
Preparation method in Exercise 13-12. Use α = 0.05.(a) Apply Fisher€™s LSD method with α = 0.05 and determine which levels of the factor differ.(b) Use the graphical method to compare means described in this section and compare your conclusions to those from
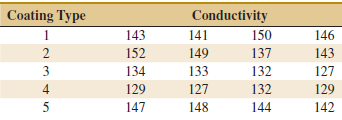
Coating type in Exercise 13-9. Use α = 0.01.(a) Apply Fisher€™s LSD method with α = 0.05 and determine which levels of the factor differ.(b) Use the graphical method to compare means described in this section and compare your conclusions to those from
Circuit type in Exercise 13-8. Use α = 0.01.(a) Apply Fisher€™s LSD method with α = 0.05 and determine which levels of the factor differ.(b) Use the graphical method to compare means described in this section and compare your conclusions to those from
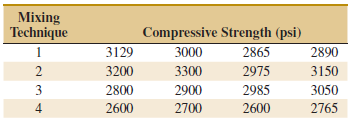
Mixing technique in Exercise 13-7. Use α = 0.05.(a) Apply Fisher€™s LSD method with α = 0.05 and determine which levels of the factor differ.(b) Use the graphical method to compare means described in this section and compare your conclusions to those from
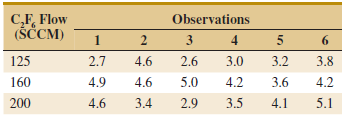
Flow rate in Exercise 13-6. Use α = 0.01.(a) Apply Fisher€™s LSD method with α = 0.05 and determine which levels of the factor differ.(b) Use the graphical method to compare means described in this section and compare your conclusions to those from
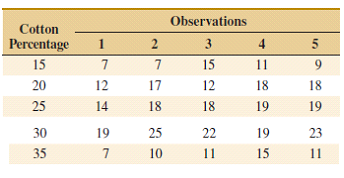
Cotton percentage in Exercise 13-5. Use α = 0.05.(a) Apply Fisher€™s LSD method with α = 0.05 and determine which levels of the factor differ.(b) Use the graphical method to compare means described in this section and compare your conclusions to those from
Chocolate type in Exercise 13-4. Use α = 0.05.(a) Apply Fisher’s LSD method with α = 0.05 and determine which levels of the factor differ.(b) Use the graphical method to compare means described in this section and compare your conclusions to those from Fisher’s LSD method.Exercise 13-4An
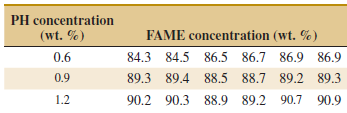
An article in Fuel Processing Technology (€œApplication of the Factorial Design of Experiments to Biodiesel Production from Lard,€ 2009, Vol. 90, pp. 1447€“1451) described an experiment to investigate the effect of potassium hydroxide in synthesis of biodiesel. It is
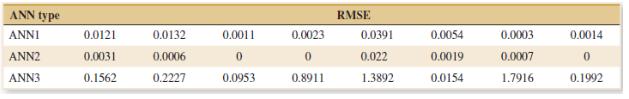
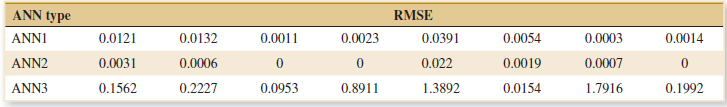
An article in Scientia Iranica [€œTuning the Parameters of an Artificial Neural Network (ANN) Using Central Composite Design and Genetic Algorithm€ (2011, Vol. 18(6))], described a series of experiments to tune parameters in artificial neural networks. One experiment considered the
An article in Scientia Iranica [€œTuning the Parameters of an Artificial Neural Network (ANN) Using Central Composite Design and Genetic Algorithm€ (2011, Vol. 18(6), pp. 1600€“608)], described a series of experiments to tune parameters in artificial neural networks.
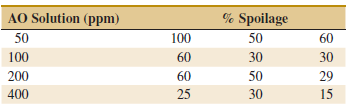
An article in Journal of Food Science [2001, Vol. 66(3), pp. 472€“477] reported on a study of potato spoilage based on different conditions of acidified oxine (AO), which is a mixture of chlorite and chlorine dioxide. The data follow:(a) Do the AO solutions differ in the spoilage
In the book Analysis of Longitudinal Data, 2nd ed. (2002, Oxford University Press), by Diggle, Heagerty, Liang, and Zeger, the authors analyzed the effects of three diets on the protein content of cow€™s milk. The data shown here were collected after one week and include 25 cows on the
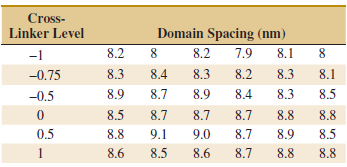
An article in Quality Engineering [€œEstimating Sources of Variation: A Case Study from Polyurethane Product Research€ (1999€“2000, Vol.)] reported a study on the effects of additives on final polymer properties. In this case, polyurethane additives were referred to as cross-linkers. The
Showing 800 - 900
of 1157
1
2
3
4
5
6
7
8
9
10
11
12
Step by Step Answers