New Semester
Started
Get
50% OFF
Study Help!
--h --m --s
Claim Now
Question Answers
Textbooks
Find textbooks, questions and answers
Oops, something went wrong!
Change your search query and then try again
S
Books
FREE
Study Help
Expert Questions
Accounting
General Management
Mathematics
Finance
Organizational Behaviour
Law
Physics
Operating System
Management Leadership
Sociology
Programming
Marketing
Database
Computer Network
Economics
Textbooks Solutions
Accounting
Managerial Accounting
Management Leadership
Cost Accounting
Statistics
Business Law
Corporate Finance
Finance
Economics
Auditing
Tutors
Online Tutors
Find a Tutor
Hire a Tutor
Become a Tutor
AI Tutor
AI Study Planner
NEW
Sell Books
Search
Search
Sign In
Register
study help
mathematics
basic technical mathematics
Basic Technical Mathematics 12th Edition Allyn J. Washington, Richard Evans - Solutions
Display the graphs of the given functions on a graphing calculator. Use appropriate window settings.y = 8 − 2x2
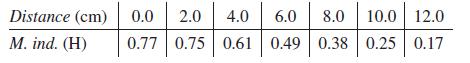
Represent the data graphically.A changing electric current in a coil of wire will induce a voltage in a nearby coil. Important in the design of transformers, the effect is called mutual inductance. For two coils, the mutual inductance (in H) as a function of the distance between them is given in
Graph the given functions.y = −2x
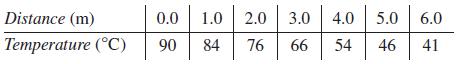
Represent the data graphically.An oil burner propels air that has been heated to 90°C. The temperature then drops as the distance from the burner increases, as shown in the following table: Distance (m) Temperature (°C) 0.0 1.0 2.0 3.0 90 84 76 66 4.0 5.0 6.0 54 46 41
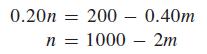
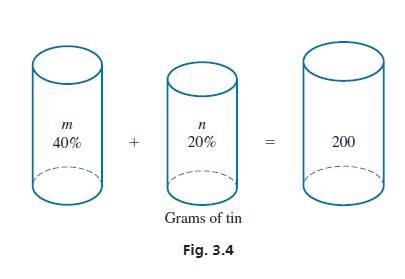
Solve the given problems related to the indicated examples of this sectionIn Example 7, interchange 40% and 20% and then find the function.Data from Example 7A metallurgist melts and mixes m grams (g) of solder that is 40% tin with n grams of another solder that is 20% tin to get a final solder
Find the domain and range of the given functionsf(x) = x + 5
Plot the given pointsA(2, 7), B( 1, 2),C(4, 2), D(0, 4)
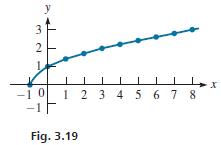
Make the given changes in the indicated examples of this section and then plot the graphs.In Example 5, change the + sign to −.Data from Example 5Graph the functionWhen finding the points for the graph, we may not let x take on any value less than −1, for all such values would lead to imaginary
Determine each of the following as being either true or false. If it is false, explain why.If (2, 0) is an x-intercept of the graph of y = f(x), then (2, 0) is also an intercept of the graph of y = 2 f(x).
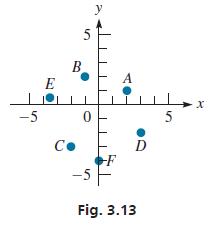
Determine (at least approximately) the coordinates of the points shown in Fig. 3.13.D, E, F -5 E 5 B Co 0 -5 F A D Fig. 3.13 5 ·x
Display the graphs of the given functions on a graphing calculator. Use appropriate window settings.y = x2 − 4x
Graph the given functions.y = 3x
Find the indicated functions.Express the area A of a circle as a function of (a) Its radius r and(b) Its diameter d.
Use a graphing calculator to solve the equation 2x2 − 3 = 3x to the nearest 0.1.
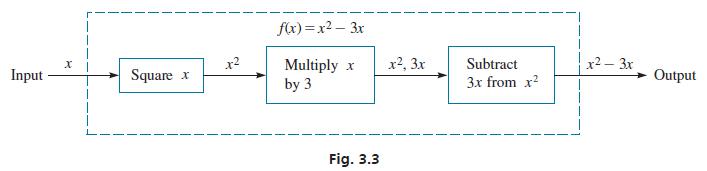
In Example 8, change x2 − 3x to x3 + 4x and then determine the statements that should be placed in the three boxes in Fig. 3.3.Data from Example 8The function f(x) = x2 − 3x tells us to “square the input, multiply the input by 3, and subtract the second result from the first.” An analogy
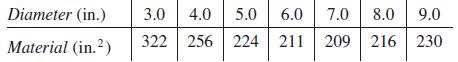
Represent the data graphically.The amount of material necessary to make a cylindrical gallon container depends on the diameter, as shown in this table: Diameter (in.) Material (in.²) 3.0 4.0 5.0 6.0 7.0 8.0 9.0 322 256 224 211 209 216 230
Solve the given problems related to the indicated examples of this section.In Example 5, find f(2) and f(5).Data from Example 5In a certain electric circuit, the current i (in mA) is a function of the time t (in s), which means i = f (t). The function isBecause negative values of t are not usually
Determine each of the following as being either true or false. If it is false, explain why.If y2 = x, then y is a function of x.
Display the graphs of the given functions on a graphing calculator. Use appropriate window settings.y = 4 − 0.5x
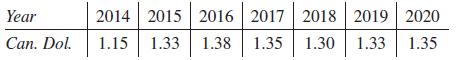
Represent the data graphicallyThe average exchange rate for the number of Canadian dollars equal to one U.S. dollar for 2014–2020 is as follows: Year Can. Dol. 2014 2015 2016 2017 2018 2019 2020 1.15 1.33 1.38 1.35 1.30 1.33 1.35
Plot the graph of the function f(x) = 4 − 2x.
Solve the given problems related to the indicated examples of this section.In Example 6, change “increased” to “decreased” in the second and third lines and then evaluate the function to find the proper expressionData from Example 6The electric resistance R of a certain resistor as a
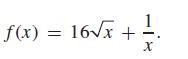
Solve the given problems related to the indicated examples of this section.In Example 3, in the first line, changeWhat other changes must be made in the first paragraph?Data from Example 3Find the domain of the functionFrom the term 16√x, we see that x must be greater than or equal to zero in
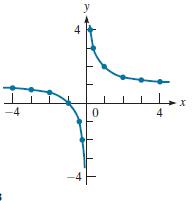
Make the given changes in the indicated examples of this section and then plot the graphs.In Example 4, change the x in the denominator to x − 1.Data from Example 4Graph the functionIn finding the points on this graph, as shown in Fig. 3.18, note that y is not defined for x = 0, due to division
Determine each of the following as being either true or false. If it is false, explain why.All points for which y > 1 are in quadrants I and IV.
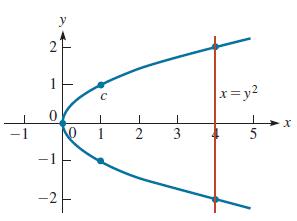
In Example 8, in the second line, change “to the right 3 units and down 2 units” to “to the left 2 units and down 3 units.”Data from Example 8Use the vertical line test to determine whether the relation y2 = x represents a function. By letting x = 0, 1, and 4, we get the table and graph
Display the graphs of the given functions on a graphing calculator. Use appropriate window settings.y = 3x − 1
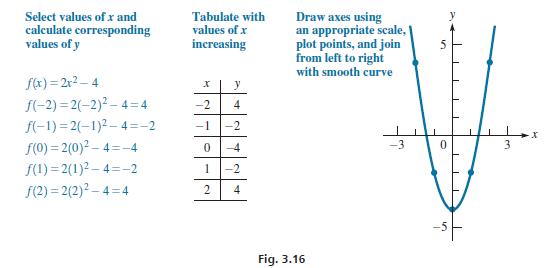
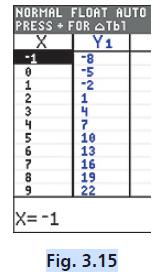
Make the given changes in the indicated examples of this section and then plot the graphs.In Example 2, change 2x2 − 4 to 4 − 2x2.Data from Example 2Graph the function f (x) = 2x2 − 4.First, let y = 2x2 − 4 and tabulate the values as shown in Fig. 3.16. In determining the values in the
A rocket has a mass of 2000 Mg at liftoff. If the first-stage engines burn fuel at the rate of 10 Mg/s, find the mass m of the rocket as a function of the time t(in s) while the first-stage engines operate. Sketch the graph for t = 0 s to t = 60s.
Givenfind (a) f (−4) and (b) f (x − 4). 8 f(x) = - 2x²,
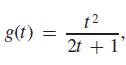
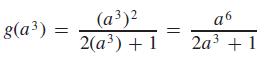
Solve the given problems related to the indicated examples of this section.In Example 5, evaluate g(−a2).Data from Example 5If thenIf F(y) = 5 - 4y2, then F(a + 1) = 5 - 4(a + 1)2 = 5 - 4(a2 + 2a + 1) = -4a2 - 8a +1but F(a) + 1 = (5 - 4a2) + 1 = 6
Solve the given problems related to the indicated examples of this section.In Example 1, in the first line, change x2 to −x2. What other changes must be made in the rest of the paragraph?Data from Example 1The function f(x) = x2 + 2 is defined for all real values of x. This means its domain is
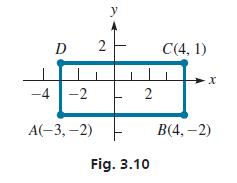
Make the given changes in the indicated examples of this section, and then solve the resulting problems.In Example 2, change A(−3,−2) to A(0,−2) and then find the fourth vertex.Data from Example 2Three vertices of the rectangle in Fig. 3.10 are A(−3,−2), B(4,−2), and C(4, 1). What is
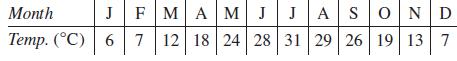
The average monthly temperatures (in °C) for Washington, D.C., are as follows: Month Temp. (°C) J F M A M J JASON D 6 6 7 12 18 24 28 31 29 26 19 13 7
Determine each of the following as being either true or false. If it is false, explain why.The domain of f(x) = √x − 1 is all real numbers x > 1.
Determine each of the following as being either true or false. If it is false, explain why.f (−x) = −f(x) for any function f(x).
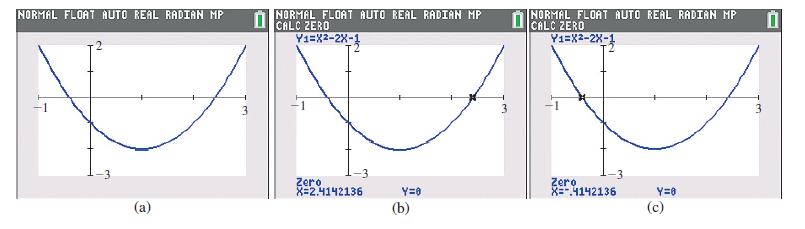
In Example 3, change the sign on the left side of the equation from − to +.Data from Example 3Using a calculator, graphically solve the equation x2 − 2x = 1.Following the above procedure, we first rewrite the equation as x2 − 2x − 1 = 0 and then set y = x2 − 2x − 1. Next, we graph this
Solve the given problems related to the indicated examples of this section.In Example 4, find the value of f (−2).Data from Example 4For a function f(x), the value of f(x) for x = 2 may be expressed as f(2). Thus, substituting 2 for x in f(x) = 3x − 7, we havef(2) = 3(2) − 7 = −1The value
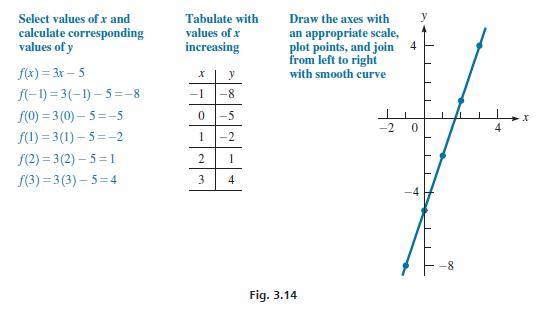
Make the given changes in the indicated examples of this section and then plot the graphs. In Example 1, change the − sign to +. Data from Example 1 Graph the function f (x) = 3x − 5.For purposes of graphing, let y = f (x), or y = 3x − 5. Then, let x take on various values and determine the
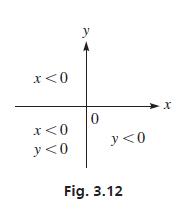
Make the given changes in the indicated examples of this section, and then solve the resulting problems.In Example 3(b), change y < 0 to y > 0 and then find the location of the points (x, y).Data from Example 3(b) Where are all points (x, y) for which x < 0 and y < 0? Noting that x
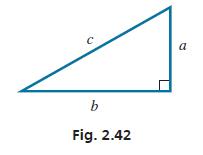
Find the third side of the right triangle shown in Fig. 2.42 for the given values.a = 3 in., b = 4 in. C b Fig. 2.42 a
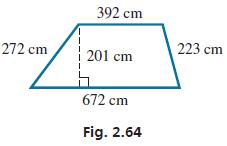
Find the area of each figure.Trapezoid in Fig. 2.64 272 cm 392 cm 201 cm 672 cm Fig. 2.64 223 cm
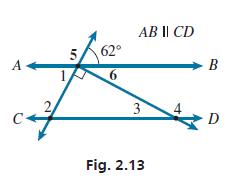
Find the measures of the angles in Fig. 2.13.∠2 A C- 1 5 62° 6 AB || CD 3 Fig. 2.13 B D
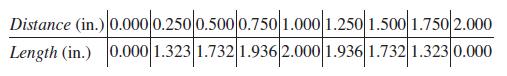
Calculate the area of the circle by the indicated method.The lengths of parallel chords of a circle that are 0.250 in. apart are given in the following table. The diameter of the circle is 2.000 in. The distance shown is the distance from one end of a diameter.Using the formula A = πr2 , the area
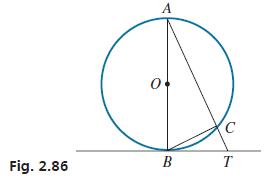
Refer to Fig. 2.86, where AB is a diameter, TB is a tangent line at B, and ∠ABC = 65°. Determine the indicated angles.∠BCT Fig. 2.86 A 0 B с T
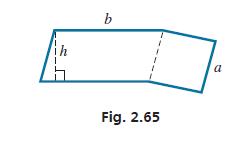
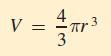
Set up a formula for the indicated perimeter or area.The perimeter of the figure in Fig. 2.65 (a parallelogram and a square attached) b Fig. 2.65 a
Find the measures of the angles in Fig. 2.13.∠3 A C- 1 5 62° 6 AB || CD 3 Fig. 2.13 B D
Calculate the area of the circle by the indicated method.The lengths of parallel chords of a circle that are 0.250 in. apart are given in the following table. The diameter of the circle is 2.000 in. The distance shown is the distance from one end of a diameter.Using the formula A = πr2 , the area
Find the perimeter of each triangle.Isosceles triangle, equal sides of 2.45 in., third side of 3.22 in.
Refer to Fig. 2.86, where AB is a diameter, TB is a tangent line at B, and ∠ABC = 65°. Determine the indicated angles.∠CAB Fig. 2.86 A 0 B с T
Find the third side of the right triangle shown in Fig. 2.42 for the given values.a = 5 yd, c = 13 yd C b Fig. 2.42 a
Find the perimeter or area of the indicated figure.Area: triangle: b = 0.125 ft, h = 0.188 ft
Refer to Fig. 2.86, where AB is a diameter, TB is a tangent line at B, and ∠ABC = 65°. Determine the indicated angles.∠BTC Fig. 2.86 A 0 B с T
Find the volume or area of each solid figure for the given values.Total surface area of right circular cone: r = 3.39 cm, h = 0.274 cm r = 3.39 cm, h = 0.274 cm
Find the measures of the angles in Fig. 2.13.∠4 A C- 1 5 62° 6 AB || CD 3 Fig. 2.13 B D
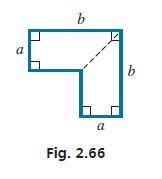
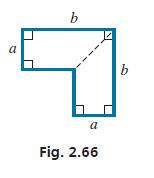
Set up a formula for the indicated perimeter or areaThe perimeter of the figure in Fig. 2.66 (two trapezoids attached) a b a Fig. 2.66 b
Calculate the area of the circle by the indicated method.The lengths of parallel chords of a circle that are 0.250 in. apart are given in the following table. The diameter of the circle is 2.000 in. The distance shown is the distance from one end of a diameter.Using the formula A = πr2 , the area
Find the perimeter or area of the indicated figure.Area: triangle of sides 175 cm, 138 cm, 119 cm
Find the volume or area of each solid figure for the given values.Total surface area of regular pyramid: All faces and base are equilateral triangles of side 3.67 in.
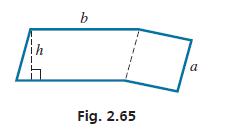
Solve the given problems.Equation (2.28) expresses the volume V of a sphere in terms of the radius r. Express V in terms of the diameter d.Equation(2.28) V = 4 3 πr 3
Find the measures of the angles in Fig. 2.13.∠5 A C- 1 5 62° 6 AB || CD 3 Fig. 2.13 B D
Set up a formula for the indicated perimeter or areaArea of figure in Fig. 2.65 h b Fig. 2.65 a
Find the third side of the right triangle shown in Fig. 2.42 for the given values.a = 13.8ft, b = 22.7ft C b Fig. 2.42 a
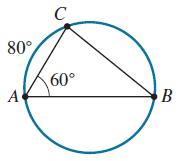
Refer to Fig. 2.87. Determine the indicated arcs and angles.Fig.2.87 BC
Set up a formula for the indicated perimeter or areaArea of figure in Fig. 2.66 a b a Fig. 2.66 b
Find the perimeter or area of the indicated figure.Circumference of circle: d = 74.8 mm
Refer to Fig. 2.87. Determine the indicated arcs and angles.Fig.2.87 AB
Find the third side of the right triangle shown in Fig. 2.42 for the given values.a = 2.48m, b = 1.45m C b Fig. 2.42 a
Find the measures of the angles in Fig. 2.13.∠6 A C- 1 5 62° 6 AB || CD 3 Fig. 2.13 B D
Find the perimeter or area of the indicated figure.Perimeter: rectangle, l = 2980 yd, w = 1860 yd
Solve the given problems.Derive a formula for the total surface area A of a hemispherical volume of radius r (curved surface and flat surface).
Find the perimeter or area of the indicated figure.Area: trapezoid, b1 = 67.2 in., b2 =126.7 in., h = 34.2 in.
Solve the given problems.The radius of a cylinder is twice as long as the radius of a cone, and the height of the cylinder is half as long as the height of the cone. What is the ratio of the volume of the cylinder to that of the cone?
Solve the given problems.If the angle between adjacent sides of a parallelogram is 90°, what conclusion can you make about the parallelogram?
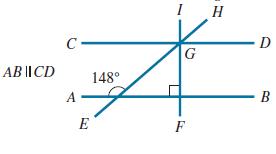
Use Fig. 2.131. Determine the indicated angles.∠DGHFig. 2.131. ABICD C A 148⁰ E I H G F D B
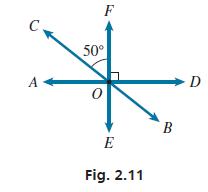
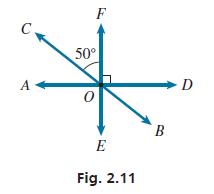
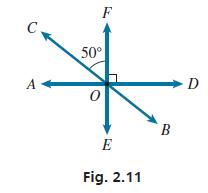
Find the measures of the indicated angles.∠AOB C F 50° 0 E Fig. 2.11 B D
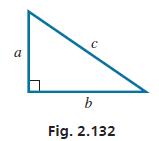
Find the indicated sides of the right triangle shown in Fig. 2.132.b = 5600, c = 6500, a = ? a C b Fig. 2.132
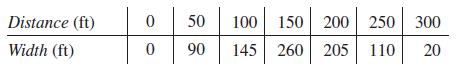
The width of a marshy area is measured at 50-ft intervals, with the results shown in the following table. Using the trapezoidal rule, find the area of the marsh. (All data accurate to two or more significant digits.) Distance (ft) Width (ft) 0 0 50 100 150 90 200 250 300 145 260 205 110 20
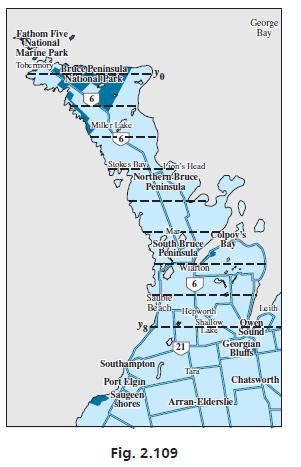
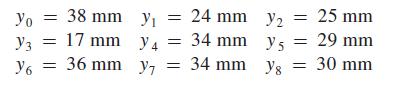
Calculate the indicated areas. All data are accurate to at least two significant digits.A cartographer measured the width of Bruce Peninsula in Ontario at 10-mm intervals on a map (scale 10 mm = 23 km), as shown in Fig. 2.109. The widths are shown in the following list. What is the area of Bruce
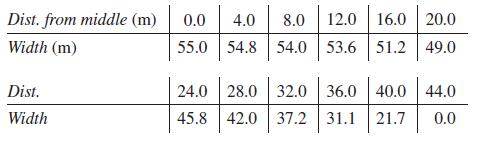
Calculate the indicated areas. All data are accurate to at least two significant digits.The widths (in m) of half the central arena in the Colosseum in Rome are shown in the following table, starting at one end and measuring from the middle to one side at 4.0-m intervals. Find the area of the arena
Find the area of each triangle.Right triangle with legs 3.46 ft and 2.55 ft
Find the indicated sides of the right triangle shown in Fig. 2.132.b = 0.380, c = 0.736, a = ? a C b Fig. 2.132
Find the measures of the indicated angles.∠AOC C. A F 50° 0 E Fig. 2.11 B D
Find the volume or area of each solid figure for the given values.Volume of right prism: square base of side 29.0 cm, h = 11.2 cm
Find the area of each figure.Square: s = 15.6 ft
Find the area of the circle with the given radius or diameter.r = 45.8 cm
Find the area of each triangle.Right triangle with legs 234 mm and 342 mm
Find the indicated sides of the right triangle shown in Fig. 2.132.b = 25.1, c = 128, a = ? a C b Fig. 2.132
Find the measures of the indicated angles.∠BOD C. A F 50° 0 E Fig. 2.11 B D
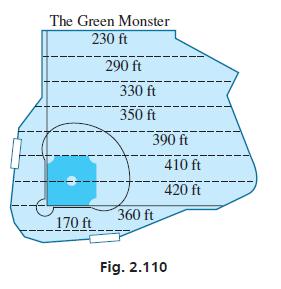
Calculate the indicated areas. All data are accurate to at least two significant digits.The widths of the baseball playing area in Boston’s Fenway Park at 45-ft intervals are shown in Fig. 2.110. Find the playing area using the trapezoidal rule. The Green Monster 230 ft 290 ft 170 ft 330 ft 350
Find the volume or area of each solid figure for the given values.Volume of frustum of right circular cone: R = 37.3 mm, r = 28.2 mm, h = 45.1 mm
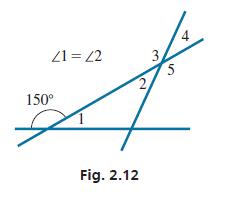
Find the measures of the indicated angles use Fig. 2.12.∠3 21 = 22 150° 3 2, Fig. 2.12 5
Find the area of each figure.Rectangle: l = 8.35 in., w = 2.81 in.
Calculate the indicated areas. All data are accurate to at least two significant digits.Find the playing area of Fenway Park (see Exercise 15) by Simpson’s rule.Data from Exercises 15The widths of the baseball playing area in Boston’s Fenway Park at 45-ft intervals are shown in Fig. 2.110. Find
Find the area of the circle with the given radius or diameter.d = 2.33 m
Find the area of each triangle.Isosceles triangle, equal sides of 0.986 m, third side of 0.884 m
Find the volume or area of each solid figure for the given values.Lateral area of frustum of right circular cone: R = 3.42 m, r = 2.69 m, s = 3.25 m
Find the indicated sides of the right triangle shown in Fig. 2.132.b = 38.3, c = 52.9, a = ? a C b Fig. 2.132
Find the area of each figure.Rectangle: l = 142 cm,w = 126 cm
Find the area of the circle with the given radius or diameter.d = 1256 ft
Showing 7900 - 8000
of 9193
First
73
74
75
76
77
78
79
80
81
82
83
84
85
86
87
Last
Step by Step Answers