New Semester
Started
Get
50% OFF
Study Help!
--h --m --s
Claim Now
Question Answers
Textbooks
Find textbooks, questions and answers
Oops, something went wrong!
Change your search query and then try again
S
Books
FREE
Study Help
Expert Questions
Accounting
General Management
Mathematics
Finance
Organizational Behaviour
Law
Physics
Operating System
Management Leadership
Sociology
Programming
Marketing
Database
Computer Network
Economics
Textbooks Solutions
Accounting
Managerial Accounting
Management Leadership
Cost Accounting
Statistics
Business Law
Corporate Finance
Finance
Economics
Auditing
Tutors
Online Tutors
Find a Tutor
Hire a Tutor
Become a Tutor
AI Tutor
AI Study Planner
NEW
Sell Books
Search
Search
Sign In
Register
study help
mathematics
calculus 4th
Calculus 4th Edition Jon Rogawski, Colin Adams, Robert Franzosa - Solutions
Find a formula for RN and compute the area under the graph as a limit. f(x) = 6x²-4, [2,5]
Find a formula for RN and compute the area under the graph as a limit.ƒ(x) = x2 + 7x, [6, 11]
Find a formula for RN and compute the area under the graph as a limit. f(x) = x³x, [0,2]
Find a formula for RN and compute the area under the graph as a limit. f(x) = 2x³ + x², [-2, 2]
Find a formula for RN and compute the area under the graph as a limit.ƒ(x) = 2x + 1, [a, b] (a, b constants with a < b)
Find a formula for RN and compute the area under the graph as a limit. f(x)=x², [a, b] (a, b constants with a < b)
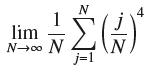
Describe the area represented by the limits. 1 lim N→c N N Σ(;) j=1 4
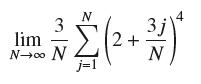
Describe the area represented by the limits. N 3j ² $ ( ² + ²³/) * N j=1 3 lim N-00 N
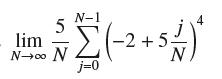
Describe the area represented by the limits. N-1 5 - Σ( - 2 + 5 / / )* Σ(2+5 N j=0 lim N-00 N
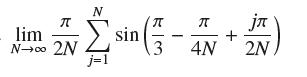
Describe the area represented by the limits. lim N-00 2N (-+) Σsin j=1 4N 2N
Express the area under the graph as a limit using the approximation indicated (in summation notation), but do not evaluate. RN, f(x) = sin x over [0, 1]
Express the area under the graph as a limit using the approximation indicated (in summation notation), but do not evaluate. RN, f(x)= x¹ over [1,7]
Express the area under the graph as a limit using the approximation indicated (in summation notation), but do not evaluate. LN, f(x) = √2x + 1 over [7, 11]
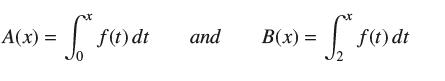
With y = ƒ(x) as in Figure 11, letFind the min and max of A on [0, 6]. A(x) = So f(t) dt and = S₁₁ B(x) = f(t) dt
With y = ƒ(x) as in Figure 11, letFind the min and max of B on [0, 6]. A(x) = So f(t) dt and = S₁₁ B(x) = f(t) dt
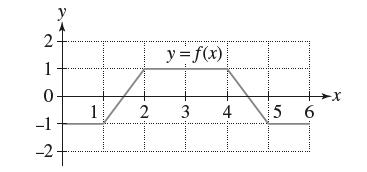
Match functions (a)–(d) with their antiderivatives (i)–(iv). (a) f(x) = sin x (b) f(x) = x sin(x²) (c) f(x)= sin(1 - x) (d) f(x) = x sin.x (i) F(x)= cos(1 - x) (ii) F(x) = cos x (iii) F(x) = cos(x²) (iv) F(x) = sin x - x cos x
Find the general antiderivative of ƒ and check your answer by differentiating.ƒ(x) = sin(4 − 9x)
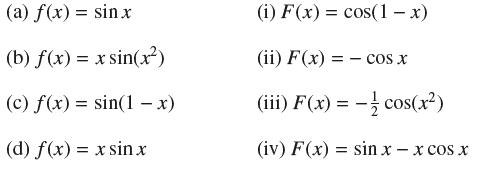
In Figure 2, is graph (A) or graph (B) the graph of an antiderivative of y = ƒ(x)? WN AANV y =f(x) (A) (B) X
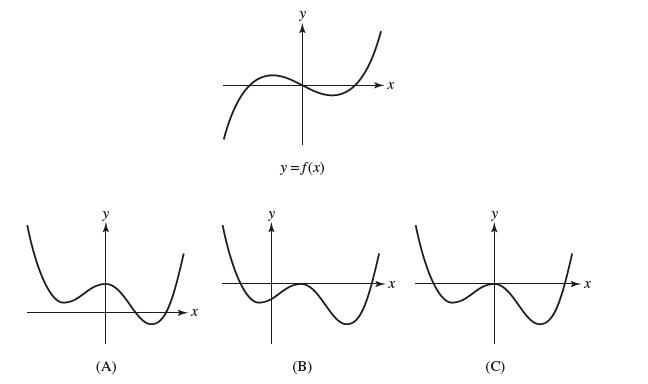
In Figure 3, which of graphs (A), (B), and (C) is not the graph of an antiderivative of y = ƒ(x)? Explain. y = f(x) (A) www X (B) (C)
Show that F(x) = 1/3 (x + 13)3 is an antiderivative of ƒ(x) = (x + 13)2.
We demonstrate that, in general, you cannot obtain an antiderivative of a product of functions by taking a product of antiderivatives of each.Show that G(x) = 4x2(− cos x) is not an antiderivative of ƒ(x) = 8x sin x but H(x) = −8x cos x + 8 sin x is.
First find ƒ and then find ƒ. f"(x)= 12x, f'(0) = 1, f(0) = 2
Show that G(x) = 3x2 sin x is not an antiderivative of ƒ(x) = 6x cos x but H(x) = 6x sin x + 6 cos x is.
First find ƒ and then find ƒ. f"(x) = x³ - 2x, f'(1) = 0, f(1) = 2
First find ƒ and then find ƒ. f" (x) = x³ - 2x +1, f'(0) = 1, f(0) =0
First find ƒ and then find ƒ. f" (x)=x³- 2x +1, f'(1) = 0, f(1)= 4
First find ƒ and then find ƒ. f" (t) = t-3/2, f'(4) = 1, f(4) = 4
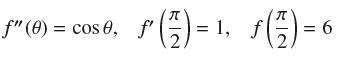
First find ƒ and then find ƒ. S (²)= ¹, S(²) = 6 1, f 7 ƒ" (0) = cos 0, ƒ' (7) = f" f'
First find ƒ and then find ƒ. f" (t) = t - cost, f'(0) = 2, f(0) = -2
Show that F(x) = tan2 x and G(x) = sec2 x have the same derivative. What can you conclude about the relation between F and G? Verify this conclusion directly.
A particle located at the origin at t = 1 second moves along the x-axis with velocity v(t) = (6t2 − t) m/s. State the differential equation with its initial condition satisfied by the position s(t) of the particle, and find s(t).
A particle moves along the x-axis with velocity v(t) = (6t2 − t) m/s. Find the particle’s position s(t), assuming that s(2) = 4 m.
Write the integral in terms of u and du. Then evaluate. f(x+25) (x+25) ² dx, u = x + 25
Calculate du. u = cos(x2)
Write the integral in terms of u and du. Then evaluate. (3t - 4)³ dt, u = 3t-4
Write the integral in terms of u and du. Then evaluate. Sx²√4 VÀ X xV4−xdx, u=4-x
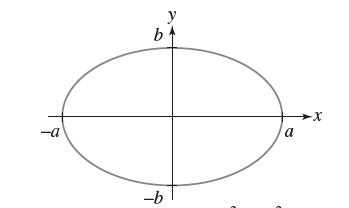
Prove the formula A = πab for the area of the ellipse with equation (Figure 5) -a b -b y a -X
How many iterations of Newton’s Method are required to compute a root if ƒ is a linear function?
What happens in Newton’s Method if your initial guess happens to be a zero of ƒ?
What happens in Newton’s Method if your initial guess happens to be a local min or max of ƒ?
Is the following a reasonable description of Newton’s Method: “A root of the equation of the tangent line to the graph of ƒ is used as an approximation to a root of f itself”? Explain.
Apply Newton’s Method to ƒ and initial guess x0 to calculate x1, x2, x3.ƒ(x) = x2 − 6, x0 = 2
Apply Newton’s Method to ƒ and initial guess x0 to calculate x1, x2, x3.ƒ(x) = x2 − 3x + 1, x0 = 3
Apply Newton’s Method to ƒ and initial guess x0 to calculate x1, x2, x3.ƒ(x) = x3 − 10, x0 = 2
Apply Newton’s Method to ƒ and initial guess x0 to calculate x1, x2, x3.ƒ(x) = x3 + x + 1, x0 = −1
Apply Newton’s Method to ƒ and initial guess x0 to calculate x1, x2, x3.ƒ(x) = cos x − 4x, x0 = 1
Use Figure 6 to choose an initial guess x0 to the unique real root of x3 + 2x + 5 = 0 and compute the first three Newton iterates. -2 -1 1 +X 2
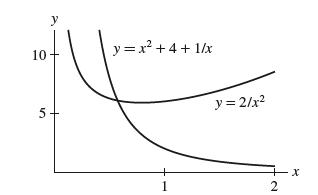
Approximate the point of intersection of the graphs y = x2 + 4 + 1/x and y = 2/x2 to three decimal places (Figure 7). 10 5 y y = x² + 4+1/x 1 y = 2/x² +x 2
Approximate a solution of sin x = cos 2x in the interval [0, π/2] to three decimal places. Then find the exact solution and compare with your approximation.
The first positive solution of sin x = 0 is x = π. Use Newton’s Method to calculate π to four decimal places.
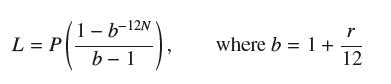
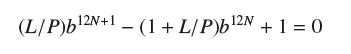
If you borrow L dollars for N years at a yearly interest rate r, your monthly payment of P dollars is calculated using the equation(a) Find P if L = $5000, N = 3, and r = 0.08 (8%).(b) You are offered a loan of L = $5000 to be paid back over 3 years with monthly payments of P = $200. Use Newton’s
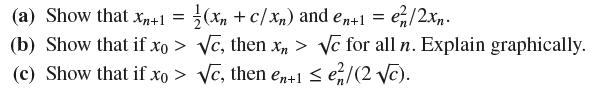
Let ƒ(x) = x2 − c and let en = xn − √c be the error in xn. (xn + c/xn) and en+1 = en/2xn. (a) Show that Xn+1 = (b) Show that if xo> √c, then xn> √e for all n. Explain graphically. (c) Show that if xo> √c, then en+1 ≤ e²/(2√c).
Find a point c satisfying the conclusion of the MVT for the given function and interval.y = √x, [9, 25]
Find a point c satisfying the conclusion of the MVT for the given function and interval. y = X x+2' [1,4]
Find a point c satisfying the conclusion of the MVT for the given function and interval.y = cos x − sin x, [0, 2π]
Find a point c satisfying the conclusion of the MVT for the given function and interval.y = x3, [−4, 5]
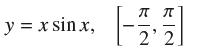
Find a point c satisfying the conclusion of the MVT for the given function and interval. y = x sinx, П П ~/ 22.
Find a point c satisfying the conclusion of the MVT for the given function and interval.y = x − sin(πx), [−1, 1]
Find a point c satisfying the conclusion of the MVT for the given function and interval. Then draw the graph of the function, the secant line between the endpoints of the graph and the tangent line at (c, ƒ (c)), to see that the secant and tangent lines are, in fact, parallel.y = x2, [0, 1]
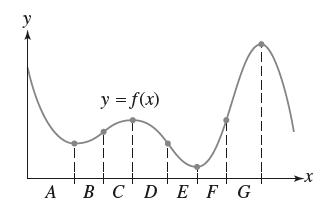
Determine the sign combinations of ƒ' and ƒ" for each interval A–G in Figure 15. A y = f(x) B C D E F G -X
Find a point c satisfying the conclusion of the MVT for the given function and interval. Then draw the graph of the function, the secant line between the endpoints of the graph and the tangent line at (c, ƒ (c)), to see that the secant and tangent lines are, in fact, parallel.y = x2/3, [0, 8]
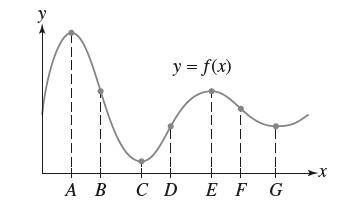
State the sign change at each transition point A–G in Figure 16. Example: ƒ'(x) goes from + to − at A. T 1 1 I A B y = f(x) C D I | I EFG ➤X
Draw the graph of a function for which ƒ' and ƒ" take on the given sign combinations in order.++, +−, −−
Draw the graph of a function for which ƒ' and ƒ" take on the given sign combinations in order.+−, −−, −+
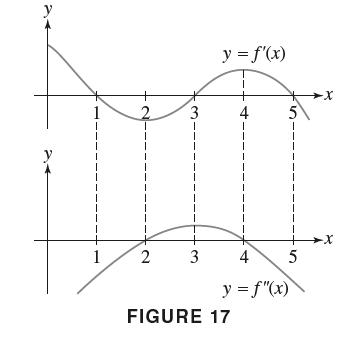
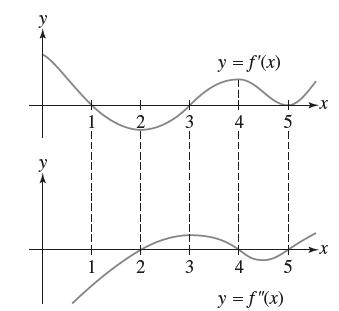
Sketch the graph of a function that could have the graphs of ƒ' and ƒ" appearing in Figure 17. 1 1 2 3 1 2 3 y = f'(x) 4 FIGURE 17 5 4 y=f"(x) 5 →X -X
Sketch the graph of a function that could have the graphs of ƒ' and ƒ" appearing in Figure 18. 1 T 1 1 1 2 2 3 1 3 y = f'(x) 4 4+x 5 I I I I I I I I I 4 y = f'(x) 5 -X
Investigate the behavior and sketch the graph of y = x2 − 5x + 4.
Extend the sketch of the graph of ƒ(x) = cos x + 1/2 x in Example 4 to the interval [0, 5π].Data From Example 4 EXAMPLE 4 Investigate the behavior of f(x)= cos x + cosx + x over [0, 1], and sketch its graph.
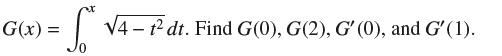
Compute or approximate the corresponding function values and derivative values for the given area function. In some cases, approximations will need to be done via a Riemann sum. G(x) = = So √4-t2 dt. Find G(0), G(2), G' (0), and G' (1).
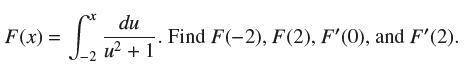
Compute or approximate the corresponding function values and derivative values for the given area function. In some cases, approximations will need to be done via a Riemann sum. F(x) = Si du u² + 1 Find F(-2), F(2), F'(0), and F'(2).
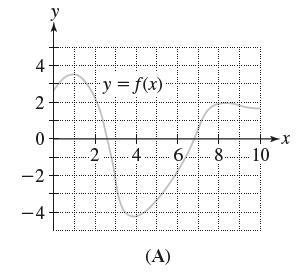
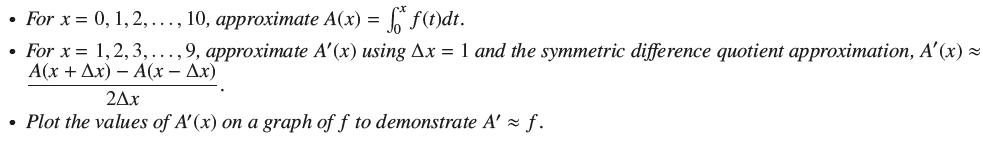
Use ƒ(x) from Figure 10(A). 4 2 0 III -y = f(x) III 2 6 8. 10 -2 II -4- 4 HIIIHIDD (A) B ·X
Let A(x) = ∫xa ƒ(t) dt.Explain why the following statements are true. Assume ƒ is differentiable.(a) If c is an inflection point of A, then ƒ(c) = 0.(b) A is concave up if ƒ is increasing.(c) A is concave down if ƒ is decreasing.
Use ƒ(x) from Figure 10(B). 8 4 0 2 H H H y = f(x). 8. (B) 10 -4 8 B -8 -X
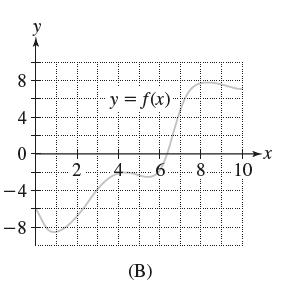
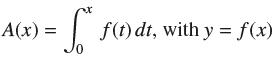
Let as in Figure 12.(a) Does A have a local maximum at P?(b) Where does A have a local minimum?(c) Where does A have a local maximum?(d) True or false? A(x) A(x) = f* f(t) dt, with y = f(x)
Let as in Figure 12.(a) Where does A have its absolute maximum over the interval [P, S ]?(b) Where does A have its absolute minimum over the interval [P, S ]?(c) On what interval is A increasing? A(x) = 0 f(t) dt, with y = f(x)
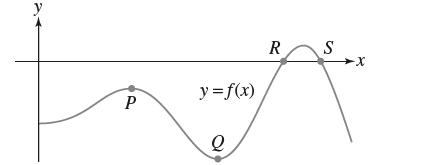
Let as in Figure 13. Determine:(a) The intervals on which A is increasing and decreasing(b) The values x where A has a local min or max(c) The inflection points of A(d) The intervals where A is concave up or concave down A(x) = S* f(t) dt, with y = f(x)
Let A(x) = ∫xa ƒ(t) dt.Match the property of A with the corresponding property of the graph of ƒ. Assume ƒ is differentiable.Area function A(a) A is decreasing.(b) A has a local maximum.(c) A is concave up.(d) A goes from concave up to concave down.Graph of ƒ(i) Lies below the x-axis.(ii)
Let ƒ(x) = x2 − 5x − 6 and (a) Find the critical points of F and determine whether they are local minima or local maxima.(b) Find the points of inflection of F and determine whether the concavity changes from up to down or from down to up.(c) Plot y = ƒ(x) and y = F(x) on the same set of axes
Sketch the graph of an increasing function ƒ such that both ƒ'(x) and A(x) = f(t) dt are decreasing.
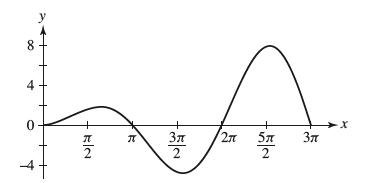
Figure 14 shows the graph of ƒ(x) = x sin x. Let (a) Locate the local max and absolute max of F on [0, 3π].(b) Justify graphically: F has precisely one zero in [π, 2π].(c) How many zeros does F have in [0, 3π]?(d) Find the inflection points of F on [0, 3π]. For each one, state whether the
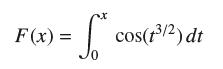
Find the smallest positive critical point ofand determine whether it is a local min or max. Then find the smallest positive inflection point of F(x) and use a graph of y = cos(x3/2) to determine whether the concavity changes from up to down or from down to up. = 5₁² 10 F(x) = (27)
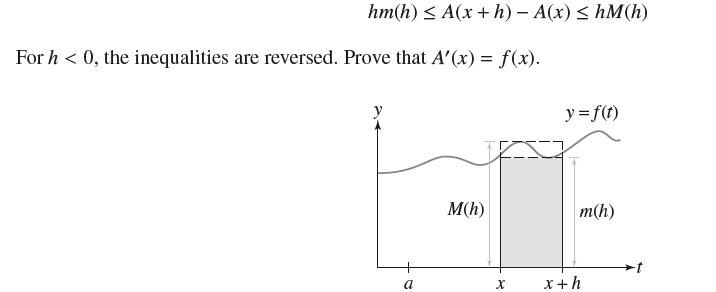
The proof in the text assumes that ƒ is increasing. To prove it for all continuous functions, let m(h) and M(h) denote the minimum and maximum of ƒ on [x, x + h] (Figure 15). The continuity of ƒ implies that M(h) = ƒ(x). Show that for h > 0, lim m(h)= lim M(h) = f(x). h→0 h→0
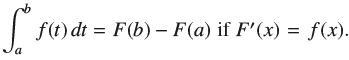
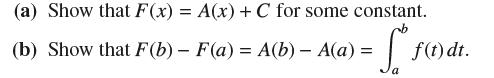
FTC I asserts that Use FTC II to give a new proof of FTC I as follows. So f(t) dt = F(b) - F(a) if F'(x) = f(x). a
Let A(x) =∫x−4 3√4 − t2 dt.(a) For x = −3, −2, . . . , 4, calculate a Riemann sum that approximates the definite integral defining A(x). Plot the points (x, A(x)) for x = −4, −3, −2, . . . , 4 and connect them with a smooth curve to obtain a graph of A.(b) Examine A to determine
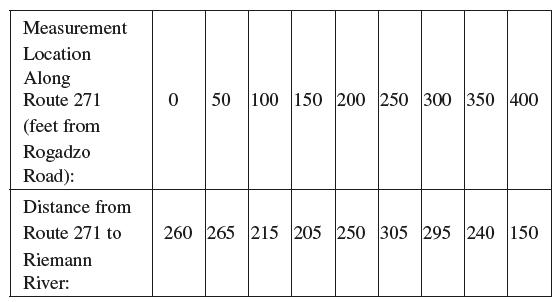
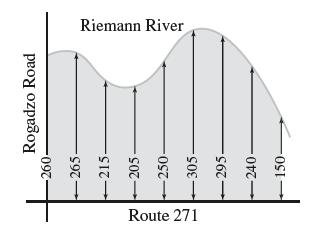
Lauren and Harvey own a field that is bordered by Route 271, Rogadzo Road, and the Riemann River (Figure 25). To estimate the area of the field, at 50-ft intervals along Route 271 they measured the distance from Route 271 to the river, parallel to Rogadzo Road. Their measurements (in feet) are
Use the Shell Method to find the given volume of rotation.The “bead” formed by removing a cylinder of radius r from the center of a sphere of radius R (compare with Exercise 61 in Section 6.3)Data From Exercise 61 in Section 6.3The solid generated by rotating the region inside the ellipse with
A 10-cm copper wire with one end in an ice bath is heated at the other end, so that the temperature at each point x along the wire (in degrees Celsius) is given by T(x) = 50 cos πx/20. Find the average temperature over the wire.
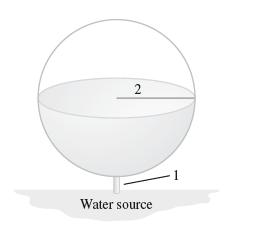
Water is pumped into a spherical tank of radius 2 m from a source located 1 m below a hole at the bottom (Figure 5). The density of water is 1000 kg/m3.Calculate the work F(h) required to fill the tank to level h meters in the sphere. 2 Water source
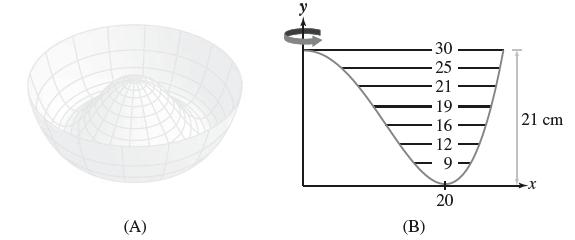
The bowl in Figure 14(A) is 21 cm high, obtained by rotating the curve in Figure 14(B) as indicated. Estimate the volume capacity of the bowl shown by taking the average of right- and left-endpoint approximations to the integral with N = 7. The inner radii (in centimeters) starting from the top are
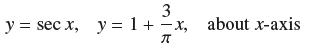
Find the volume of the solid obtained by rotating the region enclosed by the graphs about the given axis. 3 y = sec x, y = 1+x, about x-axis π
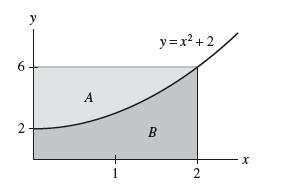
Use the most convenient method (Disk or Shell Method) to find the volume obtained by rotating region B in Figure 12 about the given axis.y-axis 6 2 y A y = x² + 2 B 2 X
Sketch the region enclosed by the curves and compute its area as an integral along the x- or y-axis.y = cos x, y = cos 2x, x = 0, x = 2π/3
Calculate the average over the given interval. f(s) = S², [2,5]
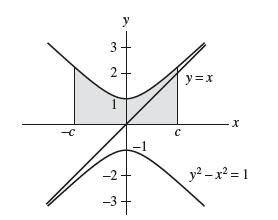
Find the volume obtained by rotating the region about the given axis. The regions refer to the graph of the hyperbola y2 − x2 = 1 in Figure 4.The region between the upper branch of the hyperbola and y = 2, about the y-axis 3 2 y -2 -3+ C y=x X ye – x2 = 1
Find the volume of the solid obtained by rotating the region enclosed by the graphs about the given axis.x = 2, x = 3, y = 16 − x4, y = 0, about y-axis
Use the most convenient method (Disk or Shell Method) to find the volume obtained by rotating region B in Figure 12 about the given axis.x = −3 6 2 y A y=x² +2 B 2 X
Sketch the region enclosed by the curves and compute its area as an integral along the x- or y-axis.y = sin(2x), y = sin(4x), x = 0, x = π/6
Calculate the average over the given interval. f(x) = sin(π/x) x² [1, 2]
Let R be the intersection of the circles of radius 1 centered at (1, 0) and (0, 1). Express as an integral (but do not evaluate): (a) The area of R and (b) The volume of revolution of R about the x-axis.
Find the volume of the solid obtained by rotating the region enclosed by the graphs about the given axis.y = 2 √x, y = x, about x = −2
Showing 5700 - 5800
of 8339
First
51
52
53
54
55
56
57
58
59
60
61
62
63
64
65
Last
Step by Step Answers
![f(x) = 2x + x, [-2, 2]](https://dsd5zvtm8ll6.cloudfront.net/images/question_images/1700/2/9/6/0796558758fe0c0c1700296082665.jpg)
![RN, f(x)= x over [1,7]](https://dsd5zvtm8ll6.cloudfront.net/images/question_images/1700/2/9/7/0666558796a0d1a31700297068951.jpg)
![y = X x+2' [1,4]](https://dsd5zvtm8ll6.cloudfront.net/images/question_images/1699/7/0/4/267654f6dcbd8d571699704267331.jpg)
![EXAMPLE 4 Investigate the behavior of f(x) = cos x + cos x + x over [0, 7], and sketch its graph.](https://dsd5zvtm8ll6.cloudfront.net/images/question_images/1699/8/7/3/865655204492dd0b1699873865480.jpg)

![f(x) = sin(/x) x [1, 2]](https://dsd5zvtm8ll6.cloudfront.net/images/question_images/1700/7/2/9/359655f120fe75d11700729360399.jpg)

