New Semester
Started
Get
50% OFF
Study Help!
--h --m --s
Claim Now
Question Answers
Textbooks
Find textbooks, questions and answers
Oops, something went wrong!
Change your search query and then try again
S
Books
FREE
Study Help
Expert Questions
Accounting
General Management
Mathematics
Finance
Organizational Behaviour
Law
Physics
Operating System
Management Leadership
Sociology
Programming
Marketing
Database
Computer Network
Economics
Textbooks Solutions
Accounting
Managerial Accounting
Management Leadership
Cost Accounting
Statistics
Business Law
Corporate Finance
Finance
Economics
Auditing
Tutors
Online Tutors
Find a Tutor
Hire a Tutor
Become a Tutor
AI Tutor
AI Study Planner
NEW
Sell Books
Search
Search
Sign In
Register
study help
mathematics
calculus 4th
Calculus 4th Edition Jon Rogawski, Colin Adams, Robert Franzosa - Solutions
Find the transition points, intervals of increase/decrease, concavity, and asymptotic behavior. Then sketch the graph, with this information indicated.y = (x3 − 3x)1/3
Find the critical points and the intervals on which the function is increasing or decreasing. Use the First Derivative Test to determine whether the critical point yields a local min or max (or neither).y = x2 + (10 − x)2
Find the critical points and apply the Second Derivative Test (or state that it fails).y = 6x3/2 − 4x1/2
Find the critical points and the intervals on which the function is increasing or decreasing. Use the First Derivative Test to determine whether the critical point yields a local min or max (or neither). y = x³ + x² + 2x + 4
Find the transition points, intervals of increase/decrease, concavity, and asymptotic behavior. Then sketch the graph, with this information indicated.y = x − x−1
Find the critical points and apply the Second Derivative Test (or state that it fails).y = 9x7/3 − 21x1/2
Find the transition points, intervals of increase/decrease, concavity, and asymptotic behavior. Then sketch the graph, with this information indicated.y = x2 − x−2
Find the critical points and the intervals on which the function is increasing or decreasing. Use the First Derivative Test to determine whether the critical point yields a local min or max (or neither).y = x4 + x3
Find the critical points and apply the Second Derivative Test (or state that it fails).ƒ(x) = sin2 x + cos x, [0, π]
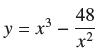
Find the transition points, intervals of increase/decrease, concavity, and asymptotic behavior. Then sketch the graph, with this information indicated. y = x3 48 2
Find the critical points and the intervals on which the function is increasing or decreasing. Use the First Derivative Test to determine whether the critical point yields a local min or max (or neither).y = x5 + x3 + 1
Find the critical points and apply the Second Derivative Test (or state that it fails). y = 1 sin x + 4 [0, 2π]
Find the critical points and the intervals on which the function is increasing or decreasing. Use the First Derivative Test to determine whether the critical point yields a local min or max (or neither).y = x5 + x3 + x
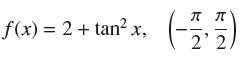
Find the critical points and apply the Second Derivative Test (or state that it fails). f(x) = 2 + tan2x, (2 , n n KIN 2' 2.
Find the transition points, intervals of increase/decrease, concavity, and asymptotic behavior. Then sketch the graph, with this information indicated.y = x2 − x + x−1
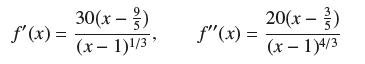
Investigate the behavior and sketch the graph of ƒ(x) = 18(x − 3)(x − 1)2/3 using the formulas f'(x) = 30(x - ²) (x - 1)1/3" f"(x) = 20(x-3) (x - 1)4/3
Find the critical points and the intervals on which the function is increasing or decreasing. Use the First Derivative Test to determine whether the critical point yields a local min or max (or neither).y = x4 − 4x3/2 (x > 0)
Find the critical points and apply the Second Derivative Test (or state that it fails).ƒ(x) = sin x cos3 x, [0, π]
Find the critical points and the intervals on which the function is increasing or decreasing. Use the First Derivative Test to determine whether the critical point yields a local min or max (or neither).y = x5/2 − x2 (x > 0)
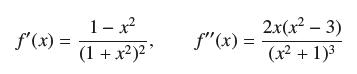
Investigate the behavior and sketch the graph of ƒ(x) = x/x2 + 1 using the formulas f'(x) = 1-x² (1 + x²)2² f"(x) = 2x(x² - 3) (x² + 1)³
Find the intervals on which ƒ is concave up or down, the points of inflection, the critical points, and the local minima and maxima.ƒ(x) = x3 − 2x2 + x
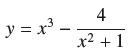
Sketch the graph of the function, indicating all transition points. If necessary, use a graphing utility or computer algebra system to locate the transition points numerically. y = x³ = 4 x² + 1
Find the critical points and the intervals on which the function is increasing or decreasing. Use the First Derivative Test to determine whether the critical point yields a local min or max (or neither).y = x + x−1
Find the intervals on which ƒ is concave up or down, the points of inflection, the critical points, and the local minima and maxima.ƒ(x) = x2(x − 4)
Find the critical points and the intervals on which the function is increasing or decreasing. Use the First Derivative Test to determine whether the critical point yields a local min or max (or neither).y = x−2 − 4x−1
Sketch the graph of the function, indicating all transition points. If necessary, use a graphing utility or computer algebra system to locate the transition points numerically.y = 12√x2 + 2x + 4 − x2
Find the intervals on which ƒ is concave up or down, the points of inflection, the critical points, and the local minima and maxima.ƒ(t) = t2 − t3
Find the critical points and the intervals on which the function is increasing or decreasing. Use the First Derivative Test to determine whether the critical point yields a local min or max (or neither). y = 1 x² +1
Sketch the graph of the function, indicating all transition points. If necessary, use a graphing utility or computer algebra system to locate the transition points numerically.y = x4 − 4x2 + x + 1
Find the intervals on which ƒ is concave up or down, the points of inflection, the critical points, and the local minima and maxima.ƒ(x) = 2x4 − 3x2 + 2
Find the critical points and the intervals on which the function is increasing or decreasing. Use the First Derivative Test to determine whether the critical point yields a local min or max (or neither). y = 2x + 1 x² + 1
Sketch the graph of the function, indicating all transition points. If necessary, use a graphing utility or computer algebra system to locate the transition points numerically.y = 2√x − sin x, 0≤ x ≤ 2π
Find the intervals on which ƒ is concave up or down, the points of inflection, the critical points, and the local minima and maxima.ƒ(x) = x2 − 8x1/2 (x ≥ 0)
Find the critical points and the intervals on which the function is increasing or decreasing. Use the First Derivative Test to determine whether the critical point yields a local min or max (or neither). y = x³ I + zx
Sketch the graph over the given interval, with all transition points indicated.y = x + sin x, [0, 2π]
Find the intervals on which ƒ is concave up or down, the points of inflection, the critical points, and the local minima and maxima.ƒ(x) = x3/2 − 4x−1/2 (x > 0)
Find the critical points and the intervals on which the function is increasing or decreasing. Use the First Derivative Test to determine whether the critical point yields a local min or max (or neither). y = 好 2-3 2
Sketch the graph over the given interval, with all transition points indicated.y = sin x + cos x, [0, 2π]
Find the intervals on which ƒ is concave up or down, the points of inflection, the critical points, and the local minima and maxima. X f(x) = x² + 27
Sketch the graph over the given interval, with all transition points indicated.y = 2 sin x − cos2 x, [0, 2π]
Find the critical points and the intervals on which the function is increasing or decreasing. Use the First Derivative Test to determine whether the critical point yields a local min or max (or neither).y = θ + sin θ + cos θ, [0, 2π]
Find the intervals on which ƒ is concave up or down, the points of inflection, the critical points, and the local minima and maxima. f(x) = 1 x + 1
Sketch the graph over the given interval, with all transition points indicated.y = sin x + 1/2x, [0, 2π]
Find the critical points and the intervals on which the function is increasing or decreasing. Use the First Derivative Test to determine whether the critical point yields a local min or max (or neither).y = sin θ + √3 cos θ, [0, 2π]
Find the intervals on which ƒ is concave up or down, the points of inflection, the critical points, and the local minima and maxima.ƒ(x) = x5/3 − x
Find the critical points and the intervals on which the function is increasing or decreasing. Use the First Derivative Test to determine whether the critical point yields a local min or max (or neither).y = sin2 θ + sin θ, [0, 2π]
Sketch the graph over the given interval, with all transition points indicated.y = sin x +√3 cos x, [0, π]
Find the intervals on which ƒ is concave up or down, the points of inflection, the critical points, and the local minima and maxima.ƒ(x) = (x − 1)3/5
Sketch the graph over the given interval, with all transition points indicated.y = sin x − 1/2 sin 2x, [0, π]
Find the critical points and the intervals on which the function is increasing or decreasing. Use the First Derivative Test to determine whether the critical point yields a local min or max (or neither).y = θ − 2 cos θ, [0, 2π]
Are all sign transitions possible? Explain with a sketch why the transitions ++ → −+ and −− → +− do not occur if the function is differentiable.
Find the intervals on which ƒ is concave up or down, the points of inflection, the critical points, and the local minima and maxima.ƒ(θ) = θ + sin θ, [0, 2π]
Find the critical points and the intervals on which the function is increasing or decreasing. Use the First Derivative Test to determine whether the critical point yields a local min or max (or neither).y = x1/3
Find the intervals on which ƒ is concave up or down, the points of inflection, the critical points, and the local minima and maxima.ƒ(x) = cos2 x, [0, π]
Suppose that ƒ is twice differentiable satisfying (i) ƒ(0) = 1, (ii) ƒ'(x) > 0 for all x ≠ 0, and (iii) ƒ"(x) < 0 for x < 0 and ƒ"(x) > 0 for x > 0. Let g(x) = ƒ(x2).(a) Sketch a possible graph of ƒ.(b) Prove that g has no points of inflection and a unique local extreme value at x = 0.
Find the critical points and the intervals on which the function is increasing or decreasing. Use the First Derivative Test to determine whether the critical point yields a local min or max (or neither).y = x2/3 − x2
Find the intervals on which ƒ is concave up or down, the points of inflection, the critical points, and the local minima and maxima.ƒ(x) = tan x, (−π/2, π/2)
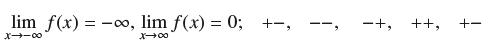
Draw the graph of a function ƒ having the given limits at ±∞ and for which ƒ' and ƒ" take on the given sign combinations in order. lim f(x) = -00, lim f(x) = 0; +-, X118 X-00 -+, ++, +-
Show that ƒ(x) = x2 + bx + c is decreasing on (-∞, -2) and increasing on (-2, 0).
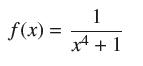
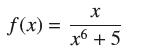
Find the intervals on which ƒ is concave up or down, the points of inflection, the critical points, and the local minima and maxima. f(x) = X x6 +5
Draw the graph of a function ƒ having the given limits at ±∞ and for which ƒ' and ƒ" take on the given sign combinations in order lim f(x) = -1, lim f(x) = 1; ++, x→→∞0 x-00 +-, -+
Show that ƒ(x) = x3 − 2x2 + 2x is an increasing function. Find the minimum value of ƒ.
Find conditions on a and b that ensure ƒ(x) = x3 + ax + b is increasing on (−∞,∞).
Sketch the graph of an increasing function such that ƒ"(x) changes from + to − at x = 2 and from − to + at x = 4. Do the same for a decreasing function.
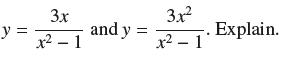
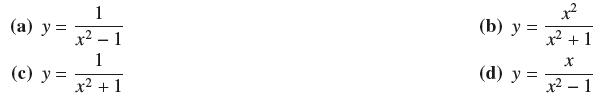
Match the graphs in Figure 19 with the two functions y = 3x x² - 1 and y = 3.x² x² - 1 . Explain.
Ron’s toll pass recorded him entering the tollway at mile 0 at 12:17 PM. He exited at mile 115 at 1:52 PM, and soon thereafter he was pulled over by the state police. “The speed limit on the tollway is 65 miles per hour,” the trooper told Ron. “You exceeded that by more than five miles per
Sketch the graph of a function ƒ satisfying all of the given conditions.ƒ'(x) > 0 and ƒ"(x) < 0 for all x
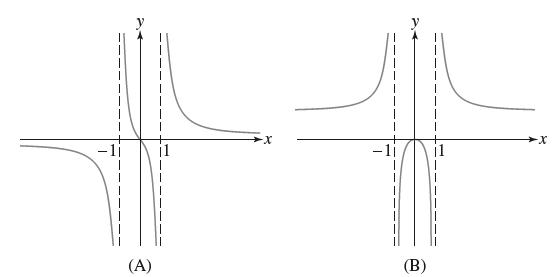
Match the functions below with their graphs in Figure 20. (a) y = (c) y = 1 x²-1 1 x² + 1 (b) y = (d) y = 1² x² + 1 X x² - 1
Two days after he bought a speedometer for his bicycle, Lance brought it back to the Yellow Jersey Bike Shop. “There is a problem with this speedometer,” Lance complained to the clerk. “Yesterday I cycled the 22-mile Rogadzo Road Trail in 78 minutes, and not once did the speedometer read
Sketch the graph of a function ƒ satisfying all of the given conditions.(i) ƒ'(x) > 0 for all x, and(ii) ƒ"(x) < 0 for x < 0 and ƒ"(x) > 0 for x > 0.
Sketch the graph of the function. Indicate the transition points and asymptotes. у= 1 3x-1
Sketch the graph of a function ƒ satisfying all of the given conditions.(i) ƒ'(x) < 0 for x < 0 and ƒ'(x) > 0 for x > 0, and(ii) ƒ"(x) < 0 for |x| > 2, and ƒ"(x) > 0 for |x| < 2
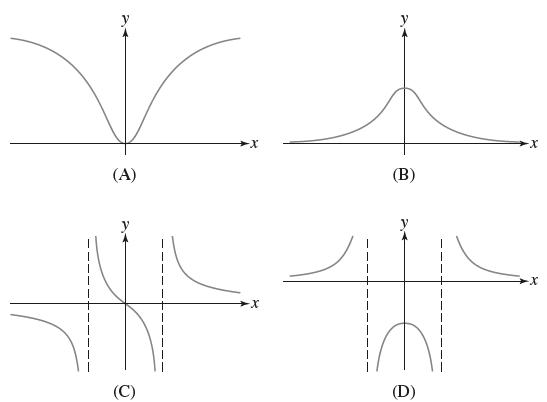
Sketch the graph of the function. Indicate the transition points and asymptotes. y = x-2 x-3
Show that ƒ(x) = 1 − |x| satisfies the conclusion of the MVT on [a, b] if both a and b are positive or negative, but not if a < 0 and b > 0.
An infectious flu spreads slowly at the beginning of an epidemic. The infection process accelerates until a majority of the susceptible individuals are infected, at which point the process slows down.(a) If R(t) is the number of individuals infected at time t, describe the concavity of the graph of
Sketch the graph of the function. Indicate the transition points and asymptotes. y = x + 3 x-2
Which values of c satisfy the conclusion of the MVT on the interval [a, b] if f is a linear function?
Sketch the graph of the function. Indicate the transition points and asymptotes. y = x + 1 X
Show that if ƒ is any quadratic polynomial, then the midpoint c = a + b /2 satisfies the conclusion of the MVT on [a, b] for any a and b.
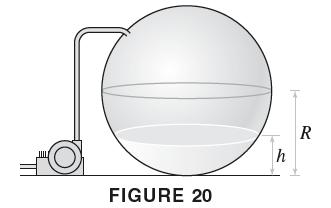
Water is pumped into a sphere of radius R at a variable rate in such a way that the water level rises at a constant rate (Figure 20). Let V(t) be the volume of water in the tank at time t. Sketch the graph V (approximately, but with the correct concavity). Where does the point of inflection occur?
Sketch the graph of the function. Indicate the transition points and asymptotes. 1 y = =+ 1 x-1
Suppose that ƒ(0) = 2 and ƒ'(x) ≤ 3 for x > 0. Apply the MVT to the interval [0, 4] to prove that ƒ(4) ≤ 14. Prove more generally that ƒ(x) ≤ 2 + 3x for all x > 0.
(Continuation of Exercise 59) If the sphere has radius R, the volume of water is V = π (Rh2 − 1/3 h3), where h is the water level. Assume the level rises at a constant rate of 1 (i.e., h = t).(a) Find the inflection point of V. Does this agree with your conclusion in Exercise 59?(b) Plot V for
Sketch the graph of the function. Indicate the transition points and asymptotes. y = 1 X 1 x-1
Sketch the graph of the function. Indicate the transition points and asymptotes. y = 1 x(x - 2)
Show that if ƒ(2) = −2 and ƒ(x) ≥ 5 for x > 2, then ƒ(4) ≥ 8.
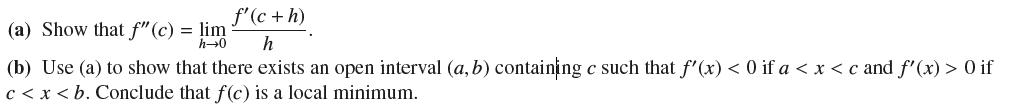
Assume that ƒ is differentiable.Let c be a critical point such that ƒ"(c) > 0 [the case ƒ"(c) (a) Show that f" (c) = lim f'(c + h) h (b) Use (a) to show that there exists an open interval (a, b) containing c such that f'(x) < 0 if a < x < c and f'(x) > 0 if c < x < b. Conclude that f(c) is a
Sketch the graph of the function. Indicate the transition points and asymptotes. y = X x²-9
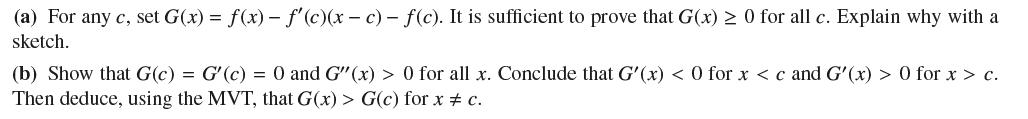
Prove that if ƒ"exists and ƒ"(x) > 0 for all x, then the graph of ƒ“sits above” its tangent lines. (a) For any c, set G(x) = f(x) = f'(c)(x - c) - f(c). It is sufficient to prove that G(x) > 0 for all c. Explain why with a sketch. (b) Show that G(c) = G'(c) = 0 and G"(x) > 0 for all x.
Show that a cubic function ƒ(x) = x3 + ax2 + bx + c is increasing on (−∞,∞) if b > a2/3.
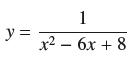
Sketch the graph of the function. Indicate the transition points and asymptotes. y = 1 x² - 6x + 8
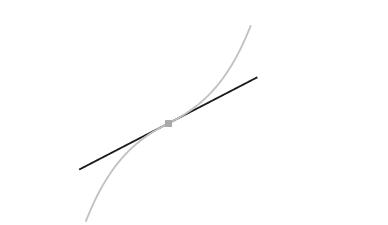
Assume that ƒ" exists and let c be a point of inflection of ƒ.(a) Use the method of Exercise 62 to prove that the tangent line at x = c crosses the graph (Figure 21). Show that G(x) changes sign at x = c.Data From Exercise 62Prove that if ƒ" exists and ƒ"(x) > 0 for all x, then the graph of
Prove that if ƒ(0) = g(0) and ƒ'(x) ≤ g'(x) for x ≥ 0, then ƒ(x) ≤ g(x) for all x ≥ 0. Show that the function given by y = ƒ(x) − g(x) is nonincreasing.
Sketch the graph of the function. Indicate the transition points and asymptotes. y = ²³ +1 x
Let C(x) be the cost of producing x units of a certain good. Assume that the graph of C is concave up.(a) Show that the average cost A(x) = C(x)/x is minimized at the production level x0 such that average cost equals marginal cost—that is, A(x0) = C'(x0).(b) Show that the line through (0, 0) and
Use Exercise 64 to prove that x ≤ tan x for 0 ≤ x < π/2 and sin x ≤ x for x ≥ 0.Data From Exercise 64Prove that if ƒ(0) = g(0) and ƒ'(x) ≤ g'(x) for x ≥ 0, then ƒ(x) ≤ g(x) for all x ≥ 0. Show that the function given by y = ƒ(x) − g(x) is nonincreasing.
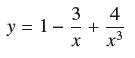
Sketch the graph of the function. Indicate the transition points and asymptotes. y = 1- 3 X + 4 x3
Let ƒ be a polynomial of degree n ≥ 2. Show that ƒ has at least one point of inflection if n is odd. Then give an example to show that ƒ need not have a point of inflection if n is even.
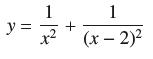
Sketch the graph of the function. Indicate the transition points and asymptotes. y = 1 + 1 (x - 2)²
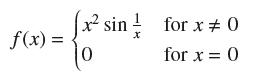
If ƒ'(c) = 0 and ƒ(c) is neither a local min nor a local max, must x = c be a point of inflection? This is true for “reasonable” functions (including the functions studied in this text), but it is not true in general. Let(a) Use the limit definition of the derivative to show that ƒ'(0)
Showing 6400 - 6500
of 8339
First
58
59
60
61
62
63
64
65
66
67
68
69
70
71
72
Last
Step by Step Answers
![y = 1 sin x + 4 [0, 2]](https://dsd5zvtm8ll6.cloudfront.net/images/question_images/1699/8/5/9/1466551cacac83091699859147481.jpg)