New Semester
Started
Get
50% OFF
Study Help!
--h --m --s
Claim Now
Question Answers
Textbooks
Find textbooks, questions and answers
Oops, something went wrong!
Change your search query and then try again
S
Books
FREE
Study Help
Expert Questions
Accounting
General Management
Mathematics
Finance
Organizational Behaviour
Law
Physics
Operating System
Management Leadership
Sociology
Programming
Marketing
Database
Computer Network
Economics
Textbooks Solutions
Accounting
Managerial Accounting
Management Leadership
Cost Accounting
Statistics
Business Law
Corporate Finance
Finance
Economics
Auditing
Tutors
Online Tutors
Find a Tutor
Hire a Tutor
Become a Tutor
AI Tutor
AI Study Planner
NEW
Sell Books
Search
Search
Sign In
Register
study help
mathematics
calculus early transcendentals
Calculus Early Transcendentals 2nd edition William L. Briggs, Lyle Cochran, Bernard Gillett - Solutions
Evaluate the following definite integrals using the Fundamental Theorem of Calculus. CT/3 sec x tan xr dx
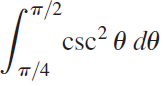
Evaluate the following definite integrals using the Fundamental Theorem of Calculus. -п/2 csc² 0 do T/4
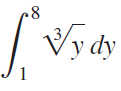
Evaluate the following definite integrals using the Fundamental Theorem of Calculus. Vy dy
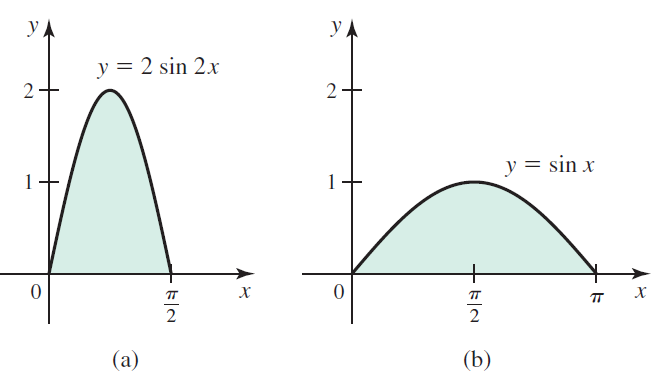
The area of the shaded region under the curve y = 2 sin 2x in (a) equals the area of the shaded region under the curve y = sin x in (b). Explain why this is true without computing areas. УА y, УА y = 2 sin 2x y = sin x 1 х х т т (a) (b) 2.
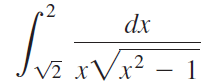
Evaluate the following definite integrals using the Fundamental Theorem of Calculus. .2 dx Vx² – 1 v2 xVx
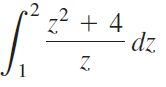
Evaluate the following definite integrals using the Fundamental Theorem of Calculus. .2 .2 z + 4 dz Z.
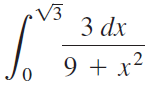
Evaluate the following definite integrals using the Fundamental Theorem of Calculus. V3 3 dx .2 9 + x
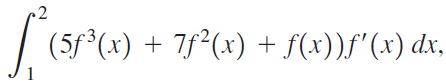
Evaluate the following integrals in which the function f is unspecified. Note that f(p) is the pth derivative of f and fp is the pth power of f. Assume f and its derivatives are continuous for all real numbers.where f(1) = 4, f(2) = 5 (5f*(x) + 7f²(x) + f(x))f'(x) dx,
Find the area of the region R bounded by the graph of f and the x-axis on the given interval. Graph f and show the region R.f(x) = 2 - |x| on [-2, 4]
Evaluate the following integrals in which the function f is unspecified. Note that f(p) is the pth derivative of f and fp is the pth power of f. Assume f and its derivatives are continuous for all real numbers.
Find the area of the region R bounded by the graph of f and the x-axis on the given interval. Graph f and show the region R.f(x) = (1 - x2)-1/2 on [-1/2, √3/2]
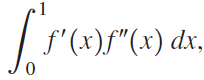
Evaluate the following integrals in which the function f is unspecified. Note that f(p) is the pth derivative of f and fp is the pth power of f. Assume f and its derivatives are continuous for all real numbers.∫ f(p) (x))n f(p + 1) (x) dx, where p is a positive integer, n ≠ -1
Find the area of the region R bounded by the graph of f and the x-axis on the given interval. Graph f and show the region R.f(x) = x4 - 4 on [1, 4]
Find the area of the region R bounded by the graph of f and the x-axis on the given interval. Graph f and show the region R.f(x) = x2(x - 2) on [-1, 3]
Evaluate the following integrals in which the function f is unspecified. Note that f(p) is the pth derivative of f and fp is the pth power of f. Assume f and its derivatives are continuous for all real numbers.∫ 2(f2 (x) + 2 f(x)) f(x) f'(x) dx
Simplify the given expressions.where f' is continuous on [3, 8] Гго f'(t) dt, 3
Occasionally, two different substitutions do the job. Use each substitution to evaluate the following integrals.(u = √x + a and u = x + a) xVx + a dx; a > 0
Occasionally, two different substitutions do the job. Use each substitution to evaluate the following integrals.∫ sec3 θ tan θ dθ (u = cos θ and θ = sec θ)
Use the Substitution Rule to prove thatand sin (2ax) х sin? ax dx 2 4a Г- sin (2ax) + C. х cos? ax dx 2 4a
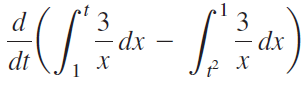
Simplify the given expressions. d 3 3 –dx - dx dt
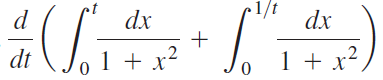
Simplify the given expressions. r1/t dx dx 1 + x? 1 + x .2 dt
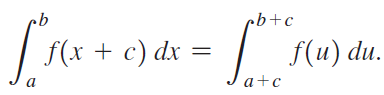
Perhaps the simplest change of variables is the shift or translation given by u = x + c, where c is a real number.a. Prove that shifting a function does not change the net area under the curve, in the sense thatb. Draw a picture to illustrate this change of variables in the case that f(x) = sin x,
Consider the function f(x) = x2 - 4x.a. Graph f on the interval x ≥ 0.b. For what value of b > 0 isc. In general, for the function f(x) = x2 - ax, where a > 0, for what value of b > 0 (as a function of a) is Sf(x) dx 0? JoF(x) dx = 0?
Consider the graph of the cubic y = x(x - a)(x - b), where 0 < a < b. Verify that the graph bounds a region above the x-axis, for 0 < x < a, and bounds a region below the x-axis, for a < x < b. What is the relationship between a and b if the areas of these two regions are equal?
If necessary, use two or more substitutions to find the following integrals.∫ x sin4 x2 cos x2 dx (Begin with u = x2, then use v = sin u.)
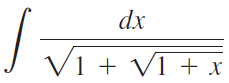
If necessary, use two or more substitutions to find the following integrals.Begin with u = √1 + x. dx J Vi + vĩ + x
Use the Fundamental Theorem of Calculus, Part 1, to find the function f that satisfies the equationVerify the result by substitution into the equation. гом х f(t) dt = 2 cos x + 3x – 2.
If necessary, use two or more substitutions to find the following integrals. Vx – xVī dx
Consider the integral where p is a positive integer.a. Write the left Riemann sum for the integral with n subintervals.b. It is a fact (proved by the 17th-century mathematicians Fermat and Pascal) that Use this fact to evaluate I(p). I(p) = S,x² dx, k \P lim Σ p + 1 k=0
Determine whether the following statements are true and give an explanation or counterexample.a. Suppose that f is a positive decreasing function, for x > 0. Then the area functionis an increasing function of x.b. Suppose that f is a negative increasing function, for x > 0. Then the area
Use a change of variables to verify each integral.a. ∫ tan x dx = -ln |cos x| + C = ln |sec x| + C.b. ∫ cot x dx = ln |sin x | + C
Consider the function g, which is given in terms of a definite integral with a variable upper limit.a. Graph the integrand.b. Calculate g'(x).c. Graph g, showing all your work and reasoning. 8(x) cos (7 Vi) dt
Consider the function defined on [0, 1] such that f(x) = 1 if x is a rational number and f(x) = 0 if x is irrational. This function has an infinite number of discontinuities, and the integral does not exist. Show that the right, left, and midpoint Riemann sums on regular partitions with n
Consider the function g, which is given in terms of a definite integral with a variable upper limit.a. Graph the integrand.b. Calculate g'(x).c. Graph g, showing all your work and reasoning.(a Fresnel integral) .х sin (тt?) di 8(х)
Suppose a right Riemann sum is used to approximate the area of the region bounded by the graph of a positive function and the x-axis on the interval [a, b]. Fill in the following table to indicate whether the resulting approximation underestimates or overestimates the exact area in the four cases
If 0 < c < d, then find the value of b (in terms of c and d) for which S (x + b) dx = 0,
Use a graphing utility to verify that the functions f(x) = sin kx have a period of 2π/k, where k = 1, 2, 3, . . . Equivalently, the first “hump” of f(x) = sin kx occurs on the interval [0, π/k). Verify that the average value of the first hump of f(x) = sin kx is independent of k. What is the
Consider the right triangle with vertices (0, 0), (0, b), and (a, 0), where a > 0 and b > 0. Show that the average vertical distance from points on the x-axis to the hypotenuse is b/2, for all a > 0.
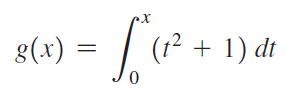
Consider the function g, which is given in terms of a definite integral with a variable upper limit.a. Graph the integrand.b. Calculate g'(x).c. Graph g, showing all your work and reasoning. (1² + 1) dt 8(x) =
Suppose a left Riemann sum is used to approximate the area of the region bounded by the graph of a positive function and the x-axis on the interval [a, b]. Fill in the following table to indicate whether the resulting approximation underestimates or overestimates the exact area in the four cases
Use the definition of the definite integral to justify the propertywhere f is continuous and c is a real number. x = c [" f(x) dx, S"cf(x) dx a
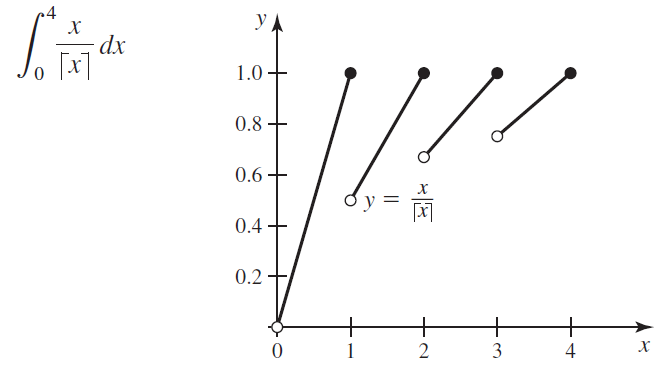
Recall that the floor function x is the greatest integer less than or equal to x and that the ceiling function x is the least integer greater than or equal to x. Use the result of Exercise 76 and the graphs to evaluate the following integrals. 24 УА 1.0 0.8 0.6 - 0.4 + 0.2 - + 4 ||
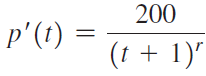
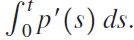
The population of a culture of bacteria has a growth rate given by
Consider the function g, which is given in terms of a definite integral with a variable upper limit.a. Graph the integrand.b. Calculate g'(x).c. Graph g, showing all your work and reasoning. sin? t dt 8(x) =
Assume that the linear function f(x) = mx + c is positive on the interval [a, b]. Prove that the midpoint Riemann sum with any value of n gives the exact area of the region between the graph of f and the x-axis on [a, b].
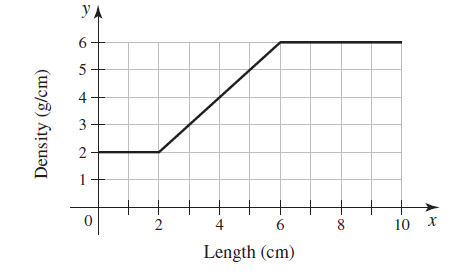
Recall that the floor function x is the greatest integer less than or equal to x and that the ceiling function x is the least integer greater than or equal to x. Use the result of Exercise 76 and the graphs to evaluate the following integrals. •5 УА x [x] dx 15 - y = x[x] 10 5 + + + х 3 4
Let f(x) = c, where c > 0, be a constant function on [a, b]. Prove that any Riemann sum for any value of n gives the exact area of the region between the graph of f and the x-axis on [a, b].
Consider the function f and the points a, b, and c. a. Find the area function
An object moves along a line with a velocity in m/s given by v(t) = 8 cos (πt/6). Its initial position is s(0) = 0.a. Graph the velocity function.b. The position of the object is given by Find the position function, for t ≥ 0.c. What is the period of the motion—that is, starting at any point,
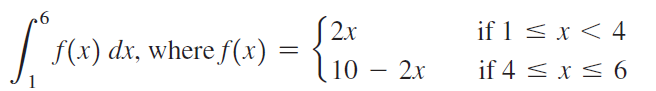
Use geometry and the result of Exercise 76 to evaluate the following integrals. S2r if 1 < x < 4 f(x) dx, where f(x) if 4 < x < 6 10 – 2x
Use a calculator and the method of your choice to approximate the area of the following regions. Present your calculations in a table, showing approximations using n = 16, 32, and 64 subintervals. Comment on whether your approximations appear to approach a limit.The region bounded by the graph of f
Consider the function f and the points a, b, and c. a. Find the area function
Suppose that f is an even function with Evaluate each integral.a.b. 8. VöS (x) dx = 9. Гуney xf(x²) dx
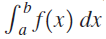
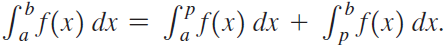
Use geometry and the result of Exercise 76 to evaluate the following integrals.Data from Exercise 76Suppose f is continuous on the intervals [a, p] and (p, b), where a < p < b, with a finite jump at p. Form a uniform partition on the interval [a, p] with n grid points and another uniform
Use a calculator and the method of your choice to approximate the area of the following regions. Present your calculations in a table, showing approximations using n = 16, 32, and 64 subintervals. Comment on whether your approximations appear to approach a limit.The region bounded by the graph of f
Consider the function f and the points a, b, and c. a. Find the area function
The family of parabolas y = (1/a) - x2/a3, where a > 0, has the property that for x ≥ 0, the x-intercept is (a, 0) and the y-intercept is (0, 1/a). Let A(a) be the area of the region in the first quadrant bounded by the parabola and the x-axis. Find A(a) and determine whether it is an
Suppose f is continuous on the intervals [a, p] and (p, b), where a < p < b, with a finite jump at p. Form a uniform partition on the interval [a, p] with n grid points and another uniform partition on the interval [p, b] with m grid points, where p is a grid point of both partitions. Write a
Use a calculator and the method of your choice to approximate the area of the following regions. Present your calculations in a table, showing approximations using n = 16, 32, and 64 subintervals. Comment on whether your approximations appear to approach a limit.The region bounded by the graph of f
Consider the function f and the points a, b, and c. a. Find the area function
Suppose that p is a nonzero real number and f is an odd integrable function withEvaluate each integral.a.b. Jos(x) dx = = T. т. • /(2 p) cos px f(sin px) dx
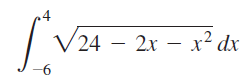
Use geometry to evaluate the following integrals. V24 — 2х — х? dх
Use a calculator and the method of your choice to approximate the area of the following regions. Present your calculations in a table, showing approximations using n = 16, 32, and 64 subintervals. Comment on whether your approximations appear to approach a limit.The region bounded by the graph of f
Consider the function f and the points a, b, and c. a. Find the area function
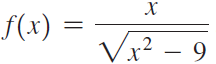
Find the area of the following regions.The region bounded by the graph ofand the x-axis between x = 4 and x = 5 х Г) Уx — 9 .2 6.
Find the area of the following regions.The region bounded by the graph of f(x) = (x - 4)4 and the x-axis between x = 2 and x = 6
The graph of f is given in the figure. Let and evaluate A(2), A(5), A(8), and A(12). A(x) = JF(1) di УА 4 y = f(t) 2 4 12 -2 of circle of radius 2
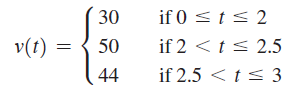
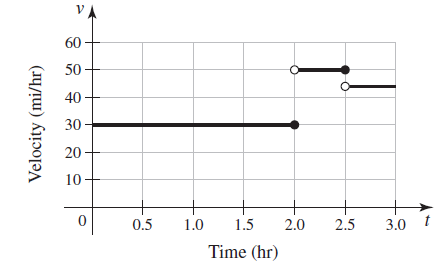
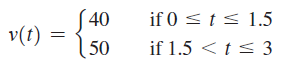
The following functions describe the velocity of a car (in mi/hr) moving along a straight highway for a 3-hr interval. In each case, find the function that gives the displacement of the car over the interval [0, t], where 0 ≤ t ≤ 3. if 0
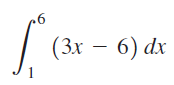
Use geometry to evaluate the following integrals. Г | (Зх — 6) dx
Use geometry to evaluate the following integrals. Гe 2x
The following functions describe the velocity of a car (in mi/hr) moving along a straight highway for a 3-hr interval. In each case, find the function that gives the displacement of the car over the interval [0, t], where 0 ≤ t ≤ 3. if 0
The graph of f is given in the figure. Let and evaluate A(1), A(2), A(4), and A(6). A(x) = S,f(1) Ул y, of circle of radius 2 y = f(t) 4
Find the area of the following regions.The region bounded by the graph of f(θ) = cos θ sin θ and the θ-axis between θ = 0 and θ = π/2
Find the area of the following regions.The region bounded by the graph of f(x) = x sin x2 and the x-axis between x = 0 and x = √π
Consider the function f and its graph.a. Estimate the zeros of the area functionfor 0 ≤ x ≤ 10.b. Estimate the points (if any) at which A has a local maximum or minimum.c. Sketch a graph of A, for 0 ≤ x ≤ 10, without a scale on the y-axis. A(x) = Sf(1) di, УА y = f(t) 2 10 t
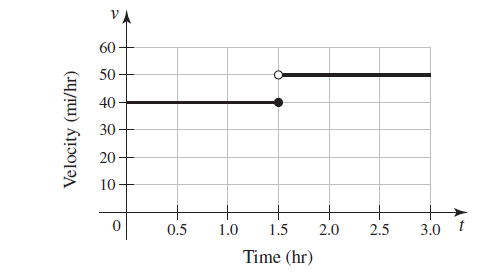
A thin 10-cm rod is made of an alloy whose density varies along its length according to the function shown in the figure. Assume density is measured in units of g/cm. In Chapter 6, we show that the mass of the rod is the area under the density curve.a. Find the mass of the left half of the rod
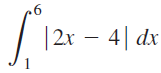
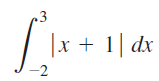
Use geometry to evaluate the following integrals. .3 |x + 1| dx -2
Graph the following functions. Then use geometry (not Riemann sums) to find the area and the net area of the region described.The region between the graph of y = 3x - 6 and the x-axis, for 0 ≤ x ≤ 6
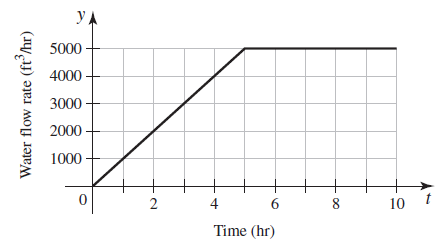
Suppose a gauge at the outflow of a reservoir measures the flow rate of water in units of ft3/hr. In Chapter 6, we show that the total amount of water that flows out of the reservoir is the area under the flow rate curve. Consider the flow-rate function shown in the figure.a. Find the amount of
Graph the following functions. Then use geometry (not Riemann sums) to find the area and the net area of the region described.The region between the graph of y = 1 - |x| and the x-axis, for -2 ≤ x ≤ 2
Use a change of variables to evaluate the following integrals. -п/4 esin' x sin 2x dx
Graph the following functions. Then use geometry (not Riemann sums) to find the area and the net area of the region described.The region between the graph of y = -3x and the x-axis, for -2 ≤ x ≤ 2
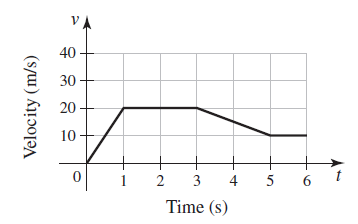
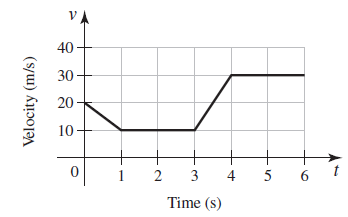
Consider the velocity function for an object moving along a line (see figure).a. Describe the motion of the object over the interval [0, 6].b. Use geometry to find the displacement of the object between t = 0 and t = 2.c. Use geometry to find the displacement of the object between t = 2 and t =
Consider the function f and its graph.a. Estimate the zeros of the area functionfor 0 ≤ x ≤ 10.b. Estimate the points (if any) at which A has a local maximum or minimum.c. Sketch a graph of A, for 0 ≤ x ≤ 10, without a scale on the y-axis. A(x) = Sf(1) di, y, y = f(t) At + 4 + 6. 10 t
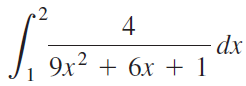
Use a change of variables to evaluate the following integrals. Г. 4 – dx 9x2 + 6х + 1
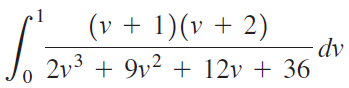
Use a change of variables to evaluate the following integrals. (v + 1)(v + 2) – dv 2v3 + 9v2 + 12v + 36
Consider the function f and its graph.a. Estimate the zeros of the area functionfor 0 ≤ x ≤ 10.b. Estimate the points (if any) at which A has a local maximum or minimum.c. Sketch a graph of A, for 0 ≤ x ≤ 10, without a scale on the y-axis. A(x) = Sf(1) di, y. y = f(t) + 4 10 t
Consider the velocity function for an object moving along a line (see figure).a. Describe the motion of the object over the interval [0, 6]. b. Use geometry to find the displacement of the object between t = 0 and t = 3.c. Use geometry to find the displacement of the object between t = 3 and t
Graph the following functions. Then use geometry (not Riemann sums) to find the area and the net area of the region described.The region between the graph of y = 4x - 8 and the x-axis, for -4 ≤ x ≤ 8
Consider two functions f and g on [1, 6] such thatEvaluate the following integrals.a. b. c. d. e. f. Sis(x) dx = Li8(x) dx = 5. [‚f(x) dx = 5, and Si8(x) dx = 2. 5, and .4 |злю д dx
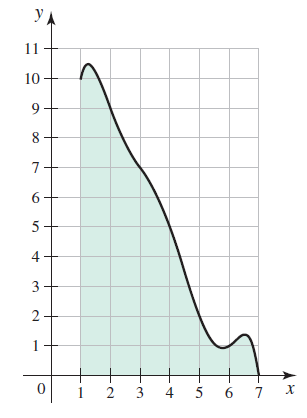
Approximate the area of the region bounded by the graph (see figure) and the x-axis by dividing the interval [1, 7] into n = 6 subintervals. Use a left and right Riemann sum to obtain two different approximations. УА 11 10 4 3 2 - 1 6 7 X 4 5 3.
Consider the function f and its graph.a. Estimate the zeros of the area functionfor 0 ≤ x ≤ 10.b. Estimate the points (if any) at which A has a local maximum or minimum.c. Sketch a graph of A, for 0 ≤ x ≤ 10, without a scale on the y-axis. A(x) = Sf(1) di,
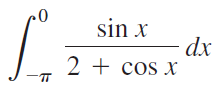
Use a change of variables to evaluate the following integrals. sin x dx 2 + cos x
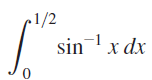
Consider the following definite integrals.a. Write the midpoint Riemann sum in sigma notation for an arbitrary value of n.b. Evaluate each sum using a calculator with n = 20, 50, and 100. Use these values to estimate the value of the integral. 1/2 sinx dx
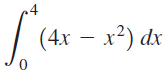
Consider the following definite integrals.a. Write the midpoint Riemann sum in sigma notation for an arbitrary value of n.b. Evaluate each sum using a calculator with n = 20, 50, and 100. Use these values to estimate the value of the integral. | (4х — х?) dx
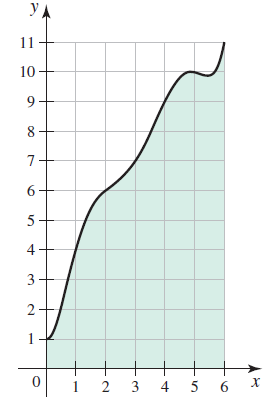
Approximate the area of the region bounded by the graph (see figure) and the x-axis by dividing the interval [0, 6] into n = 3 subintervals. Use a left and right Riemann sum to obtain two different approximations. y, 11 10 8. 6. 4 5 6. 4) 3. 2. 3. 2.
Match the functions f, whose graphs are given in a–d, with the area functionswhose graphs are given in A–D. A(x) = Sf(t) dt, y Ул y = f(1) y = f(t) (a) (b) УА Ул y = f(t) y = f(t) (c) (d)
Use a change of variables to evaluate the following integrals. (x – 1)(x² – 2 2x)' dx
Consider the following definite integrals.a. Write the midpoint Riemann sum in sigma notation for an arbitrary value of n.b. Evaluate each sum using a calculator with n = 20, 50, and 100. Use these values to estimate the value of the integral. .2 тх sin dx -1
Use a change of variables to evaluate the following integrals. V16 – x4 dx
Showing 3700 - 3800
of 6775
First
31
32
33
34
35
36
37
38
39
40
41
42
43
44
45
Last
Step by Step Answers
![Decreasing on [a, b] [a,b] Concave up on [a,b] [a, b] Concave down on](https://dsd5zvtm8ll6.cloudfront.net/si.question.images/images/question_images/1551/2/6/2/9075c7664bb1ec591551245650601.jpg)
![Increasing on [a,b] Decreasing on [a, b] Concave up on [a,b] [a, b] Concave down on](https://dsd5zvtm8ll6.cloudfront.net/si.question.images/images/question_images/1551/2/6/2/8345c766472885ba1551245577977.jpg)
![•5 УА x [x] dx 15 - y = x[x] 10 5 + + + х 3 4](https://dsd5zvtm8ll6.cloudfront.net/si.question.images/images/question_images/1551/2/8/2/9085c76b2dc405001551265651022.jpg)