New Semester
Started
Get
50% OFF
Study Help!
--h --m --s
Claim Now
Question Answers
Textbooks
Find textbooks, questions and answers
Oops, something went wrong!
Change your search query and then try again
S
Books
FREE
Study Help
Expert Questions
Accounting
General Management
Mathematics
Finance
Organizational Behaviour
Law
Physics
Operating System
Management Leadership
Sociology
Programming
Marketing
Database
Computer Network
Economics
Textbooks Solutions
Accounting
Managerial Accounting
Management Leadership
Cost Accounting
Statistics
Business Law
Corporate Finance
Finance
Economics
Auditing
Tutors
Online Tutors
Find a Tutor
Hire a Tutor
Become a Tutor
AI Tutor
AI Study Planner
NEW
Sell Books
Search
Search
Sign In
Register
study help
mathematics
introductory statistics exploring the world through data
Introductory Statistics Exploring The World Through Data 3rd Edition Robert Gould, Rebecca Wong, Colleen N. Ryan - Solutions
The acceptance rate for a random sample of 15 medical schools in the United States was taken. The mean acceptance rate for this sample was 5.77 with a standard error of 0.56. Assume the distribution of acceptance rates is Normal.a. Decide whether each of the following statements is worded correctly
A random sample of 25 private universities was selected. A 95% confidence interval for the mean in-state tuition costs at private universities was (22,501, 32,664). Which of the following is a correct interpretation of the confidence level?a. There is a 95% probability that the mean in-state
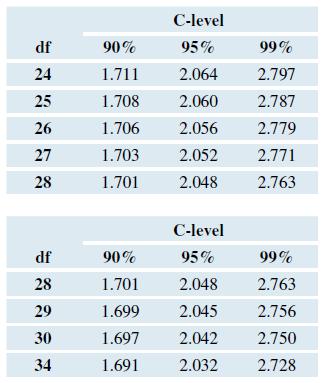
A researcher collects one sample of 27 measurements from a population and wants to find a 95% confidence interval. What value should he use for t*? (Recall that df = n - 1 for a one-sample t-interval.) C-level df 90% 95% 99% 24 1.711 2.064 2.797 25 1.708 2.060 2.787 26 1.706 2.056 2.779 27 1.703
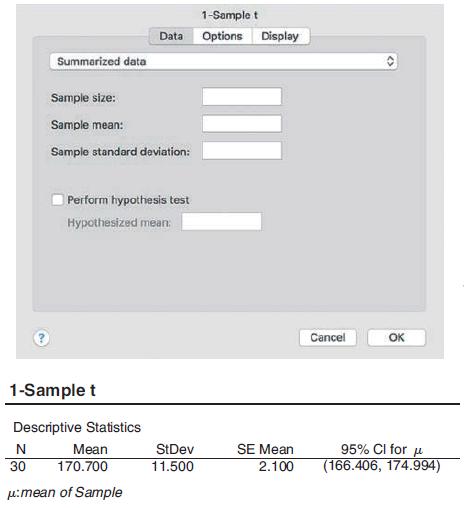
A random sample of 30 12th-grade students was selected. The sample mean height was 170.7 centimeters, and the sample standard deviation was 11.5 centimeters.a. State how you would fill in the numbers below to do the calculation with Minitab Express.b. Report the confidence interval in a carefully
A random sample of 50 12th-grade students was asked how long it took to get to school. The sample mean was 16.2 minutes, and the sample standard deviation was 12. minutes.a. Find a 95% confidence interval for the population mean time it takes 12th-grade students to get to school.b. Would a 90%
A random sample of 25 baseball players from the 2017 Major League Baseball season was taken and the sample data was used to construct two confidence intervals for the population mean. One interval was (22.0, 42.8). The other interval was (19.9, 44.0). a. One interval is a 95% interval, and one is a
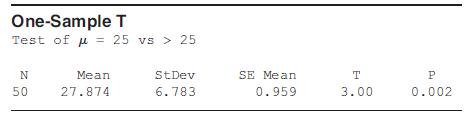
A body mass index (BMI) of more than 25 is considered unhealthy. The Minitab output given is from 50 randomly and independently selected people from the NHANES study.Test the hypothesis that the mean BMI is more than 25 using a significance level of 0.05. Assume that conditions are met. One-Sample
In the United States, the population mean height for 10-year-old girls is 54.5 inches. Suppose a random sample of 15 10-year-old girls from Brazil is taken and that these girls had a sample mean height of 53.2 inches with a standard deviation of 2.5 inches. Assume that heights are Normally
In the 2015 AFC Championship game, there was a charge the New England Patriots deflated their footballs for an advantage. The balls should be inflated to between 12.5 and 13.5 pounds per square inch. The measurements were 11.50, 10.85, 11.15, 10.70, 11.10, 11.60, 11.85, 11.10, 10.95, 10.50, and
In the 2015 AFC Championship game, there was a charge the New England Patriots deflated their footballs for an advantage. The Patriots’ opponents during the championship game were the Indianapolis Colts. Measurements of the Colts footballs were taken. The balls should be inflated to between 12.5
According to Deadline.com, the average price for a movie ticket in 2018 was $8.97. A random sample of movie prices in the San Francisco Bay Area 25 movie ticket prices had a sample mean of $12.27 with a standard deviation of $3.36.a. Do we have evidence that the price of a movie ticket in the San
According to Statista.com, the average price of a ticket to a Broadway show in 2017 was $109.21. A random sample of 25 Broadway ticket prices in 2018 had a sample mean of $114.7 with a standard deviation of $43.3.a. Do we have evidence that Broadway ticket prices changed from 2017 prices? Use a
A 95% confidence interval for the ages of the first six presidents at their inaugurations is (56.2, 59.5). Either interpret the interval or explain why it should not be interpreted.
State whether each situation has independent or paired (dependent) samples.a. A researcher wants to compare food prices at two grocery stores. She purchases 20 items at Store A and finds the mean and the standard deviation for the cost of the items. She then purchases 20 items at Store B and again
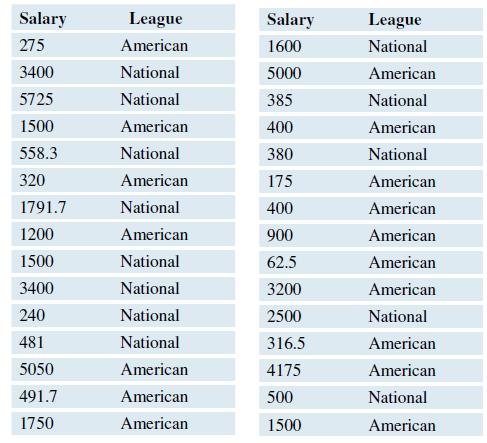
A random sample of 40 professional baseball salaries from 1985 through 2015 was selected. The league of the player (American or National) was also recorded. Salary (in hundred thousand dollars) and league are shown in the table. Test the hypothesis that there is a difference in the mean salary of
Baseball Salaries In exercise 9.63 you could not reject the null hypothesis that the mean salary for the two leagues are the same, using a two-tailed test with a significance level of 0.05.a. If you found a 95% confidence interval for the difference between means, would it capture 0? Explain.b.
In exercise 9.64, you could reject the null hypothesis that the mean weights of soccer and baseball players were equal using a two-tailed test with a significance level of 0.05.a. If you found a 95% confidence interval for the difference between means, would it capture 0? Explain.b. If you found a
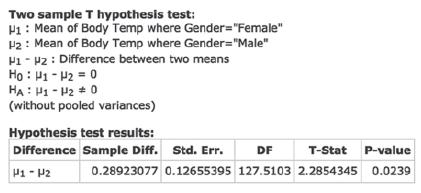
The body temperatures of 65 men and 65 women were compared. The results of a hypothesis test are shown. Assume the conditions for using a t-test are satisfied.a. Why was a two-sample t-test used instead of a paired t-test?b. Which sample mean is larger? How do you know?c. Write the conclusion for
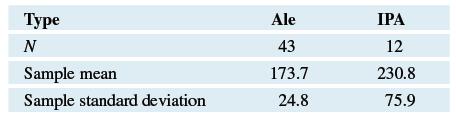
Data were collected on calorie content in ales and IPAs and is summarized in the following table.a. Does the sample data provide evidence that there is a difference in calorie content for ales and IPAs? Assume the conditions for using a t-test are satisfied. Use a significance level of 0.05 for the
Heart rate data for a random sample of males and females was obtained. The data are available at the text’s website. Use the data to answer these questions. Data were originally published in the Journal of Statistics Education online data archive and accessed through StatCrunch.a. Find a 95%
A survey of asked respondents how long (in years) they thought it would be before self driving cars were the majority of vehicles on the road, and a random sample from this survey was selected. The data are available at the text’s website.a. Find a 95% confidence interval for the difference in
Assume women’s heights are approximately Normally distributed with a mean of 65 inches and a standard deviation of 2.5 inches. Which of the following questions can be answered using the Central Limit Theorem for sample means as needed? If the question can be answered, do so. If the question
According to home-water-works.org, the average shower in the United States lasts 8.2 minutes. Assume the standard deviation of shower times is 2 minutes and the distribution of shower times is right-skewed.Which of the following questions can be answered using the Central Limit Theorem for sample
Choose a test for each situation: one-sample t-test, two-sample t-test, paired t-test, and no t-test.a. A random sample of students who transfered to a 4-year university from community colleges are asked their GPAs. Our goal is to determine whether the mean GPA for transfer students is
Choose a t-test for each situation: one-sample t-test, two-sample t-test, paired t-test, and no t-test.a. A random sample of car dealerships is obtained. Then a student walks onto each dealer’s lot wearing old clothes and finds out how long it takes (in seconds) for a salesperson to approach the
A fast-food chain advertises that the mediumsize serving of French fries weighs 135 grams. A reporter took a random sample of 10 medium orders of French fries and weighed each order. The weights (in grams) were 111, 124, 125, 156, 127, 134, 135, 136, 139, 141. Assume the population distribution is
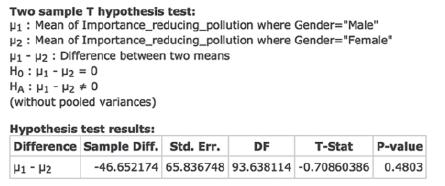
A random sample of 12th-grade students were asked to rate the importance of reducing pollution on a scale from 0 to 1000. Responses were recorded by gender. The results of a hypothesis test are shown. Assume the conditions for using a two-sample t-test are met.a. Which group has a higher mean, and
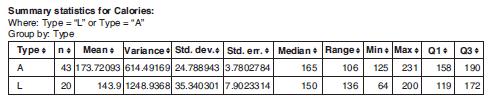
Data were collected on calorie content for a random sample of ales and lagers and are summarized in the table. Assume the conditions for using a t-test are satisfied.a. If we wanted to use a hypothesis test to determine if there is a difference in the calorie content of ales and IPAs, would we use
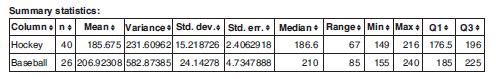
Data were collected on the weights of random samples of professional hockey players and professional baseball players.a. Using these descriptive statistics, can a two sample t-test be used to determine if there is a difference in the mean weights of professional hockey and baseball players? If so,
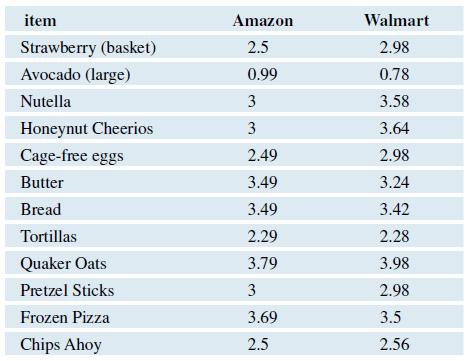
The table shows the prices for identical groceries at two online grocery delivery services, Amazon and Walmart. Assume the sampling is random and the populations are Normal.a. Give the data, would a two-sample t-test or a paired t-test be appropriate to test the hypothesis that the mean prices at
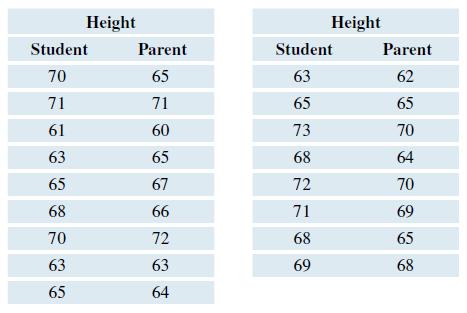
The following table shows the heights (in inches) of a random sample of students and their parent of the same gender. Test the hypothesis that the mean for the students is more than the mean for the parents, at the 0.05 level. Assume the data are Normal.a. Use the paired t-test that is
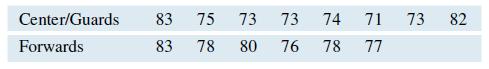
The table shows the heights (in inches) of all the basketball players on the 2017–2018 Santa Clara University basketball team. Explain why it would be inappropriate to do a t test with these data. Center/Guards 83 75 73 73 74 71 73 82 Forwards 83 78 80 76 78 77
a. In Chapter 8, you learned some tests of proportions. Are tests of proportions used for categorical or numerical data?b. In this chapter, you are learning to use chi-square tests. Do these tests apply to categorical or numerical data?
In Chapter 9, you learned some tests of means. Are tests of means used for numerical or categorical data?
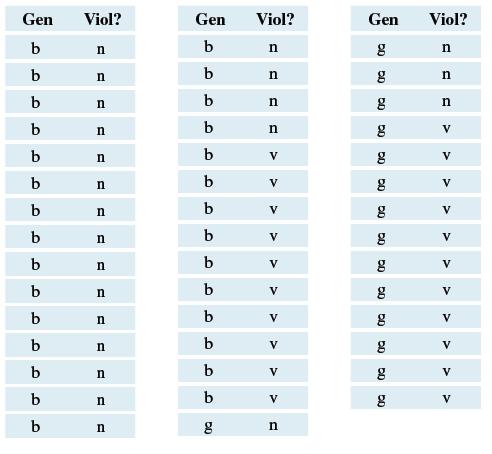
A statistics student conducted a study in Ventura County, California, that looked at criminals on probation who were under 15 years of age to see whether there was an association between the type of crime (violent or nonviolent) and gender. Violent crimes involve physical contact such as hitting or
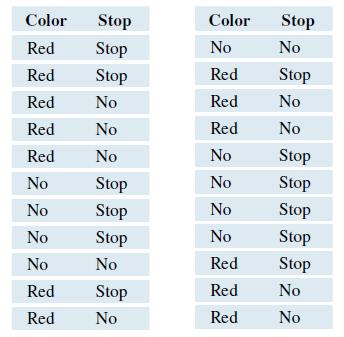
The table shows the raw data for the results of a student survey of 22 cars and whether they stopped completely at a stop sign or not. In the Color column, “Red” means the car was red, and “No” means the car was not red. In the Stop column, “Stop” means the car stopped, and “No”
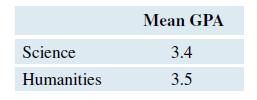
The table summarizes the outcomes of a study that students carried out to determine whether humanities students had a higher mean grade point average (GPA) than science students. Identify both of the variables, and state whether they are numerical or categorical. If numerical, state whether they
According to a 2017 report, 53% of college graduates in California had student loans. Suppose a random sample of 120 college graduates in California shows that 72 had college loans.a. What is the observed frequency of college graduates in the sample who had student loans?b. What is the observed
According to a 2017 report, 64% of college graduate in Illinois had student loans. Suppose a random sample of 80 college graduates in Illinois is selected and 48 of them had student loans. a. What is the observed frequency of college graduates in the sample who had student loans?b. What is the
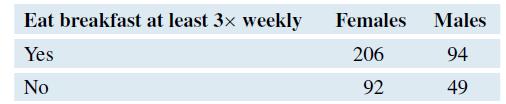
In a 2015 study by Nanney et al. and published in the Journal of American College Health, a random sample of community college students was asked whether they ate breakfast 3 or more times weekly. The data are reported by gender in the table.a. Find the row, column, and grand totals, and prepare a
According to the 2015 High School Youth Risk Behavior Survey, 41.5% of high school students reported they had texted or emailed while driving a car or other vehicle. Suppose you randomly sample 80 high school students and ask if they have texted or emailed while driving. Suppose 38 say yes and 42
Fill in the blank by choosing one of the options given:Chi-square goodness-of-fit tests are applicable if the data consist of ___________ (one categorical variable, two categorical variables, one numerical variable, or two numerical variables).
Fill in the blank by choosing one of the options given:Chi-square goodness-of-fit data are often summarized with ____________ (one row or one column of observed counts—but not both, or at least two rows and at least two columns of observed counts).
In 2018 Pew Research reported that 11% of Americans do not use the Internet. Suppose in a random sample of 200 Americans, 26 reported not using the Internet. Using a chi-square test for goodness-of-fit, test the hypothesis that the proportion of Americans who do not use the Internet is different
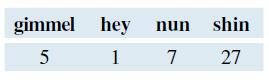
When playing Dreidel, (see photo) you sit in a circle with friends or relatives and take turns spinning a wobbly top (the dreidel). In the center of the circle is a pot of several foil-wrapped chocolate coins. If the four-sided top lands on the Hebrew letter gimmel, you take the whole pot and
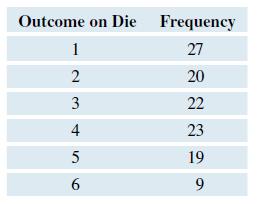
The table shows the results of rolling a six-sided die 120 times.Test the hypothesis that the die is not fair. A fair die should produce equal numbers of each outcome. Use the four-step procedure with a significance level of 0.05, and state your conclusion clearly. Outcome on Die Frequency 1 27 2
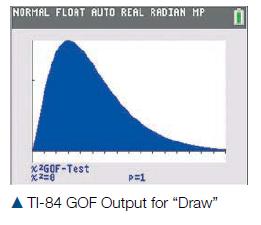
Repeat the chi-square test (all four steps) from exercise 10.23, but this time assume that you got exactly 20 outcomes in each of the six categories. Refer to the figure. Explain. NORMAL FLOAT AUTO REAL RADIAN MP X2GOF-Test P=1 TI-84 GOF Output for "Draw"
A 2018 Gallup poll asked college graduates if they agreed that the courses they took in college were relevant to their work and daily lives. The respondents were also classified by their field of study. If we wanted to test whether there was an association between response to the question and the
Treatment In a 2018 study by Zhu et al. reported in The Lancet, researchers conducted an experiment to determine the efficacy and safety of the drug dorzagliatin in the treatment of patients with Type 2 diabetes. In this double-blind study, patients were randomly assigned to one of two treatment
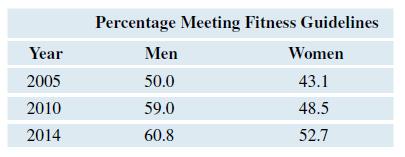
The table shows the percentage of all men and women in the United States aged 18 to 44 who meet aerobic fitness guidelines. Give two reasons why a chi-square test is not appropriate for this data. Percentage Meeting Fitness Guidelines Year Men Women 2005 50.0 43.1 2010 59.0 48.5 2014 60.8 52.7
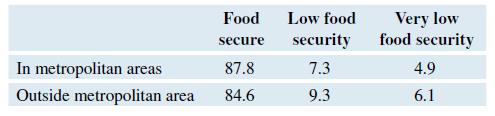
The table shows the percentage of all U.S. households who are food secure, have low food security, or who have very low food security. The data are reported by area of residence. Give two reasons why it would be inappropriate to do a chi-square test to determine if there is an association between
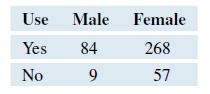
In a 2015 study reported in the Journal of American College Health, Cho et al. surveyed college students on their use of apps to monitor their exercise and fitness. The data are reported in the table. Test the hypothesis that fitness app use and gender are associated. Use a 0.05 significance
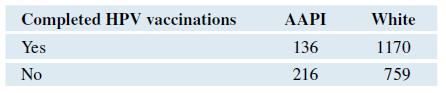
A vaccine is available to prevent the contraction of human papillomavirus (HPV). The Centers for Disease Control and Prevention recommends this vaccination for all young girls in two doses. In a 2015 study reported in the Journal of American College Health, Lee et al. studied vaccination rates
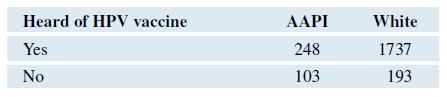
In the study described in 10.35 researchers also asked survey respondents if they had heard of the HPV vaccine. Data are shown in the table. Test the hypothesis that knowledge of the vaccine and race are associated. Use a 0.05 significance level. Heard of HPV vaccine AAPI White Yes 248 1737 No 103
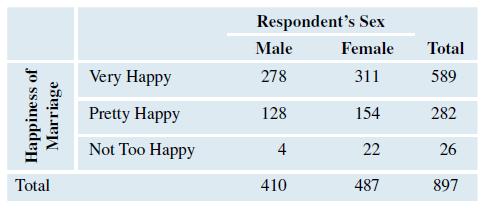
The table shows the results of a two-way table of gender and whether a person is happy in his or her marriage, according to data obtained from a General Social Survey. Happiness of Marriage : Respondent’s Sex Cross Tabulation Counta. If we carry out a test to determine whether these variables are
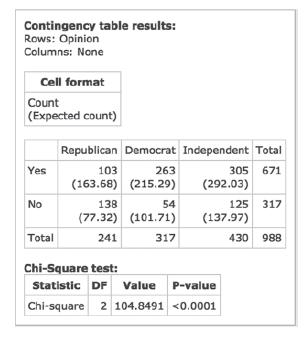
A 2018 Gallup poll asked respondents if they supported same-sex marriage. Results are reported by political party in the StatCrunch output that follows.a. Find the percentage in each political party who support same-sex marriage. Round off to one decimal place as needed.b. Test the hypothesis that
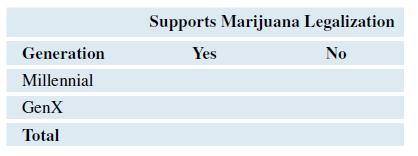
A 2018 Pew Research poll asked a random sample of Millennials and GenXers if they supported legalization of marijuana. Survey results found 70% of Millennials and 66% of GenXers supported marijuana legalization.a. Use these results to fill in the following two-way table with the counts in each
In a 2018 article published in The Lancet, Sprigg et al. studied the effect of tranexamic acid in treating patients with intracerebral hemorrhages using a randomized, placebo controlled trial. Of the 1161 subjects treated with tranexamic acid, 383 suffered an adverse outcome after 2 days. Of the
In a 2018 article published in The Lancet, Kappos et al. studied the effect of the drug siponimod in treating patients with secondary progressive multiple sclerosis (SPMS) using a double-blind, randomized, controlled study. Of the 1099 patients given the drug, 198 experienced a severe adverse
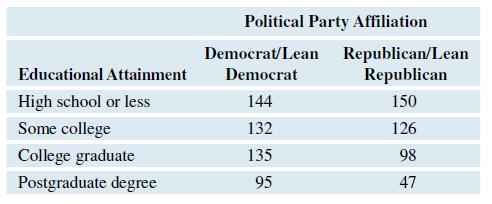
A 2018 Pew Research poll recorded respondents political affiliation and education attainment. A summary of the data is shown in the following table. Test the hypothesis that political party affiliation and educational attainment are associated at the 0.05 level. Political Party Affiliation
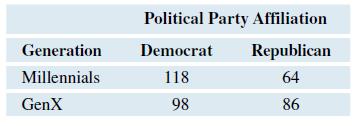
A 2018 Pew Research poll recorded respondents political affiliation and generation. A summary of the results for Millennials and GenXers are shown in the following table, assuming a sample size of 200. Test the hypothesis that political party affiliation and generation are associated at the 0.05
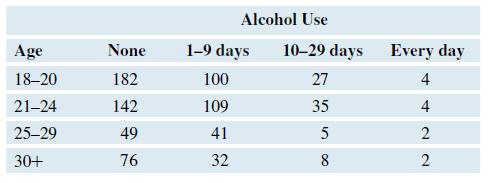
In a 2016 article published in the Journal of American College Health, Heller et al. surveyed a sample of students at an urban community college. Students’ ages and frequency of alcohol use per month are recorded in the following table. Because some of the expected counts are less than 5, we
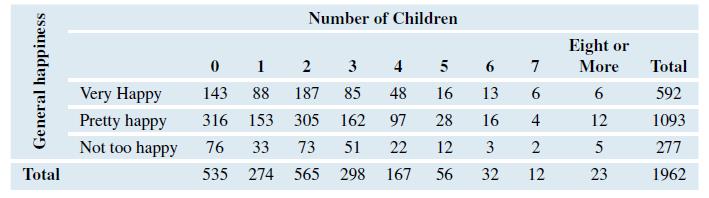
The data in the table come from a General Social Survey. The top row is the number of children reported for the respondents. The respondents also reported their level of happiness; Very H means Very Happy, and so on. The counts are shown in the table. Is happiness associated with having at least
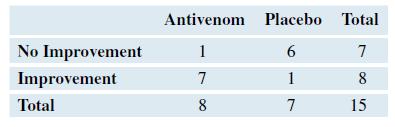
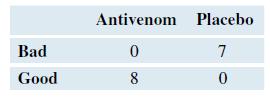
In a 2009 study reported in the New England Journal of Medicine, Boyer et al. randomly assigned children aged 6 months to 18 years who had nonlethal scorpion stings to receive an experimental antivenom or a placebo. “Good” results were no symptoms after four hours and no detectable plasma
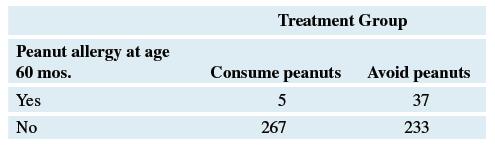
In a 2015 study reported in the New England Journal of Medicine, Du Toit et al. randomly assigned infants who were likely to develop a peanut allergy (as measured by having eczema, egg allergies, or both) to either consume or avoid peanuts until 60 months of age. The infants in this cohort did not
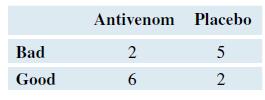
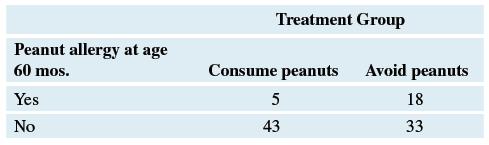
In the study described in exercise 10.55, researchers (Du Toits et al., 2015) also studied infants with eczema, egg allergies, or both who also had a preexisting sensitivity to peanut extract. These infants were also randomly assigned to either consume or avoid peanuts until 60 months of age. The
Suppose you have a random sample of firefighters in Illinois and want to determine if the racial distribution of the firefighters is different from the racial distribution of the state as a whole.
Suppose you know the class (first class, second class, third class, or steerage) and whether each person on the Titanic survived or died, for all passengers on the Titanic.
Suppose you take a random sample of students at a college, asking them their gender and in which of the following areas they are majoring: Fine Arts, Liberal Arts, Business, STEM (Science, Technology, Engineering, and Mathematics), Social Science or Other.
Suppose you randomly assign some parolees to check in once a week with their parole officers and others to check in once a month, and observe whether they are arrested within 6 months of starting parole.
Based on a random sample of residents in a large city, you wish to determine if there is an association between income level (low, middle, or high) and whether the residents own or rent their home.
Suppose you are testing two different injections by randomly assigning them to children who react badly to bee stings and go to the emergency room. You observe whether the children are substantially improved within an hour after the injection. However, one of the expected counts is less than 5.
Suppose you are interested in whether more than 50% of voters in California support a proposition (Prop X). After the vote, you find the total number that support it and the total number that oppose it.
Suppose there is a theory that 90% of the people in the United States dream in color. You survey a random sample of 200 people; 198 report that they dream in color, and 2 report that they do not. You wish to verify the claim made in the theory.
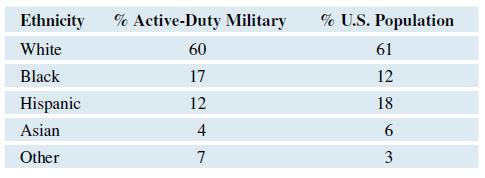
In 2017 the Pew Research Center published a report on the demographics of the U.S. military. The following table shows the ethnic breakdown of active-duty U.S. military services and the ethnic breakdown of the U.S. population. Would it be appropriate to use the data in the table to conduct a
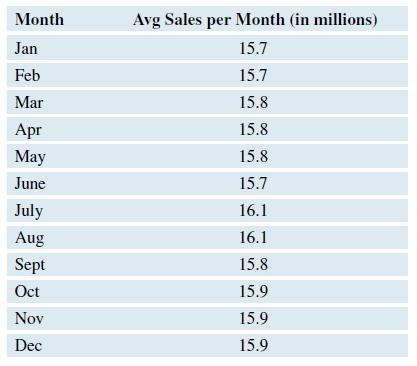
The following table shows the average number of vehicles sold in the United States monthly (in millions) for the years 2001 through 2018. Data on all monthly vehicle sales for these years were obtained and the average number per month was calculated. Would it be appropriate to do a chi-square
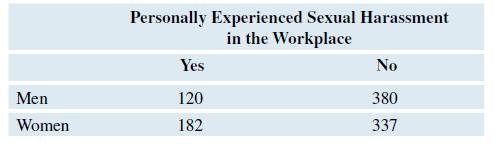
An 2017 NPR/Marist poll asked a random sample of Americans if they had personally experienced sexual harassment in the workplace. The results are shown in the following table.a. Find the percentage in each group who had personally experienced sexual harassment in the workplace.b. Test the
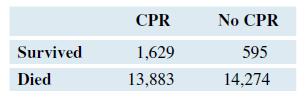
Three million people in Sweden are trained in CPR, which is more than 30% of the population. The data set is summarized below. A 2015 study by Hasselqvist-Ax et. al reported in the New England Journal of Medicine examined the relationship between bystander CPR (Cardio Pulmonary Resuscitation) and
Using your result from Exercise 7.107, solve for n by (1) dividing both sides of the equation by 2, (2) squaring both sides of the equation, (3) cross-multiplying, and (4) solving for n.
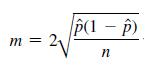
From Formula 7.2, an estimate for margin of error for a 95% confidence interval iswhere n is the required sample size and p̂ is the sample proportion. Since we do not know a value for p̂, we use a conservative estimate of 0.50 for p̂. Replace p̂ with 0.50 in the formula and simplify. P(1 – )
A polling agency wants to determine the sample size required to get a margin of error of no more than 3 percentage points (0.03). Assume the pollsters are using a 95% confidence level. How large a sample should they take?
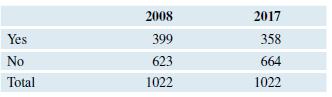
Has trust in the legislative branch of government declined? A Gallup poll asked U.S. adults if they trusted the legislative branch of government in 2008 and again in 2017. The results are shown in the table.a. Find and compare the sample proportion for those who trusted the legislative branch in
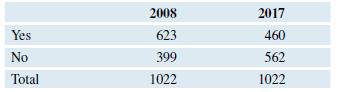
Has trust in the executive branch of government declined? A Gallup poll asked U.S. adults if they trusted the executive branch of government in 2008 and again in 2017. The results are shown in the table.a. Find and compare the sample proportion for those who trusted the executive branch in 2008 and
Suppose a political consultant is hired to determine if a school bond is likely to pass in a local election. The consultant randomly samples 250 likely voters and finds that 52% of the sample supports passing the bond. Construct a 95% confidence interval for the proportion of voters who support the
In the primaries leading up to the 2016 presidential election, the Business Insider reported that Bernie Sanders and Hilary Clinton were in a “statistical tie” in the polls leading up to the Vermont primary. Clinton led Sanders 43% to 35% in the polls, with a margin of error of 5.2%. Explain
In a 2018 survey conducted by Northeastern University, 28% of working adults with education levels less than a bachelor’s degree worried that their job would be eliminated due to new technology or automation. This was based on a 95% confidence interval with a margin of error of 3 percentage
In 2018 Gallup reported that 52% of Americans are dissatisfied with the quality of the environment in the United States. This was based on a 95% confidence interval with a margin of error of 4 percentage points. Assume the conditions for constructing the confidence interval are met.a. Report and
According to the Bureau of Labor Statistics, 71.9% of young women enroll in college directly after high school graduation. Suppose a random sample of 200 female high school graduates is selected and the proportion who enroll in college is obtained.a. What value should we expect for the sample
According to a Gallup poll, 45% of Americans actively seek out organic foods when shopping. Suppose a random sample of 500 Americans is selected and the proportion who actively seek out organic foods is recorded.a. What value should we expect for the sample proportion?b. What is the standard
Pew Research reported that 46% of Americans surveyed in 2016 got their news from local television. A similar survey conducted in 2017 found that 37% of Americans got their news from local television. Assume the sample size for each poll was 1200.a. Construct the 95% confidence interval for the
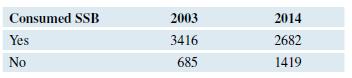
In 2017, the journal Obesity reported on trends in sugar-sweetened beverage (SSB) consumption. A random sample of youths aged 12 to 19 years old were asked to monitor all food and beverages consumed in a 24-hour period. The study was done in 2003 and repeated in 2014. The numbers who consumed a
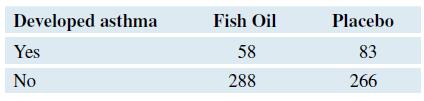
A double-blind study using random assignment was done of pregnant women in Denmark. Women were given fish oil or a placebo during pregnancy. Their children were followed during the first 5 years of life to see if they developed asthma. The results are summarized in the table. (Bisgaard et al.,
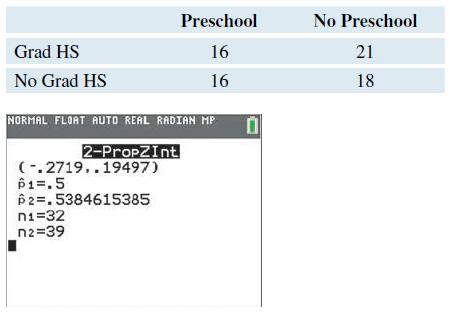
Refer to Exercise 7.77 for information. This data set records results just for the boys.a. Find and compare the percentages that graduated for each group, descriptively. Does this suggest that preschool was linked with a higher graduation rate?b. Verify that the conditions for a two-proportion
In 2016 and 2017 Gallup asked American adults about their amount of trust they had in the judicial branch of government. In 2016, 61% expressed a fair amount or great deal of trust in the judiciary. In 2017, 68% of Americans felt this way. These percentages are based on samples of 1022 American
In 2003 and 2017 Gallup asked Democratic voters about their views on the FBI. In 2003, 44% thought the FBI did a good or excellent job. In 2017, 69% of Democratic voters felt this way. Assume these percentages are based on samples of 1200 Democratic voters.a. Can we conclude, on the basis of these
A Harris poll asked a sample of U.S. adults if they agreed with the statement “Artificial intelligence will widen the gap between the rich and poor in the U.S.” Of those aged 18 to 35, 69% agreed with the statement. Of those aged 36 to 50, 60% agreed with the statement. A 95% confidence
A Harris poll asked Americans in 2016 and 2017 if they were happy. In 2016, 31% reported being happy and in 2017, 33% reported being happy. Assume the sample size for each poll was 1000. A 95% confidence interval for the difference in these proportions p1 - p2 (where proportion 1 is proportion
In the 2018 study Closing the STEM Gap, researchers wanted to estimate the percentage of middle school girls who planned to major in a STEM field.a. If a 95% confidence level is used, how many people should be included in the survey if the researchers wanted to have a margin of error of 3%?b. How
Pew Research conducted a study in 2018 to estimate the percentage of Americans who do not use the Internet.a. If a 95% confidence level is used, how many people should be included in the survey if the researchers wanted to have a margin of error of 6%?b. How would the sample size change if the
Of 1019 U.S. adults responding to a 2017 Harris poll, 47% said they always or often read nutrition labels when grocery shopping.a. Construct a 95% confidence interval for the population proportion of U.S. adults who always or often read nutrition labels when grocery shopping.b. What is the width of
Showing 200 - 300
of 710
1
2
3
4
5
6
7
8
Step by Step Answers