New Semester
Started
Get
50% OFF
Study Help!
--h --m --s
Claim Now
Question Answers
Textbooks
Find textbooks, questions and answers
Oops, something went wrong!
Change your search query and then try again
S
Books
FREE
Study Help
Expert Questions
Accounting
General Management
Mathematics
Finance
Organizational Behaviour
Law
Physics
Operating System
Management Leadership
Sociology
Programming
Marketing
Database
Computer Network
Economics
Textbooks Solutions
Accounting
Managerial Accounting
Management Leadership
Cost Accounting
Statistics
Business Law
Corporate Finance
Finance
Economics
Auditing
Tutors
Online Tutors
Find a Tutor
Hire a Tutor
Become a Tutor
AI Tutor
AI Study Planner
NEW
Sell Books
Search
Search
Sign In
Register
study help
mathematics
introductory statistics exploring the world through data
Introductory Statistics Exploring The World Through Data 3rd Edition Robert Gould, Rebecca Wong, Colleen N. Ryan - Solutions
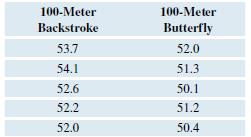
The table shows the 100-meter backstroke and the 100-meter butterfly gold medal Olympic times (in seconds) for five recent Olympics. 100-Meter 100-Meter Backstroke Butterfly 53.7 52.0 54.1 51.3 52.6 50.1 52.2 51.2 52.0 50.4
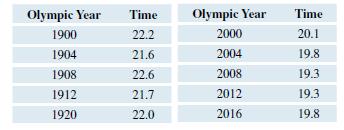
The table show the gold medal Olympic times (in seconds) for the 200-meter run. Data are shown for the first five Olympics of the 1900s and five more recent Olympics in the 2000s. (Source: World Almanac and Book of Facts 2017)a. Find and interpret (report in context) the mean and standard deviation
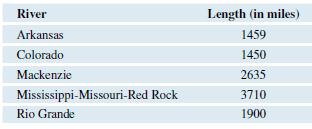
The table shows the lengths (in miles) of major rivers in North America. (Source: World Almanac and Book of Facts 2017)a. Find and interpret (report in context) the mean, rounding to the nearest tenth mile. Be sure to include units for your answer.b. Find the standard deviation, rounding to the
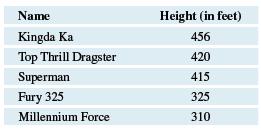
The table shows the names and heights of some of the tallest roller coasters in the United States. (Source: Today.com)a. Find and interpret (report in context) the mean height of these roller coasters.b. Find and interpret the standard deviation of the height of these roller coasters.c. If the
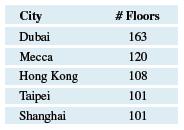
The table shows the location and number of floors in some of the tallest buildings in the world. (Source: Infoplease.com)a. Find and interpret (report in context) the mean number of floors in this data set.b. Find and interpret the standard deviation of the number of floors in this data set.c.
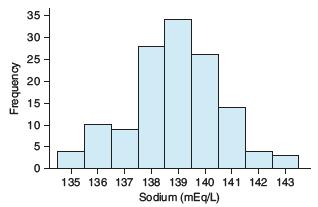
The following histogram shows the sodium level for 132 people (from the National Health and Nutrition Examination Survey [NHANES]). The units are milliequivalents per liter. Without calculating, give the approximate mean of this distribution. 35 30 - 25 - 20 - 15 10 - 5- 135 136 137 138 139 140 141
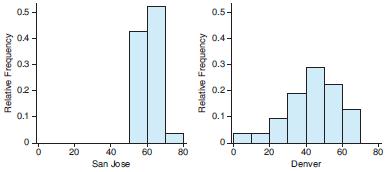
The histograms below were created from data on the daily high temperature in San Jose and Denver during a winter month. Compare the two distributions. Which city do you think has the higher typical temperature? Which city has more variation in temperature? Explain. (Source: Accuweather.com) 0.5
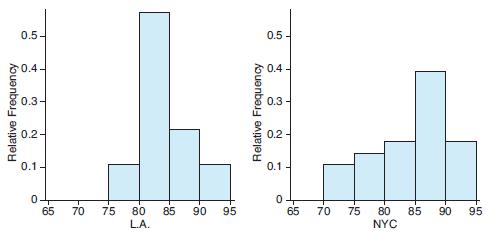
The histograms below were created from data on the daily high temperature in Los Angeles and New York City during a summer month. Compare the two distributions. Which city do you think has the higher typical temperature? Which city has more variation in temperature? Explain. (Source:
The mean weight gain for women during a full-term pregnancy is 30.2 pounds. The standard deviation of weight gain for this group is 9.9 pounds, and the shape of the distribution of weight gains is symmetric and unimodal. a. State the weight gain for women one standard deviation below the mean
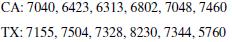
The tuition costs (in dollars) for a sample of four-year state colleges in California and Texas are shown below. Compare the means and the standard deviations of the data and compare the state tuition costs of the two states in a sentence or two. (Source: calstate.edu, texastribune.com) CA: 7040,
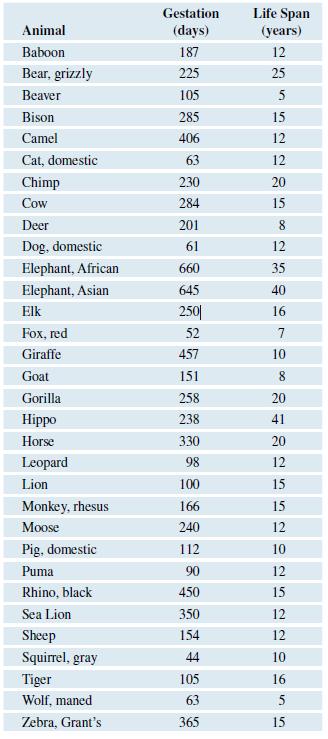
The following table in Exercise 2.30 shows the average life span for some mammals in years, according to info please. com. Graph these average life spans and describe the distribution. What is a typical life span? Identify the three outliers and report their life spans. If you were to include
Babies 6 to 23 months of age with inner ear infections were given antibiotics. The children were randomly assigned to receive antibiotics for a full 10 days or to receive antibiotics for 5 days and then a placebo for 5 days. There were 229 children assigned the shorter course, and 77 of them had
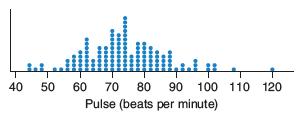
The dotplot shown is for resting pulse rates of 125 people (according to NHANES, National Health and Nutrition Examination Survey).Many sources say the resting pulse should not be more than 100.a. How many of the 125 people had resting pulse rates of more than 100?b. What percentage of people had
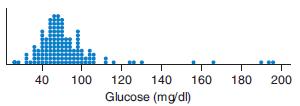
A dotplot of the glucose readings from 132 people (from NHANES) is shown. Some doctors recommend that glucose readings not be above 120 mg/dl.a. How many of these people have glucose readings above 120 mg/dl?b. What percentage of these people have glucose readings above 120 mg/dl? 40 100 120 140
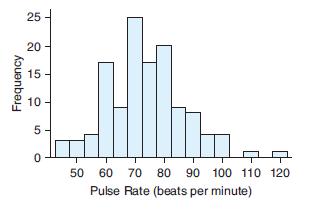
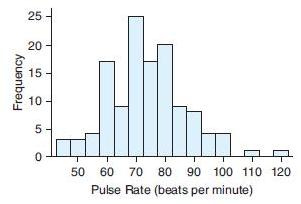
The histogram shown is for pulse rates for 125 people. Convert the vertical axis to relative frequency and show the value that would replace each of the values on the vertical axis. 25 20 - 15 - 10 5- 50 60 70 80 90 100 110 120 Pulse Rate (beats per minute) Frequency
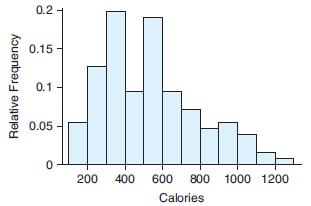
The histogram shown is for number of calories in a sample of fast-food items.a. What is the bin width of the histogram?b. Would this graph be best described as unimodal or bimodal?c. Approximately what percentage of the fast-food items contained fewer than 300 calories? 0.2 - 0.15 - 0.1 - 0.05 200
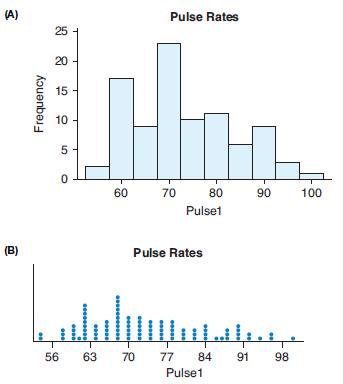
The resting pulse rates (in beats per minute) of a sample of 91 undergraduate students were recorded. The data are displayed in the following histogram and dotplots. Based on these graphs, would you consider a resting pulse rate of 90 beats per minutes to be unusually high? Why or why not? (A)
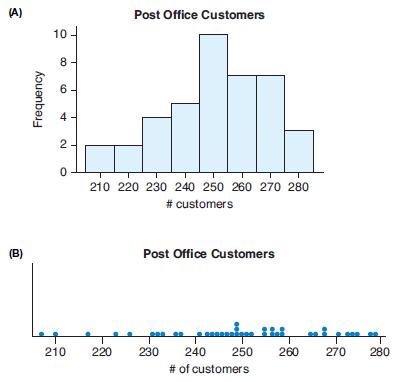
A post office branch recorded the number of customers served per day for a period of time. The data are displayed in the following histogram and dotplot. Based on these graphs, would it be unusual for this branch to serve 250 customers in a day? Why or why not? (A) Post Office Customers 10 8- 6 210
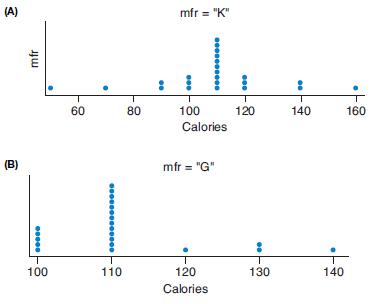
The following dotplots show the number of calories in a sample of cereals from two manufacturers: “G” = General Mills and “K” = Kelloggs.a. Write a few short sentences that compare the center and the spread for each dotplot.b. Based on this sample, cereals from which manufacturer tend to
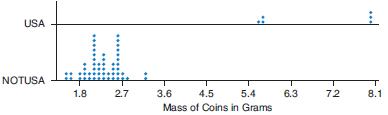
The weights of coins (in grams) were obtained for coins in the United States and coins for other countries (including Mexico, Brazil, Canada, and several in Europe). a. Write a few sentences to compare the distributions of weights of coins from the United States with those from other
An instructor asks a class of 120 students how many hours they slept during the previous night. What shape do you think this distribution will have? Explain.
A group of 80 drivers in a large city is asked for the number of parking tickets they received in the previous month. What shape do you think this distribution will have? Explain.
From the histogram in Exercise 2.3, approximately what is the typical pulse rate in this sample?Data from Exercise 2.3, The histogram shown is for pulse rates for 125 people. Convert the vertical axis to relative frequency and show the value that would replace each of the values on the
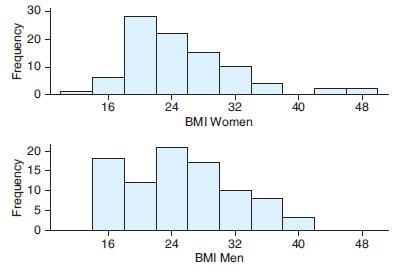
The histograms show the Body Mass Index for 90 females and 89 males according to NHANES. Compare the distributions of BMIs for women and men. Be sure to compare the shapes, the centers, and the amount of variation for the two groups. 30 20 10 16 24 32 40 48 BMI Women 20 15 10 - 5- 16 24 32 40 48
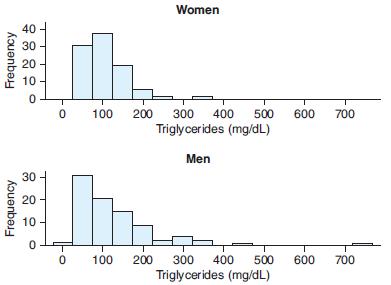
The histograms show triglyceride levels for 87 men and 99 women. Triglycerides are a form of fat found in blood.a. Compare the distributions of triglyceride levels for men and women. (Be sure to compare the shapes, the centers, and the spreads.)b. Triglyceride levels under 150 are good; levels
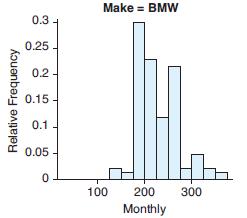
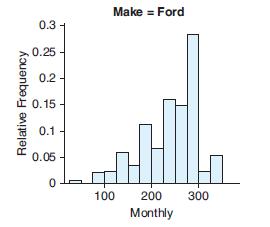
The histograms show the monthly costs for operating two makes of cars: Ford and BMW. Which make typically has higher monthly costs? Which make has more variation in costs? Make = BMW 0.3 0.25 0.2- 0.15 - 0.1 0.05 100 200 300 Monthly Relative Frequency
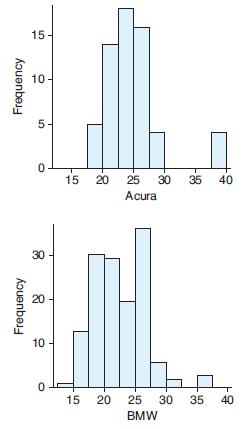
The histograms show the miles per gallon (mpg) for two makes of cars: Acura and BMW. Compare the distributions. Which make has a higher mpg? Which make has more variation in mpg? (Source: Edmonds.com) 15 10 5- 15 20 25 30 35 40 Acura 30 20 10 15 20 25 30 35 40 BMW Frequency Frequency
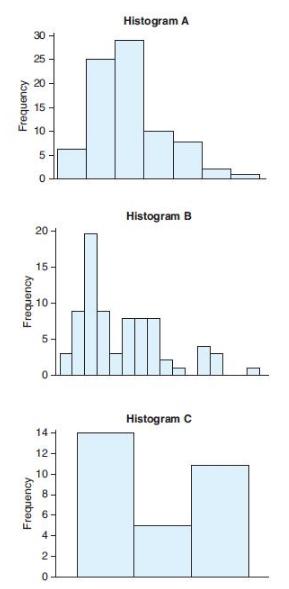
Match each of the three histograms to the correct situation.1. Assessed value of a representative collection of houses in a city2. Number of bedrooms in the houses3. Height of house (in stories) for houses in a region that allows up to three stories but not more. Histogram A 30 25 20 15 10
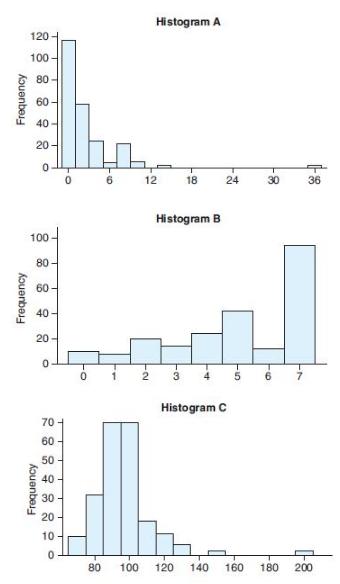
Match each histogram given with the following descriptions of data.1. Number of cups of coffee consumed by one person during a day.2. Maximum speed driven in a car by college students who drive.3. Number of times last week that a college student had breakfast. Histogram A 120 100 - 80 60 - 40 20 6.
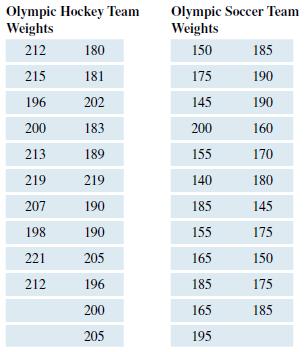
The weights of Olympic hockey players and soccer players from recent Olympic games (in pounds) are shown in the following two tables. Make appropriate graphs and use your graphs to write a brief comparison of the distributions of the players’ weights. Pose a statistical question that can be
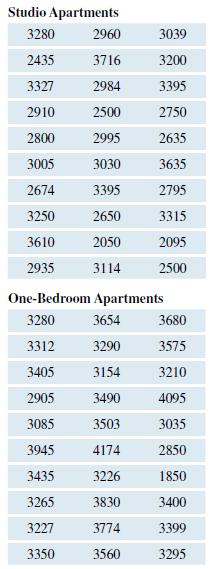
The data show monthly rents for studio and one-bedroom apartments in San Francisco. Write a statistical question appropriate for these data and a brief comparison of the distribution of rents for these two types of housing units. Include appropriate graphics. Studio Apartments 3280 2960 3039
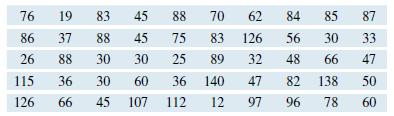
The table shows prices of 50 college textbooks in a community college bookstore, rounded to the nearest dollar. Make an appropriate graph of the distribution of the data, pose a statistical question, and describe the distribution. 76 19 83 45 88 70 62 84 85 87 86 37 88 45 75 83 126 56 30 33 26 88
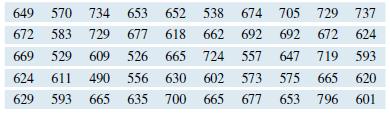
The following table shows a random sample of 50 quantitative SAT scores of first-year students admitted at a university. Make an appropriate graph of the distribution of the data, pose a statistical question, and describe the distribution. 649 570 734 653 652 538 674 705 729 737 672 583 729 677 618
A StatCrunch survey asked people what they thought the maximum income tax rate should be in the United States. Make separate dot-plots of the responses from Republicans and Democrats. If possible, put one above the other, using the same horizontal axis. Then compare the groups by commenting on the
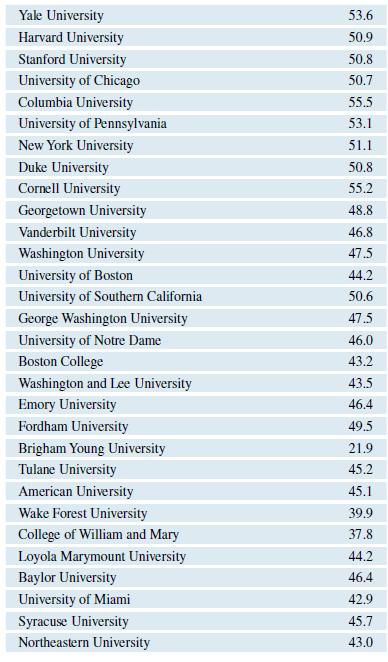
Data are shown for the cost of one year of law school at 30 of the top law schools in the United States in 2013. The numbers are in thousands of dollars. Make a histogram of the costs, pose a statistical question, and describe the distribution. If there are any outliers, identify the
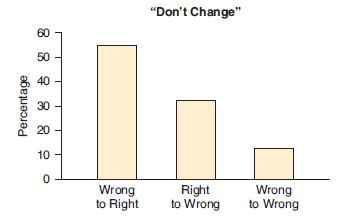
One of the authors wanted to determine the effect of changing answers on multiple-choice tests. She studied the tests given by another professor, who had told his students before their exams that if they had doubts about an answer they had written, they would be better off not changing their
Suppose a group of school-aged children is asked, “Which of these three ice cream flavors do you like the most: vanilla, chocolate, or strawberry?” Describe a bar graph of their responses that would have the least amount of variability. Also describe a bar graph that would have the most
Applicants to California community colleges are asked to indicate one of these education goals at the time of application: transfer to a four-year institution, an AA degree, a CTE certificate, job retraining, or personal enrichment. In a group of 500 applications, describe a bar graph of these data
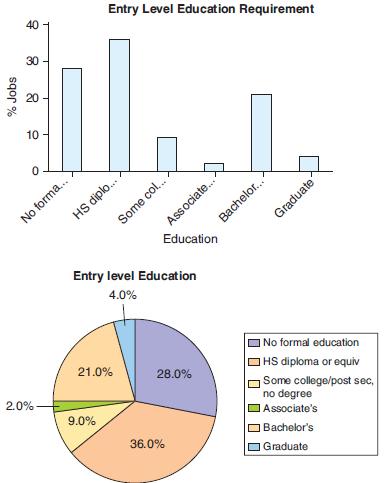
The Bureau of Labor Statistics tracks data on the percentage of jobs that require various levels of education. The 2016 Entry Level Education data are displayed in the following bar chart and pie chart.a. Approximately what percentage of jobs require some type of college degree (Associate’s,
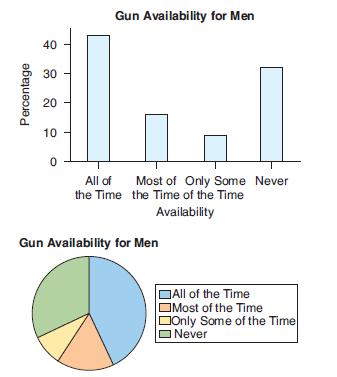
Pew Research conducted a survey in 2017 asking gun owners what percentage of time they had a loaded gun easily within reach when at home. The results for male gun owners are displayed in a bar chart and a pie chart. a. Which period was the most frequent response?b. Use the graphs to estimate
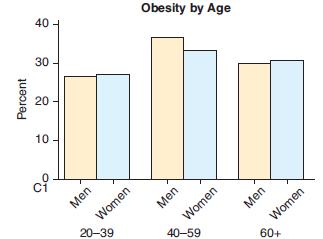
Data on obesity rates for adults in the United States are displayed in the bar plot for three age groups.a. Which age group typically has the highest rate of obesity?b. Comment on any similarities and differences in the obesity rates of men and women. 40 - Obesity by Age 30 20 - 10 - Men Women
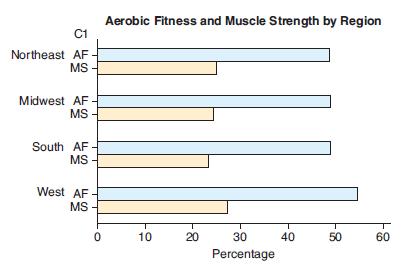
Data on the percentage of adults living in the United States who meet the federal aerobic fitness (AF) and muscle-strengthening (MS) standards are displayed in the bar plot. a. Comment on the fitness similarities and differences in these four regions.b. Comment on the similarities and
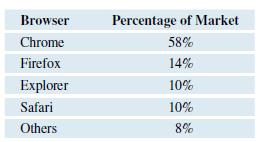
The following table gives the percent of the market controlled by the most popular Internet browsers in 2016. Sketch or otherwise create an appropriate graph of the distribution and comment on its important features. Browser Percentage of Market Chrome 58% Firefox 14% Explorer 10% Safari 10% Others
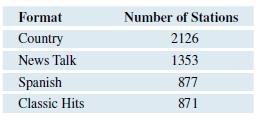
The following table gives the number of commercial U.S. radio stations for the four most popular formats. Sketch or otherwise create an appropriate graph of the distribution and comment on its important features. Format Number of Stations Country 2126 News Talk 1353 Spanish 877 Classic Hits
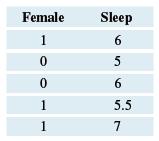
The following table shows the first few entries for the number of hours of sleep in one night for a sample of college students. The data are stacked and coded, where 0 represents a male student and 1 represents a female student. What would be appropriate graphs to compare the distributions of hours
The following table shows the first few entries for the majors of a sample of college students. The data are stacked and coded, where 0 represents a female student and 1 represents a male student. What would be appropriate graphs to compare the distribution of majors for male and female students if
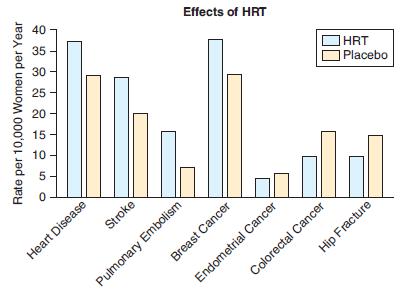
The use of the drug Prempro, a combination of two female hormones that many women take after menopause, is called hormone replacement therapy (HRT). In July 2002, a medical article reported the results of a study that was done to determine the effects of Prempro on many diseases. Writing Group for
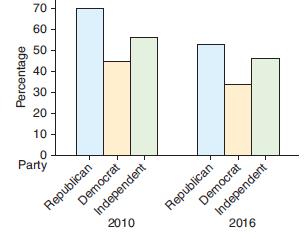
People were asked whether they favored nuclear energy in 2010 and in 2016. The data were sorted by political affiliation and are shown in the following bar graph. a. How have opinions on nuclear energy changed from 2010 to 2016?b. Which political party showed the most change in opinion on
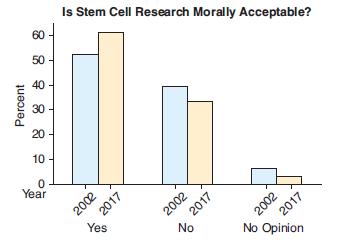
People were asked whether they thought stem cell research was morally acceptable. The graph shows the results of two surveys, one done in 2002 and one done on 2017. What does the graph tell us about changes in opinions about stem cell research? Explain. Is Stem Cell Research Morally Acceptable? 60
Predict the shape of the distribution of the salaries of 25 chief executive officers (CEOs). A typical value is about 50 million per year, but there is an outlier at about 200 million.
A physician asks all of his patients to report the approximate number of cigarettes they smoke in a day. Predict the shape of the distribution of number of cigarettes smoked per day.
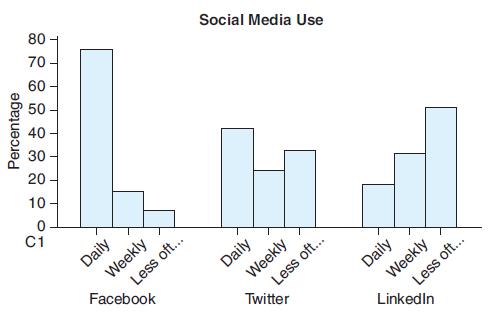
The Pew Research Center documents the variety of ways in which Americans use social media. The bar chart shows the frequency of use for three social media sites among adult social media users.a. Which site is used most regularly by social media users? Explain.b. Which site is used least regularly
For each situation, describe the type of statistical graph that could be made to answer the statistical question posted.a. We have the systolic blood pressures by gender of a large number of elderly people. Our statistical question is, “What percentage of these people have blood pressure over 130
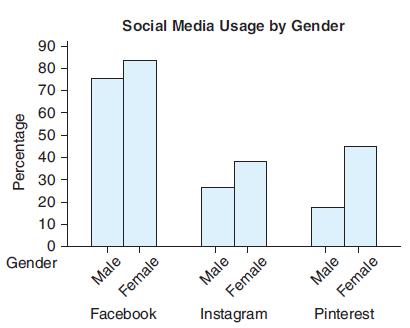
The Pew Research Center gathered data in 2018 on American social media use by gender. The bar graph shows the percentage of Internet users who use these social media platforms.a. Of these three social media sites, which is most frequently used by men? By women?b. Comment on the similarities and
For each situation, describe the type of statistical graph that could be made to answer the statistical question posted:a. We have the systolic blood pressures by gender of a large number of elderly people. Our statistical question is, “Do these elderly men tend to have higher systolic blood
A study was conducted to assess whether 5 weeks of training with virtual reality (VR) can reduce the risk of falls in adults. Thirty-four older adults underwent 15 VR training sessions consisting of walking on a treadmill with a VR simulation. At the end of the VR training program, participants
Some studies have indicated that neurofeedback may be an effective treatment for ADHD. Read excerpts from the research published in The Lancet Psychiatry and answer the questions that follow. (Source: Schönenberg et al., “Neurofeedback, sham neurofeedback, and cognitive-behavioral group therapy
Can mindful yoga have a beneficial impact on alcohol use in high-risk adolescents? Read excerpts from the research published in The Journal of Child and Family Studies and answer the questions that follow. (Fishbein et al., “Behavioral and psychophysiological effects of a yoga intervention on
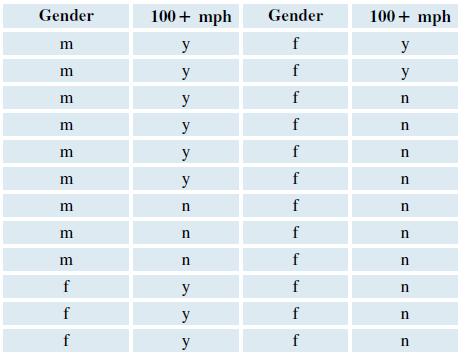
College students who were drivers were asked if they had ever driven a car 100 mph or more (yes or no). The results are shown in the table, along with gender. a. There are two variables in the table, state what they are and whether each is categorical or numerical. b. Make a two-way table
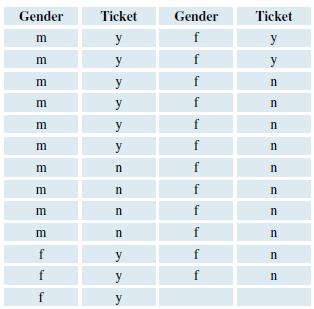
College students who were drivers were asked if they had ever received a speeding ticket (yes or no). The results are shown in the table, along with gender.a. There are two variables in the table, state what they are and whether each is categorical or numerical. b. Make a two-way table of the
The August 27, 2017, issue of Science Daily reported that higher coffee consumption is associated with a lower risk of death. This was based on an observational study of nearly 20,000 participants. Researchers found that participants who consumed at least 4 cups of coffee per day had a 64% lower
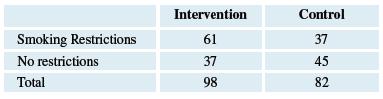
Researchers wanted to assess whether a theory-based, community health worker–delivered intervention for household smokers will lead to reduced secondhand smoke exposure to children in Chinese families. Smoking parents or caregivers who had a child aged 5 years or younger at home were randomly
The September 2017 issue of Alzheimer’s and Dementia reported on a study that found an association between drinking sugary drinks and lower brain volume. Is this likely to be a conclusion from observational studies or randomized experiments? Can we conclude that drinking sugary beverages causes
The Harvard Heart Letter reported on a study that examined the diets of 1226 older women over 15 years. They discovered that the more vegetables the women consumed, the lower their risk of dying of cardiovascular disease. From this study can we conclude that eating a diet high in vegetables
A study was conducted to see whether participants would ignore a sign that said, “Elevator may stick between floors. Use the stairs.” The study was done at a university dorm on the ground floor of a three-level building. Those who used the stairs were said to be compliant, and those who used
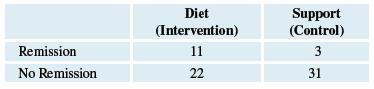
An article in the journal BMC Medicine reported on a study designed to study the effect of diet on depression. Subjects suffering from moderate to severe depression were randomly assigned to one of two groups: a diet intervention group and a social support control group. The 33 subjects in the diet
Cartilage is a smooth, rubber-like padding that protects the long bones in the body at the joints. A study by Lu et. al. in Arthritis Care & Research found that women who drank one glass of milk daily had 32% thicker, healthier cartilage than women who did not. Researchers obtained information
An article in the Journal of the Academy of Nutrition and Dietetics reported on a study of diet in subjects with moderate to severe acne. Read the excerpts from the abstract and answer the questions that follow. (Burris et al., “Differences in dietary glycemic load and hormones in New York City
The New England Journal of Medicine reported on a study of fish oil consumption in pregnant mothers and the subsequent development of asthma in their children. Read the excerpts from the abstract and answer the questions that follow: (Bisgaard et al., “Fish oil–derived fatty acids in pregnancy
A study reported by Griffin et al. compared the rate of pneumonia between 1997 and 1999 before pneumonia vaccine (PCV7) was introduced and between 2007 and 2009 after pneumonia vaccine was introduced. Read the excerpts from the abstract, and answer the question that follows it. (Source: Griffin et
In a 2017 study designed to investigate the effects of exercise on second language learning, 40 subjects were randomly assigned to one of two conditions: an experimental group that engaged in simultaneous physical activity while learning vocabulary in a second language and a control group that
A doctor who believes strongly that antidepressants work better than “talk therapy” tests depressed patients by treating half of them with antidepressants and the other half with talk therapy. After six months the patients are evaluated on a scale of 1 to 5, with 5 indicating the greatest
You can find many testimonials on the Internet that drinking aloe vera juice helps with digestive ailments. From these testimonials can we conclude that aloe vera juice causes digestive problems to go away? Why or why not?
The blog NHS Choices (February 10, 2014) noted that “there has been increasing anecdotal evidence that vitamin C may still be useful as an anticancer medicine if used in high concentrations and given directly into the vein (intravenously).” Explain what it means that there is “increasing
Patients with multiple sclerosis are randomly assigned a new drug or a placebo and are then given a test of coordination after six months.
Patients with high blood pressure are asked to keep food diaries recording all items they eat for a one-week period. Researchers analyze the food diary data for trends.
In 2015, the National Highway Traffic Safety Administration reported the number of pedestrian fatalities in San Francisco County was 24 and that the number in Los Angeles County was 209. Can we conclude that pedestrians are safer in San Francisco than in Los Angeles? Why or why not? If you answered
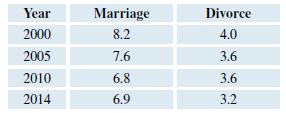
The marriage and divorce rates are given per 1000 people in various years. Find the divorce rate as a percentage of the marriage rate and comment on the trend over time. Year Marriage Divorce 2000 8.2 4.0 2005 7.6 3.6 2010 6.8 3.6 2014 6.9 3.2
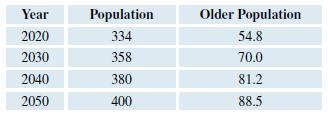
The projected U.S. population is given for different decades. The projected number of people 65 years of age or older is also given. Find the percentage of people 65 or over and comment on the trend over time. Numbers are in millions of people (Source: 2017 World Almanac and Book of Facts) Year
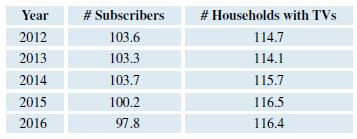
The accompanying table gives the number of cable television subscribers (in millions) and the number of households with televisions (in millions) in the United States. Find the percentage of TV owners with cable subscriptions for each year and comment on the trend over time. (Source: 2017 World
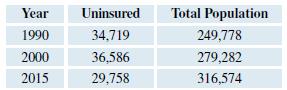
The accompanying table gives the population (in hundred thousands) and number of people not covered by health insurance (in hundred thousands) for the United States. Find the percentage of people not covered by health insurance for each of the given years and describe the trend. Year
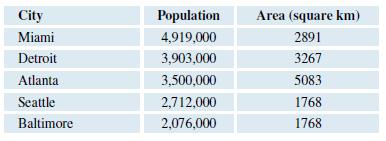
The accompanying table gives the 2018 population and area (in square kilometers) of five U.S. cities. See page 39 for guidance. (Source: www.citymayors.com).a. Determine and report the ranking of the population density (people per square kilometer) by dividing the population of each city by its
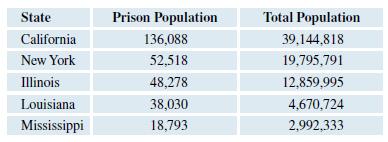
The table gives the prison population and total population for a sample of states in 2014–15. (Source: The 2017 World Almanac and Book of Facts)Find the number of people in prison per thousand residents in each state and rank each state from the highest rate (rank 1) to the lowest rank (rank 6).
The 2017 World Almanac and Book of Facts reported that in 2016, M&Ms had sales of approximately $3.48 million and that this accounted for 12.95% of the total chocolate candy sales. What was the total amount of chocolate candy sales?
The 2017 World Almanac and Book of Facts reported that the U.S. occupation projected to grow the most is personal care aide. By 2024 there will be a need for 160,328 personal care aides, a growth of about 26% over 2014 levels. How many personal care aides were there in 2014?
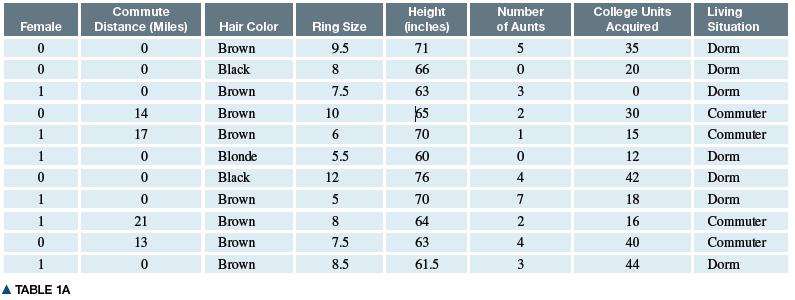
Make a two-way table from Table 1 for gender and hair color. Put the labels Male and Female across the top and Brown, Black, Blonde, and Red and then tally the data.a. Report how many are in each cell.b. Find the sums of each row and column and the grand total and put them into your table.c. What
Make a two-way table from Table 1A for gender and living situation. Put the labels Male and Female across the top and Dorm and Commuter on the side and then tally the data. a. Report how many are in each cell.b. Find the sums for each column and row and the grand total and put them into your table.
Find the frequency, proportion, and percentage of brown-haired people in Table 1A on page 31. College Units Acquired Commute Height (inches) Number Living Female Distance (Miles) Hair Color Ring Size of Aunts Situation Brown 9.5 71 5 35 Dorm Black 8. 66 20 Dorm 1 Brown 7.5 63 3 Dorm 0. 14 Brown 10
Find the frequency, proportion, and percentage of women in Table 1A on page 31. College Units Acquired Commute Height (inches) Number Living Female Distance (Miles) Hair Color Ring Size of Aunts Situation Brown 9.5 71 5 35 Dorm Black 8. 66 20 Dorm 1 Brown 7.5 63 3 Dorm 0. 14 Brown 10 2 30 Commuter
a. A hospital employs 346 nurses, and 35% of them are male. How many male nurses are there?b. An engineering firm employs 178 engineers, and 112 of them are male. What percentage of these engineers are female?c. A large law firm is made up of 65% male lawyers, or 169 male lawyers. What is the total
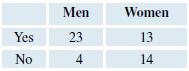
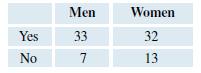
A survey was done of men’s and women’s hands to see if the ring finger appeared longer than the index finger or not. Yes means the ring finger is longer, and No means the ring finger appears shorter or the same length as the index finger. The students in this survey were told the theory that
A survey was done of men’s and women’s hands to see if the ring finger appeared longer than the index finger or not. Yes means the ring finger is longer, and No means the ring finger appears shorter or the same length as the index finger. The students in this survey were not told the theory
Suppose a surfer wanted to learn if surfing during a certain time of day made one less likely to be attacked by a shark. Using the Shark Attacks Worldwide data set, which variables could the surfer use in order to answer this question?
A data set on Shark Attacks Worldwide posted on StatCrunch records data on all shark attacks in recorded history including attacks before 1800. Variables contained in the data include time of attack, date, location, activity the victim was engaged in when attacked, type of injuries sustained by the
Suppose you wanted to know whether ring size and height were associated. Could you do that with this data table? If so, which variables would you use?
Suppose you wanted to know whether living situation was associated with number of hours of study per week. Could you do that with this data table? If so, which variables would you use?
Suppose you wanted to know whether the men or the women tended to be taller. Could you do that with this data table? If so, which variables would you use?
Suppose you wanted to know whether living situation was associated with number of units the student had acquired. Could you do that with this data table? If so, which variables would you use?
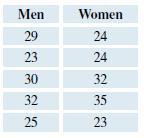
A student did a survey on the age of marriage for married male and female students.a. Is the format of the data set stacked or unstacked?b. If you answered “stacked” then unstack the data into two columns. If you answered “unstacked” then stack the data into one column; choose an
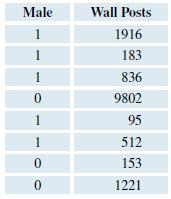
A student shared data from the StatCrunch Friend Data Application. Data on gender and number of wall posts for a sample of friends are shown below. (Source: StatCrunch, Facebook Friend Data, posted 2/13/14) a. Is the format of this data set stacked or unstacked?b. Explain the coding. What do 1
Showing 600 - 700
of 710
1
2
3
4
5
6
7
8
Step by Step Answers