New Semester
Started
Get
50% OFF
Study Help!
--h --m --s
Claim Now
Question Answers
Textbooks
Find textbooks, questions and answers
Oops, something went wrong!
Change your search query and then try again
S
Books
FREE
Study Help
Expert Questions
Accounting
General Management
Mathematics
Finance
Organizational Behaviour
Law
Physics
Operating System
Management Leadership
Sociology
Programming
Marketing
Database
Computer Network
Economics
Textbooks Solutions
Accounting
Managerial Accounting
Management Leadership
Cost Accounting
Statistics
Business Law
Corporate Finance
Finance
Economics
Auditing
Tutors
Online Tutors
Find a Tutor
Hire a Tutor
Become a Tutor
AI Tutor
AI Study Planner
NEW
Sell Books
Search
Search
Sign In
Register
study help
mathematics
using interpreting statistics
Using And Interpreting Statistics 2nd Edition Eric W. Corty - Solutions
Given this matrix, how many degrees of freedom are there for this chi-square goodness of- fit test?
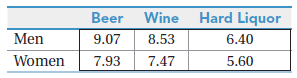
An addictions researcher wants to see if male and female alcoholics differ in the type of alcohol they consume. She goes to a large alcohol detox facility, gets a sample of men and a sample of women, and checks each person€™s chart to find the beverage of choice. She classifies the
A sociologist planned to study patterns of criminality in small towns. She drew a random sample of 50 small towns from all across America. Before conducting her study, she wanted to make sure that her sample was representative of small towns. From the FBI, she learned that 2% of small towns have
A statistics teacher looked out at her class of 32 students and noted that 21 of them were female. Assuming there are equal numbers of males and females in the world, what test should this teacher use to see if her class is overpopulated with women?
A social psychologist assigned ranks to all the second-grade boys in a school based on how much the other boys liked them. He then did the same thing for all the boys again, but based the ranks on how much the girls liked them. What test should the psychologist conduct to see if there’s an
The principal also kept track of how many burps each student produced. For both the caffeinated and noncaffeinated groups, the number of burps was extremely positively skewed. What statistical test should he use to see if the number of burps differs between the two groups?
A high school principal developed a theory that caffeinated sodas cause more burping than noncaffeinated sodas. She obtained a large sample of students and randomly assigned them to drink sodas with or without caffeine. She then waited 15 minutes and classified each student as having burped or not
The Mann–Whitney U test compares the ranks of the cases in one ____ to the ____ of the cases in the other sample.
The Mann–Whitney U test takes two independent ____, combines them into one ____, and then assigns a ____ to each case in the combined group.
The ____ is the nonparametric alternative to the independent-samples t test.
In a Spearman rank-order correlation coefficient, the ____ of the two variables are correlated.
The expected frequencies for the rows in a chi-square test of independence are the same as the observed frequencies for the ____.
The row percentages in a chi-square test of independence add up to ____%.
The formula for the chi-square test of independence is the same as / differs from the formula for the chi-square goodness-of-fit test.
The degrees of freedom for a chi-square test of independence depend on the number of ____ and the number of ____.
The hypotheses for a chi-square test of independence are stated the same way as they are for a ____.
The null hypothesis for the chi-square test of independence states that the ____ and the ____ are ____.
The assumptions for the chi-square test of independence are the same as for the ____.
In a contingency table, each ____ is placed in one, and only one, ____.
To conduct a chi-square test of independence, construct a ____ table that cross-tabulates the values of the ____ with the levels of the ____.
The chi-square test of independence can be conceptualized as a ____ test or a ____ test.
The chi-square test of independence differs from the chi-square goodness-of-fit test in terms of the number of ____ in the test.
The direction of the results for a chi-square goodness-of-fit test needs to be determined if the results are ____.
In APA format, if the results are written “p > .05,” this means the results fell in the ____ zone.
In APA format for a chi-square goodness-of-fit test, the first number inside the parentheses represents the ____.
The first step in calculating a chi-square is to ____ the expected frequencies from the ____.
The expected frequencies in a chi-square goodness-of-fit test add up to ____.
It is impossible / possible for expected frequencies in a chi-square goodness-of-fit test to be fractional numbers.
If the differences between the observed frequencies and the expected frequencies in a chi-square goodness-of-fit test are small, the null hypothesis is ____.
The degrees of freedom for a chi-square goodness- of-fit test depend on the number of ____ in the study.
If the ____ lands in the ____ of the sampling distribution of chi-square, then the null hypothesis is rejected.
The critical value of chi-square is abbreviated ____.
The chi-square goodness-of-fit test compares the distribution of the dependent variable in the ____ to the way it is distributed in the ____.
The sample in a chi-square goodness-of-fit test should be a ____ from the population.
The abbreviation for chi-square is ____, where the Greek letter is pronounced ____.
The chi-square goodness-of-fit test sees if the difference between what is ____ and what is____ can be explained by sampling error.
The chi-square goodness-of-fit test is a ____-sample test used with a ____ dependent variable.
Nonparametric tests have less ____ than ____ tests.
Nonparametric tests have fewer ____ than ____ tests.
If a researcher violates a nonrobust assumption for a parametric test, then a nonparametric test can be used as a ____ test.
Parametric tests assume that the dependent variable is ____ in the population.
The independent-samples t test is an example of a ____ test.
____ tests are for nominal-level or ____-level dependent variables.
The statistical tests in previous chapters all had ____-level or ____-level dependent variables.
Is there any value for degrees of freedom from 1 to 13 that cannot occur for a chi-square test of independence?
The correlation chapter was about understanding ____ between variables; this chapter, on regression, is about ____ one ____ from another ____.
In linear regression, the ____ variable is X and Y is the ____ variable.
It is reasonable to do linear regression if the correlation between X and Y is ____.
____ is the abbreviation for a predicted value of Y.
If blindly guessing a person’s score, the best guess is the ____.
Statisticians use the ____ criterion to judge the regression line.
On the basis of least squares, the best-fitting line is the one that ____ the sum of the ____.
The difference between a case’s actual Y score and its predicted Y score is called a ____.
A residual score is a measure of ____.
In the linear regression equation, b is the ____ and a is the ____.
Y′ in the regression equation is ____ and X is the ____.
A ____ slope means the line is moving down and to the right.
If the correlation is positive, the slope of the regression line is ____.
If a slope is −0.50, then for every 1-point increase in X, there is a 0.5-point ____ in Y.
The spot where the regression line would pass through the ____ is called the Y-intercept.
Predictions of Y from X should only be made for X values that fall within the range of ____ used to develop the regression equation.
If X = 17 and Y′ = 29.37, then the value 29.37 is a ____ estimate.
An ____ estimate is better than a ____ estimate.
If one uses a regression equation to predict Y′ from X, and several cases have the same X value, then each time Y′ is predicted for these cases, Y′ will be the same / different .
The standard deviation of the residual scores is called the ____.
The standard error of the estimate can be thought of as the average ____ in prediction.
A prediction interval gives the range within which it is likely that a case’s Y / Y′ value falls.
The standard error of the estimate has an impact on the ____ of a prediction interval.
Simple regression uses ____ independent variable to predict Y′; multiple regression uses ____.
Comparing multiple regression to simple regression, ____ usually accounts for a higher percentage of variability in Y than does ____.
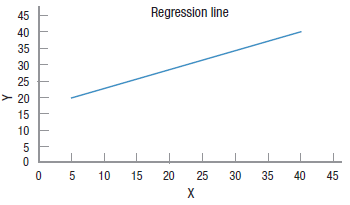
Given this regression line, predict Y for X = 25: Regression line 45 40 35 30 25 > 20 15 10 10 15 20 25 30 35 40 45
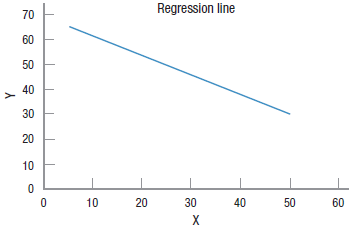
Given this regression line, predict Y for an X value of 30: Regression line 70 60 50 40 30 20 10 10 20 30 40 50 60
Multiple regression is often used in college ____ decisions.
Calculating slope.If r = −.47, sY = 3.65, and sX = 9.66, what is b?
Calculating slope.If r = .28, sY = 0.34, and sX = 0.28, what is b?
An automotive magazine used the price of gas in cents per gallon to predict the number of miles families drove on their summer vacations. The slope of the regression line was −35. Use the slope to interpret the impact of gas prices on vacation driving.
An exercise physiologist used the number of hours of TV watched per week at age 30 to predict the number of pounds gained over the next 10 years. The slope of the regression line was 1.25. Use the slope to interpret the impact of watching TV on weight gain.
Calculating the Y-intercept.If b = 4.33, MX = 5.00, and MY = 17.50, what is a?
Calculating the Y-intercept.If b = −2.45, MX = 53.45, and MY = 112.23, what is a?
Forming a regression equation.Given b = 12.98 and a = −5.00, write a regression equation.
Forming a regression equation.Given b = −0.68 and a = 7.50, write a regression equation.
Forming a regression equation.Given r = −.24, MX = 55.00, sX = 11.00, MY = 25.00, and sY = 3.98, write a regression equation.
Forming a regression equation.Given r = .33, MX = 2.50, sX = 1.50, MY = 112.50, and sY = 21.50, write a regression equation.
Predicting Y.Find Y′ if X = 25 for Y′ = 0.37X + 15.
Predicting Y.Find Y′ if X = −10 for Y′ = 13X + 88.
(a) Given the endpoints of (10, 20) and (80, 50), draw a regression line.(b) What is the range of X values for which Y′ can be calculated?
(a) Given the endpoints of (0, 70) and (50, 0),draw a regression line.(b) What is the range of X values for which Y′ can be calculated?
Here is a regression equation: Y′ = 2.50X − 12.50. If X values can range from 30 to 70, draw the regression line.
Here is a regression equation: Y′ = −1.10X + 115. If X values can range from 70 to 130, draw the regression line.
If X = 75.45, Y = 12.96, and Y′ = 13.43, what is the residual score?
If X = 24.77, Y = 33.43, and Y′ = 31.22, what is the residual score?
If r = .28 and sY = 10.55, what is the standard error of the estimate?
If r = .20 and sY = 30.42, what is the standard error of the estimate?
Dr. Lansing is using high school GPA to predict combined SAT scores. Combined SAT scores can range from 600 to 2400. He calculated the standard error of the estimate as 60. Interpret this error of the estimate.
Dr. Pallas is predicting severity of depression in adulthood from a childhood behavior checklist. The severity of depression scale ranges from 0 to 50 and the standard error of the estimate is 2.25. Interpret this error of the estimate.
A multiple regression equation has a constant of 5.74, a weight of 3.42 for variable 1, and a weight of −0.76 for variable 2. If a case has a score of 56.66 on variable 1 and a score of 88.99 on variable 2, what is Y′?
A multiple regression equation has a constant of 25.12, a weight of −4.55 for variable 1, a weight of −8.86 for variable 2, and a weight of 10.76 for variable 3. If a case has a score of 7.33 on variable 1, a score of 12.20 on variable 2, and a score of 18.85 on variable 3, what is Y′?
Jeff is an above-average golfer. He decides to change sports and take up ping pong. If there is a strong, positive correlation between golf ability and ping pong ability, predict how he’ll perform as a ping pong player?a. Excellentb. Above averagec. Averaged. Below averagee. Terriblef. Not enough
Sue is an above-average golfer. She decides to change sports and take up archery. If a strong, negative correlation exists between golf ability and archery ability, predict how she’ll perform as an archer?a. Excellentb. Above averagec. Averaged. Below averagee. Terriblef. Not enough information
David is an above-average golfer. He decides to change sports and take up wrestling. If there is a no correlation between golf ability and wrestling ability, predict how he’ll rate as a wrestler?a. Excellentb. Above averagec. Averaged. Below averagee. Terriblef. Not enough information given to
Showing 100 - 200
of 1356
1
2
3
4
5
6
7
8
9
10
11
12
13
14
Step by Step Answers