New Semester
Started
Get
50% OFF
Study Help!
--h --m --s
Claim Now
Question Answers
Textbooks
Find textbooks, questions and answers
Oops, something went wrong!
Change your search query and then try again
S
Books
FREE
Study Help
Expert Questions
Accounting
General Management
Mathematics
Finance
Organizational Behaviour
Law
Physics
Operating System
Management Leadership
Sociology
Programming
Marketing
Database
Computer Network
Economics
Textbooks Solutions
Accounting
Managerial Accounting
Management Leadership
Cost Accounting
Statistics
Business Law
Corporate Finance
Finance
Economics
Auditing
Tutors
Online Tutors
Find a Tutor
Hire a Tutor
Become a Tutor
AI Tutor
AI Study Planner
NEW
Sell Books
Search
Search
Sign In
Register
study help
mathematics
using interpreting statistics
Using And Interpreting Statistics 2nd Edition Eric W. Corty - Solutions
Write the null and alternative hypotheses for the between-subjects, one-way ANOVA in Exercise 10.74.Data from exercise 10.74A biomedical engineer compared the abrasion resistance—as measured by number of rotations until failure—of three different artificial hips. Manufacturer X makes hip joints
If N = 48 and k = 4, calculate(a) dfTotal,(b) dfBetween, and(c) dfWithin
If N = 120 and k = 5, calculate(a) dfTotal,(b) dfBetween, and(c) dfWithin.
If there are four independent samples, each with 15 participants, what are(a) dfTotal,(b) dfBetween, and(c) dfWithin?
If n1 = 15, n2 = 12, and n3 = 18, what are(a) dfTotal,(b) dfBetween, and(c) dfWithin?
If dfWithin = 44 and dfBetween = 2, what is Fcv if α = .01?
If dfBetween = 3 and dfWithin = 36, what is Fcv if α = .05
If α = .05, N = 50, and k = 4, what is Fcv?
If α = .05, N = 80, and k = 5, what is Fcv?
If dfWithin = 40 and dfBetween = 2, what is the decision rule if α = .05? Draw a sampling distribution of F and mark the rare and common zones.
If dfWithin = 10 and dfBetween = 3, what is the decision rule if α = .05? Draw a sampling distribution of F and mark the rare and common zones.
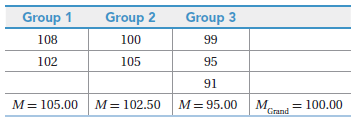
Given the data below, calculate(a) SSTotal,(b) SSBetween, and(c) SSWithin. Group 1 Group 3 Group 2 108 100 99 95 102 105 91 M= 105.00 M= 102.50 M= 95.00 M. Grand = 100.00
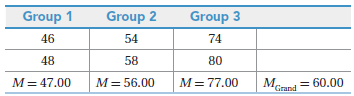
Given the data below, calculate(a) SSTotal,(b) SSBetween, and(c) SSWithin. Group 2 Group 3 Group 1 54 46 74 58 48 80 M= 77.00 M= 47.00 M= 56.00 Mcrand = 60.00 M Grand
If SSTotal = 98.75 and SSBetween = 40.33, what is SSWithin?
If SSWithin = 168.43 and SSBetween = 764.13, what is SSTotal?
If SSBetween = 2,378.99 and dfBetween = 3, what is MSBetween?
If SSBetween = 138.76 and dfBetween = 4, what is MSBetween?
If SSWithin = 78.95 and dfWithin = 32, what is MSWithin?
If SSWithin = 452.86 and dfWithin = 102, what is MSWithin?
If MSBetween = 38.88 and MSWithin = 17.44, what is F?
If MSWithin = 764.55 and MSBetween = 898.00, what is F?
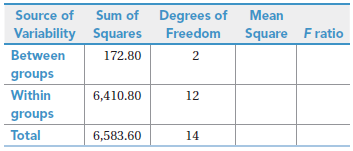
Complete this ANOVA summary table: Sum of Degrees of Source of Mean Variability Squares Square Fratio Freedom Between 172.80 2 groups Within 6,410.80 12 groups Total 6,583.60 14
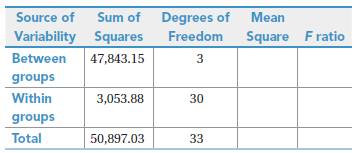
Complete this ANOVA summary table: Source of Sum of Degrees of Mean Variability Squares Freedom Square Fratio Between 47,843.15 3 groups Within 3,053.88 30 groups Total 50,897.03 33
If Fcv = 3.238, draw a sampling distribution of F, label the rare and common zones, locate F = 1.96, and determine, for this F value, if the null hypothesis should be rejected.
A ____-sample test compares the mean of one group to the mean of another group.
Analysis of variance is used when comparing the means of ____ or more groups.
____ is short for analysis of variance.
____, one-way ANOVA compares the means of three or more independent samples.
Other terms used for independent variables in ANOVA are ____ and ____.
The number of categories of an independent variable in ANOVA are called ____.
ANOVA keeps the risk of ____ error at a reasonable level.
The risk of making a Type I error ____ as the number of statistical tests being completed increases.
A follow-up test in ANOVA is called a ____ test.
A ____ is used to find out which pairs of means in an ANOVA are statistically significantly different.
ANOVA works by separating out the different sources of ____ in the scores.
Variability within a set of scores is called ____ variability.
Within-group variability is caused by ____.
Making a sample more homogeneous ____ within-group variability.
____ variability is due to the different treatments different groups receive.
____ effect is the term used to label the effect of the independent variable.
Between-group variability is caused by ____ as well as treatment effect.
If treatment has ____ impact on outcome, the sample means are close together.
When sample means are far apart, the treatment effect is ____.
When treatment has a large impact, there is a lot of variability between group ____.
The ratio of between-group variability to within-group variability is called an ____.
Between-group variability, the numerator in an F ratio, is made up of ____ and ____.
If treatment has no impact on outcome, the F ratio should be near ____.
As treatment has an impact on outcome, the value of the F ratio climbs above ____.
If there are just two groups, F = ____ squared.
Between-subjects, one-way ANOVA is used when there is one ____ and ____ groups.
The assumptions for between-subjects, one-way ANOVA are the same as they are for ____.
For a between-subjects, one-way ANOVA, the cases in each group should be ____ from the population.
If the cases in the groups for a between-subjects, one-way ANOVA are paired together, a between-subjects, one-way ANOVA can / cannot be used.
Between-subjects, one-way ANOVA assumes that the dependent variable in each population is ____ distributed.
The assumption that the variability in all groups is about the same is called the ____ assumption.
The null hypothesis states that there is ____ mean difference between any of the populations.
The null hypothesis for a between-subjects, one-way ANOVA is always ____ directional.
The alternative hypothesis says that at least ____ population mean is different from at least ____ other population mean.
The decision rule for a between-subjects, oneway ANOVA says that if F falls in the rare zone of the sampling distribution, the null hypothesis is ____.
The critical value of F depends on the degrees of freedom for the ____ and the degrees of freedom for the ____ of the F value.
The numerator degrees of freedom for a between-subjects, one-way ANOVA F ratio is df ____.
The denominator degrees of freedom for a between-subjects, one-way ANOVA F ratio is df ____.
In order to calculate total degrees of freedom for a between-subjects, one-way ANOVA, one could add together ____ and ____.
If F = Fcv, the null hypothesis is ____.
ΣX2 is called a ____.
Numerators in variance formulas are ____.
To calculate ____, the grand mean is subtracted from each score, the difference scores are squared, and they are all added up.
SSTotal can be broken down into two components: ____ and ____.
SSBetween isolates the variability in scores that is primarily due to ____.
When ANOVA is used to for categorical independent variables, which of the following equation/notations is the most applicable to the situation? SSTotal − SSBetween = ____
The table used to organize ANOVA results is called an ____.
The sources of variability in an ANOVA are listed in the ____ column of an ANOVA summary table.
A ____ is calculated by dividing a sum of squares by its degrees of freedom.
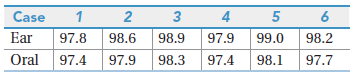
A nurse at a health clinic wanted to see if its ear thermometers and oral thermometers registered the same body temperatures. She selected six healthy staff members and took their temperatures with both thermometers. Apply the six steps of hypothesis testing to the data collected. Is body
If the 95% confidence interval for the difference between population means ranges from −5.00 to 1.00 and sMD = 4.00, what is t?
If the 95% confidence interval for the difference between population means ranges from 1.00 to 9.00, what is ME − MC?
If MC = 51 and ME = 43, for which situation is the 95% confidence interval for the difference between population means the widest?a. N = 28 and sMD = 2.00b. N = 28 and sMD = 4.00c. N = 28 and sMD = 6.00d. N = 28 and sMD = 9.00e. All confidence intervals are equally wide.f. Not enough information
If MC = 5 and ME = 10, for which situation is the 95% confidence interval for the difference between population means the widest?a. N = 5 and sMD = 5.28b. N = 10 and sMD = 5.28c. N = 20 and sMD = 5.28d. All confidence intervals are equally wide.e. Not enough information was presented to answer this
If N = 24 and sMD = 3.56, for which situation is the 95% confidence interval for the difference between population means the widest?a. MC = 0 and ME = 2b. MC = 0 and ME = 5c. MC = 0 and ME = 10d. MC = 0 and ME = −2e. All confidence intervals are equally wide.f. Not enough information was
A college president wanted to know how 10-year-after-graduation salaries for academic majors (English, psychology, math, etc.) compared to salaries for career-oriented majors (business, engineering, computer science, etc.). She matched 84 academic majors at her college with 84 career-oriented
A dermatologist compared a new treatment for athlete’s foot (the experimental condition) to the standard treatment (the control condition). He tracked down 30 people with athlete’s foot on both feet and, for each participant, randomly assigned one foot to receive the new treatment and the other
A sportswriter was curious if football teams gained more yards rushing (the control condition) or passing (the experimental condition). She randomly selected nine teams and calculated the mean yards gained per game through rushing (101) and through passing (221). sD was 27.99. She calculated sMD =
A sleep therapist wanted to see if a herbal tea advertised as a sleep aid really worked. He located 46 people with sleep problems and matched them into pairs on the basis of (a) How long they had suffered from insomnia,(b) How long it usually took them to go to sleep at night,(c) How much
Based on the confidence interval −0.40 to 0.50, decide if the null hypothesis was rejected for the paired-samples t test.
Based on the confidence interval 18.00 to 27.00, decide if the null hypothesis was rejected for the paired-samples t test.
Given the following, calculate the 95% confidence interval for the difference between population means: M1 = 40, M2 = 50, tcv = 2.010, and sMD = 2.44.
Given the following, calculate the 95% confidence interval for the difference between population means: M1 = 108, M2 = 100, tcv = 2.052, and sMD = 5.00.
Given these results, comment on the direction of the difference between the population means: M1 = 28, M2 = 31, t(72) = 7.42, p < .05.
Given these results, comment on the direction of the difference between the population means: M1 = 50, M2 = 53, t(17) = 1.54, p > .05.
Given these results, comment on the direction of the difference between the population means: M1 = 17, M2 = 24. t(35) = 2.01, p > .05.
Given these results, comment on the direction of the difference between the population means: M1 = 72, M2 = 73, t(26) = 2.08, p < .05.
Given N = 181 and t = 1.981, write the results of this paired-samples t test in APA format.
Given N = 69 and t = 1.994, write the results of this paired-samples t test in APA format.
Given N = 27 and t = 2.033, write the results of this paired-samples t test in APA format.
Given N = 5 and t = 3.211, write the results of this paired-samples t test in APA format.
If t = 1.65 and tcv = ±2.145,(a) Draw a sampling distribution of t, marking t and tcv, and labeling the rare and common zones, then(b) Report whether or not the null hypothesis was rejected.
If t = 2.30 and tcv = ±2.017,(a) Draw a sampling distribution of t, marking t and tcv, and label the rare and common zones, then(b) Report whether or not the null hypothesis was rejected.
Given M1 = −7, M2 = −9, N = 28, and sD = 2.90, calculate t.
Given M1 = 25, M2 = 28, N = 5, and sD = 7.00, calculate t.
Given sMD, finding t.If M1 = −12, M2 = −15, and sMD = 2.81, what is t?
Showing 600 - 700
of 1356
1
2
3
4
5
6
7
8
9
10
11
12
13
14
Step by Step Answers