New Semester
Started
Get
50% OFF
Study Help!
--h --m --s
Claim Now
Question Answers
Textbooks
Find textbooks, questions and answers
Oops, something went wrong!
Change your search query and then try again
S
Books
FREE
Study Help
Expert Questions
Accounting
General Management
Mathematics
Finance
Organizational Behaviour
Law
Physics
Operating System
Management Leadership
Sociology
Programming
Marketing
Database
Computer Network
Economics
Textbooks Solutions
Accounting
Managerial Accounting
Management Leadership
Cost Accounting
Statistics
Business Law
Corporate Finance
Finance
Economics
Auditing
Tutors
Online Tutors
Find a Tutor
Hire a Tutor
Become a Tutor
AI Tutor
AI Study Planner
NEW
Sell Books
Search
Search
Sign In
Register
study help
business
quality management
Quality Improvement 9th Edition Dale Besterfield - Solutions
4. Determine the equation for the OC curve for the following sampling plans:a. N = 500, n1 = 50, c1 = 0, r1 = 3, n2 = 70, c2 = 2, and r2 = 3b. N = 6000, n1 = 80, c1 = 2, r1 = 4, n2 = 160, c2 = 5, and r2 = 6c. N = 22,000, n1 = 260, c1 = 5, r1 = 9, n2 = 310, c2 = 8, and r2 = 9d. N = 10,000, n1 = 300,
5. For the sampling plan of Exercise 1, determine the AOQ curve and the AOQL.
6. For the sampling plan of Exercise 2, determine the AOQ curve and the AOQL.
7. A major U.S. automotive manufacturer is using a sampling plan of n = 200 and c = 0 for all lot sizes.Construct the OC and AOQ curves. Graphically determine the AQL value for a = 0.05 and the AOQL value.
Write an EXCEL template for a D chart.
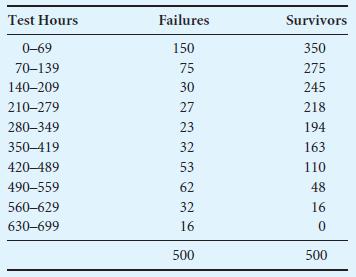
15. Construct the life-history curve for the following test data: Test Hours Failures Survivors 0-69 150 350 70-139 75 275 140-209 30 245 210-279 27 218 280-349 23 194 350-419 32 163 420-489 53 110 490-559 62 48 560-629 32 630-699 16 16 0 500 500
28. Prepare an EXCEL template for the four charts to ensure that the LCL is always 0.
20. A bank has compiled the data in the following table showing the count of nonconformities for 100,000 accounting transactions per day during December and January. What control limits and central line are recommended for the control chart for February?Assume any out-of-control points have
21. A quality technician has collected data on the count of rivet nonconformities in 4-m travel trailers. After 30 trailers, the total count of nonconformities is 316. Trial control limits have been determined, and a comparison with the data shows no out-of-control points. What is the
22. One hundred product labels are inspected every day for surface nonconformities. Results for the past 25 days are 22, 29, 25, 17, 20, 16, 34, 11, 31, 29, 15, 10, 33, 23, 27, 15, 17, 17, 19, 22, 23, 27, 29, 33, and 21. Plot the points on graph paper (run chart) and determine if the process is
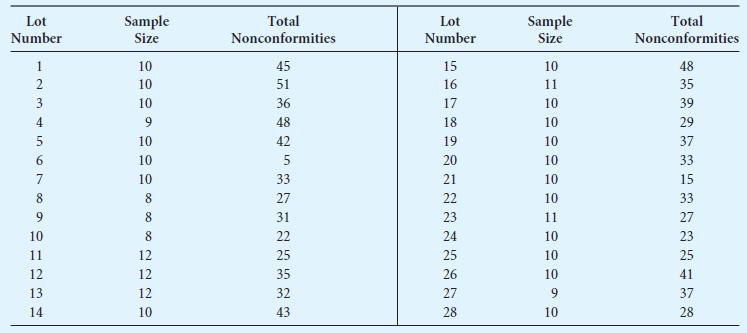
23. Determine the trial control limits and revised control limits for a u chart using the data in the table for the surface finish of rolls of white paper. Assume any outof-control points have assignable causes. Lot Number Sample Size Total Nonconformities Lot Number Sample Size Total
24. A warehouse distribution activity has been in statistical control, and control limits are needed for the next period. If the subgroup size is 100, the total count of nonconformities is 835, and the number of subgroups is 22, what are the new control limits and central line?
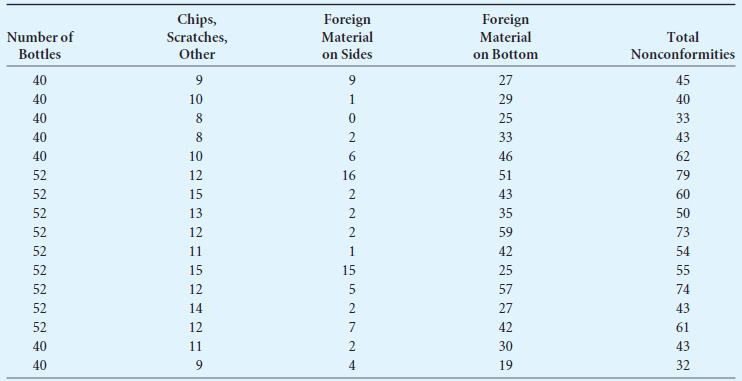
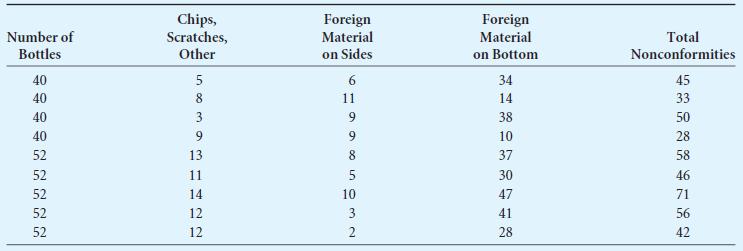
25. Construct a control chart for the data in the table for empty bottle inspections of a soft drink manufacturer.Assume assignable causes for any points that are out of control. Number of Bottles Chips, Scratches, Other Foreign Material Foreign Material 40 9 on Sides 9 on Bottom Total
26. Assuming that a 10:5:1 demerit weighting system is used, determine the central line and control limits when uc = 0.11, uma = 0.70, umi = 4.00, and n = 50. If the subgroup inspection results for a particular day are 1 critical, 35 major, and 110 minor nonconformities, determine if the results
27. Solve the following problems using the EXCEL program files on the website.a. Exercise 2b. Exercise 13c. Exercise 17d. Exercise 21
8. A leading computer firm uses a sampling plan of n = 50 and c = 0 regardless of lot sizes. Construct the OC and AOQ curves. Graphically determine the AQL value for a = 0.05 and the AOQL value.
9. Construct the ASN curves for the single sampling plan n = 200, c = 5 and the equally effective double sampling plan n1 = 125, c1 = 2, r1 = 5, n2 = 125, c2 = 6, and r2 = 7.
10. Construct the ASN curves for the single sampling plan n = 80, c = 3 and the equally effective double sampling plan n1 = 50, c1 = 1, r1 = 4, n2 = 50, c2 = 4, and r2 = 5.
21. A single sampling plan is desired with a consumer’s risk of 0.10 of accepting 3.0% nonconforming units and a producer’s risk of 0.05 of not accepting 0.7%nonconforming units. Select the plan with the lowest sample size.
22. The producer’s risk is defined by a = 0.05 for 1.5%nonconforming units, and the consumer’s risk is defined by b = 0.10 for 4.6% nonconforming units.Select a sampling plan that exactly meets the producer’s stipulation and comes as close as possible to the consumer’s stipulation.
23. For the information of Exercise 21, select the plan that exactly meets the consumer’s stipulation and comes as close as possible to the producer’s stipulation.
24. For the information of Exercise 22, select the plan with the smallest sample size.
25. Given p0.10 = 0.053 and p0.95 = 0.014, determine the single sampling plan that exactly meets the consumer’s stipulation and comes as close as possible to the producer’s stipulation.
26. For the information of Exercise 25, select the plan that meets the producer’s stipulation and comes as close as possible to the consumer’s stipulation.
27. If a single sampling plan is desired with an AOQL of 1.8% at an incoming quality of 2.6%, what is the common point on the OC curves for a family of sampling plans that meet the AOQL and 100p0 stipulation?
28. Using the EXCEL program file, solvea. Exercises 1 and 5b. Exercises 2 and 6
20. Construct the OC and AOQ curves for the c = 3 plan of Exercise 19.
19. A manufacturer of loudspeakers has decided that product 2% nonconforming will be accepted with a probability of 0.01. Determine single sampling plans for c = 1, 3, and 5.
11. Construct the ATI curve for N = 500, n = 80, and c = 0.
12. Construct the ATI curve for N = 10,000, n = 315, and c = 5.
13. Determine the AOQ curve and the AOQL for the single sampling plan N = 16,000, n = 280, and c = 4.
14. Using c = 1, c = 5, and c = 8, determine three sampling plans that ensure product 0.8% nonconforming will be rejected 5.0% of the time.
15. For c = 3, c = 6, and c = 12, determine the sampling plans for AQL = 1.5 and a = 0.01.
16. A bedsheet supplier and a large motel system have decided to evaluate units in lots of 1000 using an AQL of 1.0% with a probability of nonacceptance of 0.10. Determine sampling plans for c = 0, 1, 2, and 4. How would you select the most appropriate plan?
17. For a consumer’s risk of 0.10 and an LQ of 6.5%, determine the sampling plans for c = 2, 6, and 14.
18. If product that is 8.3% nonconforming is accepted 5%of the time, determine three sampling plans that meet this criterion. Use c = 0, 3, and 7.
29. Using the EXCEL program file, copy the template to a new sheet and change the increment for the data points from 0.0025 to 0.002. Resolve Exercises 28(a) and 28(b) and compare results.
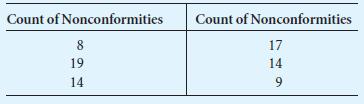
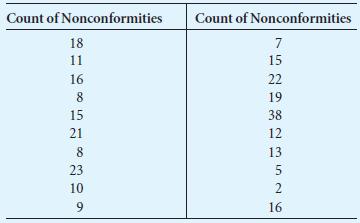
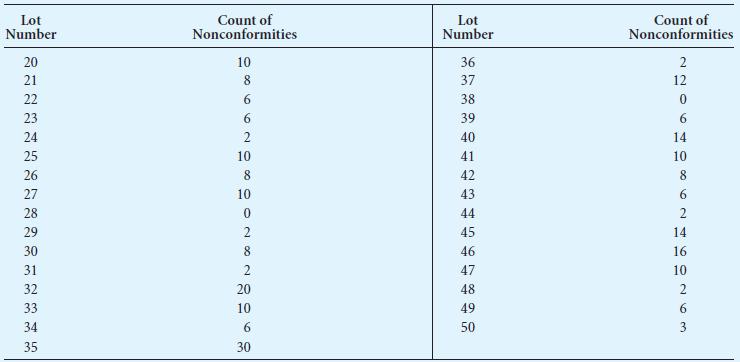
19. The count of surface nonconformities in 1000 m2 of 20-kg kraft paper is given in the following table.Determine the trial central line and control limits and the revised central line and control limits, assuming that out-of-control points have assignable causes. Lot Number Count of
23. The game of KENO has 80 numbers and you select 15.What is the probability of having all 15 numbers and winning the jackpot?
34. Using the binomial distribution, find the probability of obtaining 2 or less nonconforming restaurants in a sample of 9 when the lot is 15% nonconforming.
35. What is the probability of guessing correctly exactly 4 answers on a true–false examination that has 9 questions?Use the binomial distribution.
36. An injection molder produces golf tees that are 15.0%nonconforming. Using the binomial, find the probability that, in a random sample of 20 golf tees, 1 or less are nonconforming.
37. A random sample of 10 automotive bumpers is taken from a stream of product that is 5% nonconforming.Using the binomial distribution, determine the probability of 2 nonconforming automotive bumpers.
38. If the average number of nonconforming units is 1.6, what is the probability that a sample will contain 2 or less nonconforming units? Use the Poisson distribution.
39. Using the data from Exercise 38, determine the probability of 2 or more nonconforming units.
40. A sample of 10 washing machines is selected from a process that is 8% nonconforming. What is the probability of 1 nonconforming washing machine in the sample? Use the Poisson distribution.
41. A lot of 15 has 3 nonconforming units. What is the probability that a sample of 3 will have 1 nonconforming unit?
33. Find the probability, using the binomial distribution, of obtaining 2 or more nonconforming units when sampling 5 computers from a batch known to be 6%nonconforming.
32. A steady stream of income tax returns has a proportion nonconforming of 0.03. What is the probability of obtaining 2 nonconforming units from a sample of 20?Use the binomial distribution.
24. An automatic garage-door opener has 12 switches that can be set on or off. Both the transmitter and receiver are set the same and the owner has the option of setting 1 to 12 switches. What is the probability that another person with the same model transmitter could open the door?
25. Compare the answers of C53 with C52, C41 with C43, and C10 2 with C10 8 . What conclusion can you draw?
Calculate C60, C10 0 , and C25 0 . What conclusion can you draw?
Calculate C33, C99, and C35 35 . What conclusion can you draw?
Calculate C71, C12 1 , and C18 1 . What conclusion can you draw?
29. A random sample of 4 insurance claims is selected from a lot of 12 that has 3 nonconforming units.Using the hypergeometric distribution, what is the probability that the sample will contain exactly zero nonconforming units? one nonconforming unit? two nonconforming units? three nonconforming
30. A finite lot of 20 digital watches is 20% nonconforming.Using the hypergeometric distribution, what is the probability that a sample of 3 will contain 2 nonconforming watches?
31. In Exercise 30, what is the probability of obtaining 2 or more nonconforming units? What is the probability of 2 or less nonconforming units?
42. A sample of 3 medicine bottles is taken from an injection molding machine that is 10% nonconforming.What is the probability of 1 nonconforming medicine bottle in the sample?
43. A steady stream of light bulbs has a fraction nonconforming of 0.09. If 67 are sampled, what is the probability of 3 nonconforming units?
44. Using the EXCEL software, solve some of the exercises and compare your answers with those obtained using a calculator or by hand.
10. Control charts are to be established on the manufacture of backpack frames. The revised fraction nonconforming is 0.08. Determine control limit lines for inspection rates of 1000 per day, 1500 per day, and 2000 per day. Draw the control chart. Why are the control limits not spaced equally?
11. Determine the revised central line and control limits for a percent nonconforming chart for the information in:a. Exercise 2b. Exercise 6
12. From the information of Exercise 2, determine the revised central line and control limits for an np chart.
13. From the information of Exercise 6, determine the revised central line and control limits for an np chart.Which chart is more meaningful to operating personnel?
14. An np chart is to be established on a painting process that is in statistical control. If 35 pieces are to be inspected every 4 h and the fraction nonconforming is 0.06, determine the central line and control limits.
15. Determine the revised central line and control limits for fraction conforming, percent conforming , and number conforming charts for the information in:a. Exercise 2b. Exercise 6
16. Find the process capability fora. Exercise 6b. Exercise 7c. Exercise 10
17. A credit card manager wishes to determine the proportion of customer calls that result in a dissatisfied customer.Based on some preliminary data, she estimates the percentage to be 10% (p = 0.10). A precision of 15% and confidence level of 90% are desired. What is the sample size?
9. Control limits are to be established based on the average number inspected from the information in Exercise 8. What are these control limits and the central line?Describe the cases where individual control limits will need to be calculated.
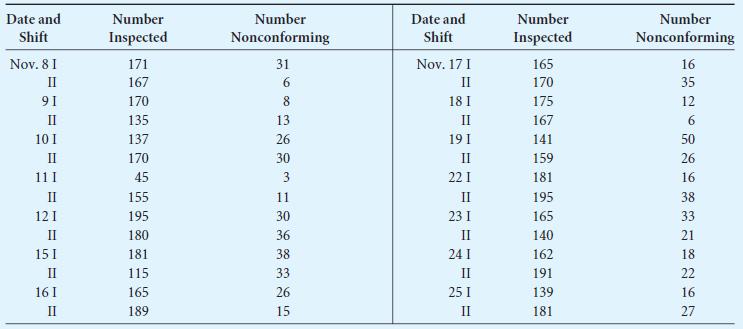
8. Daily inspection results for the model 305 electric range assembly line are given in the following table.Determine trial control limits for each subgroup. Assume that any out-of-control points have assignable causes, and determine the standard value for the fraction nonconforming for December.
45. Using EXCEL, construct a graph showing the entire distribution for:a. Hypergeometirc, where n = 4, N = 20, and D = 5b. Binomial, where n = 15 and p = 0.05c. Poisson, where np = 1.0
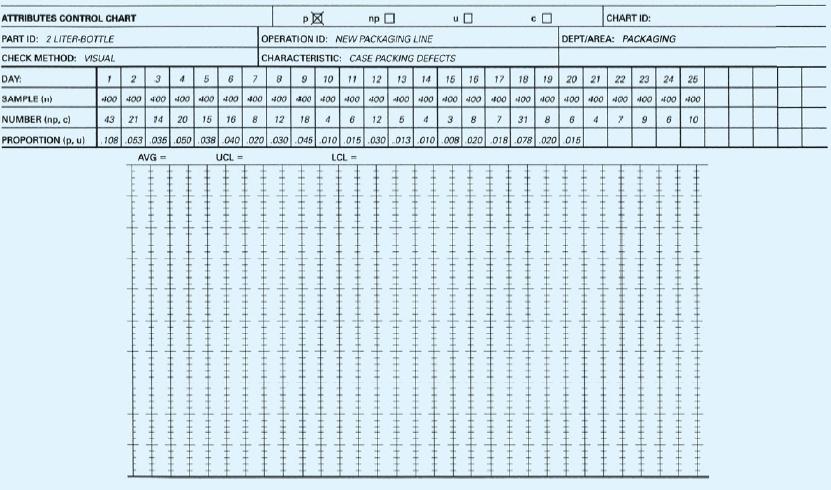
1. On page 144 is a typical attribute chart form with information concerning 2-L soda bottles.a. Calculate the proportion nonconforming for subgroups 21, 22, 23, 24, and 25. Construct a run chart.b. Calculate the trial central line and control limits.Draw these values on the chart.c. If it is
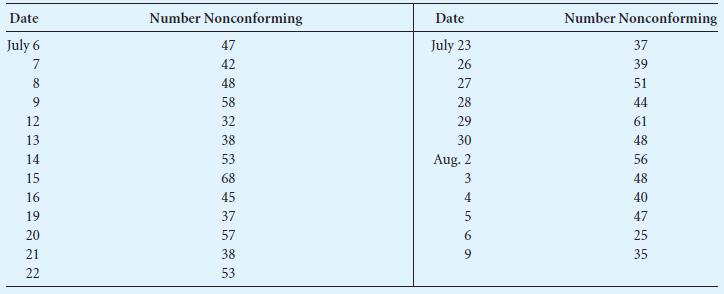
2. Determine the trial central line and control limits for a p chart using the following data, which are for the payment of dental insurance claims. Plot the values on graph paper and determine if the process is stable. If there are any out-of-control points, assume an assignable cause and
3. The supervisor is not sure about the best way to display the quality performance determined in Exercise 2.Calculate the central line and limits for the other methods of presentation.
4. After achieving the objective in the example problem concerning the hair dryer motor, it is decided to reduce the sample size to 80. What are the central line and control limits?
5. Fifty motor generators are inspected per day from a stable process. The best estimate of the fraction nonconforming is 0.076. Determine the central line and control limits. On a particular day, 5 nonconforming generators were discovered. Is this in control or out of control?
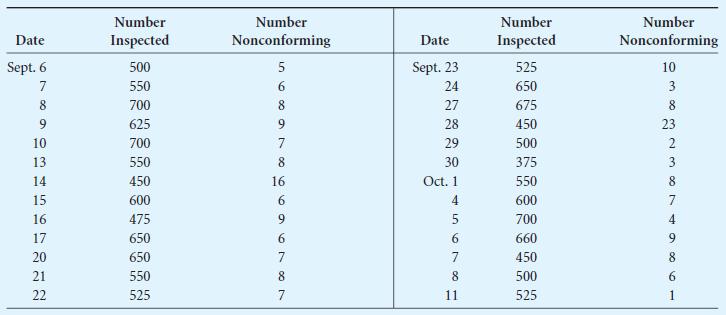
6. Inspection results of video-of-the-month shipments to customers for 25 consecutive days are given in the following table. What central line and control limits should be established and posted if it is assumed that any outof-control points have assignable causes? The number of inspections each
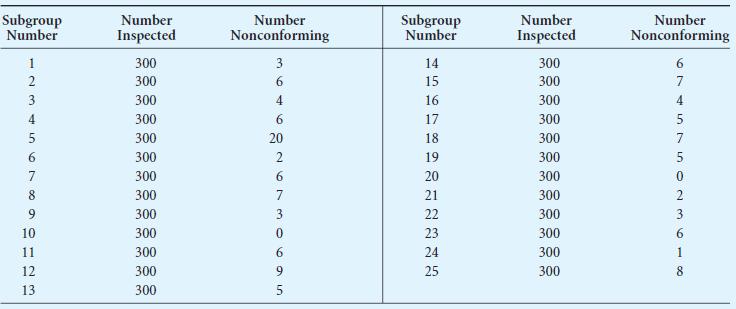
7. The performance of the first shift is reflected in the inspection results of electric carving knives. Determine the trial central line and control limits for each subgroup. Assume that any out-of-control points have assignable causes and determine the standard value for the fraction
18. The sample size of a p chart for a fertilizer packing line needs to be determined. Preliminary data indicate that 8% of the bags are outside the weight specifications.What is the sample size for a precision of 10% and a 70% confidence level? For a precision of 10% and a confidence level of 99%?
30. Using EXCEL, write a program fora. OC curve for double sampling.b. AOQ curve for double sampling.c. ASN curve for single and double sampling.d. ATI curve for single and double sampling.
2. Identify the appropriate level of risk for the following items and justify your answer.a. Space shuttleb. X-ray machinec. Camerad. Canned soupe. Pencilf. Computer keyboard g. Chair h. Running shoe i. Automobile j. Fresh vegetables k. Child’s toy l. Golf club m. Baby food n. Restaurant food o.
13. Develop a table similar to Table 13-9 for an experiment with four factors.
14. Formulate a full factorial experiment to determine what factors affect the retention rate in college. Identify four factors each at two levels that you feel influence retention rate. For example, one factor could be external work with two levels, 20 and 40 hours per week.
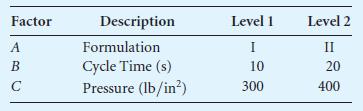
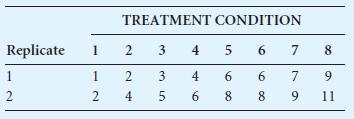
15. Three factors, each at two levels, are studied using a full factorial design. Factors and levels are given in the following table:Responses in the following table are for each treatment condition as depicted in Table 13-9 . Set up a full factorial design and evaluate the significance and factor
16. Reduce the full factorial experiment in Exercise 14 to a three-factor fractional factorial experiment by using your experience and personal judgment. For instance, eliminate the four-factor interaction and some of the two- and three-factor interactions. Construct a table similar to Table 13-12 .
17. Working individually or in a team, design a full factorial experiment and determine responses for one or more of the following items and one of your own choice. Your experiments should have at least three factors at two levels each and two replicates.a. Accuracy of weather forecaster(examples
1. The specifications of a steel shaft are 6.40 { 0.10 mm.The device sometimes fails when the shaft exceeds the specification. When failure occurs, repair or replacement is necessary at an average cost of $95.00.a. What is the loss coefficient k ?b. What is the loss function equation?c. What is the
2. The specifications for an electronic device are 24 { 0.4 Amps and the average repair cost is $32.00.a. Determine the loss function.b. Determine the loss at 24.6 Amps.
3. Determine the average loss for the information in Exercise 2 if 13 samples give 24.2, 24.0, 24.1, 23.8, 24.3, 24.2, 23.9, 23.8, 24.0, 23.6, 23.8, 23.9, and 23.7.
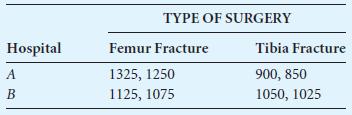
12. An insurance company is analyzing the cost of a femur fracture and tibia fracture at two hospitals. Given the following costs in dollars, determine if there is a significant difference in the cost of surgery at each hospital using an appropriate a level and comment on the results. Hospital A B
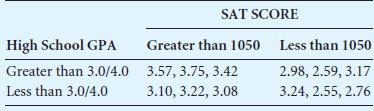
11. A university administrator is interested in determining the effect of SAT score and high school GPA on a university student’s GPA. The university GPAs for 12 students are given in the following table. For an a level of 0.10, comment on the significance of SAT score, high school GPA, and their
3. A law enforcement organization claims that their radar gun is accurate to within 0.5 miles per hour for a court hearing. An independent organization hired to test the accuracy of the radar gun conducted 12 tests on a projectile moving at 60 miles per hour. Given the data in the following table,
4. An organization developing a new drug to combat depression is performing testing on 10 subjects. After giving 10 mg of the drug to each subject for 30 days, psychological tests are given to evaluate the drug’s performance. The results of the test on a 100 scale are given in the following
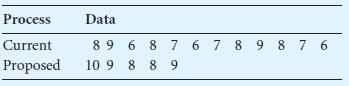
5. Given the data in the following table for wave-soldering nonconformities, determine if there are any differences between the two processes. Based on various a levels, would you recommend a change to the proposed process? Process Data Current 89 6 8 7 6 7 8 9 876 Proposed 10 9 889
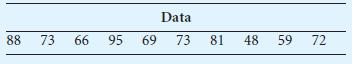
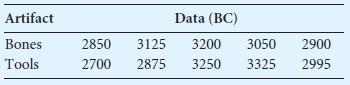
6. An archeologist has recently uncovered an ancient find.Based upon carbon dating of bones and tools found at the site, the following data has been acquired. Use an a level of 0.10 to determine whether the bones and tools are from the same time period. Also determine whether the bones or tools are
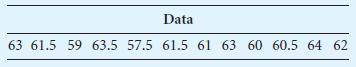
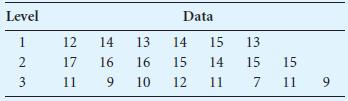
7. Using the information in the following table for three levels of a factor, determine if there is any significant difference in the data for a = 0.05. If significance occurs, determine the appropriate levels using the t reference distribution. Level Data 1 12 14 13 14 15 13 2 17 16 16 15 14 15 15
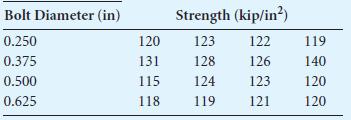
8. Because of an influx of nonconforming bolts, an aircraft manufacturer decides to check the ultimate strength of four different size bolts in their last order using a tensile testing machine. Based on the following data, use an appropriate a level to determine if there is significance.
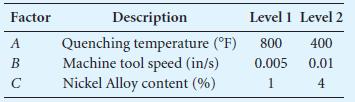
9. An engineer at a casting company performed an experiment to determine which factor (quenching temperature, alloy content, or machine tool speed) had the largest effect on the surface roughness. The following table gives the levels for each factor in the experiment.Using a one-factor-at-a-time
10. Repeat Exercise 9 using an orthogonal experiment if the responses are y111 = 1.10 m in, y211 = 0.80 m in, y121 = 0.90 m in, y221 = 0.70 in, y112 = 1.05 m in, y212 = 1.35 m in, y122 = 1.10 m in, and y222 = 1.40 m in. Compare your results to Exercise 9 and comment on the effect of each factor on
4. For an out-of-round condition (smaller-the-better) of a steel shaft, the true indicator readings (TIR) for eight shafts are 0.05, 0.04, 0.04, 0.03, 0.04, 0.02, 0.04, and 0.03 mm.a. If the average loss at 0.03 is $15.00, what is the loss function?b. What is the loss at 0.05?c. What is the average
Showing 1500 - 1600
of 2646
First
9
10
11
12
13
14
15
16
17
18
19
20
21
22
23
Last
Step by Step Answers