New Semester
Started
Get
50% OFF
Study Help!
--h --m --s
Claim Now
Question Answers
Textbooks
Find textbooks, questions and answers
Oops, something went wrong!
Change your search query and then try again
S
Books
FREE
Study Help
Expert Questions
Accounting
General Management
Mathematics
Finance
Organizational Behaviour
Law
Physics
Operating System
Management Leadership
Sociology
Programming
Marketing
Database
Computer Network
Economics
Textbooks Solutions
Accounting
Managerial Accounting
Management Leadership
Cost Accounting
Statistics
Business Law
Corporate Finance
Finance
Economics
Auditing
Tutors
Online Tutors
Find a Tutor
Hire a Tutor
Become a Tutor
AI Tutor
AI Study Planner
NEW
Sell Books
Search
Search
Sign In
Register
study help
business
business statistics using excel
Business Statistics Using Excel 2nd Edition Glyn Davis, Branko Pecar - Solutions
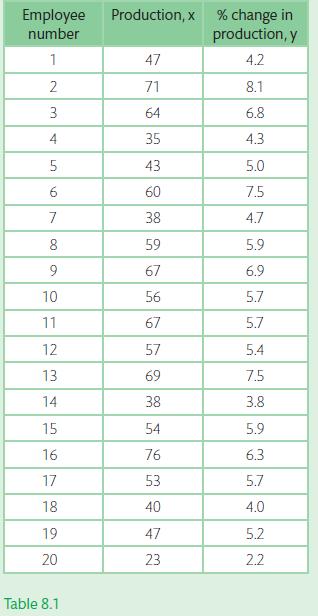
Fit a prediction interval at xp = 30 to the data set from Example 8.1.Data from Example 8.1A large manufacturing firm with some 8000 employees has designed a training programme that is supposed to increase the production of employees. The personnel manager decides to examine this claim by analysing
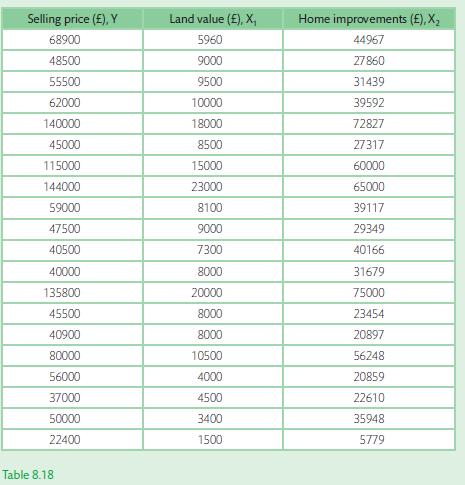
Table 8.18 consists of data that has been collected by an estate agent who wishes to model the relationship between house sales price (£) and the independent variables: land value, LV (£) and the value of home improvements, IV (£).In order to fit the model the estate agent selected a random
CoCo S.A. is concerned about the time taken to react to customer complaints and has implemented a new set of procedures for its support centre staff . The customer service director has decided that there is no evidence for the population distribution to be normally distributed and has directed that
A business consultant requests that you perform some preliminary calculations before analysing a data set using Excel.(a) Calculate the number of degrees of freedom for a contingency table with three rows and four columns.(b) Find the upper tail critical χ2 value with a significance level of 5%
Bakers Ltd are currently undertaking a review of the delivery vans used to deliver products to customers. The company runs two types of delivery van (type A, recently purchased, and type B, at least three years old), which are supposed to be capable of achieving 20 km per litre of petrol. A new
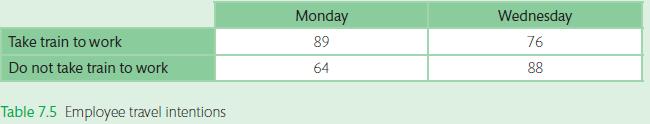
To illustrate the concept consider the example of a firm who surveys whether or not employees use the train to travel to work. The firm collects the data and has created a 2 * 2 contingency table (see Table 7.5) to summarize the responses for only the people who work on two days.Whether or not we
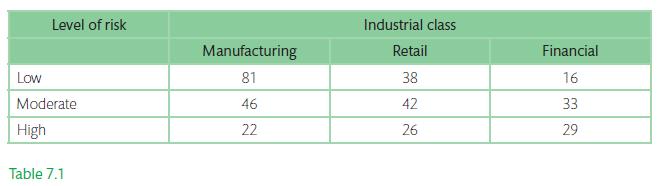
A trainee risk manager for an investment bank has been told that the level of risk is related directly to the industry type (manufacturing, retail, and fi nancial). For the data presented in the contingency table (Table 7.1) analyse whether or not perceived risk is dependent upon the type of
Skodel Ltd is developing a low calorie lager for the European market with a mean designed calorie count of 43 calories per 100 ml. The new product development team are having problems with the production process and have collected two independent random samples to assess whether the target calorie
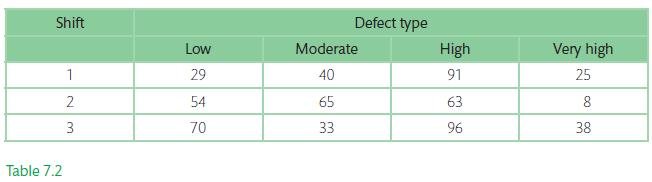
A manufacturing company is concerned at the number of defects produced by the manufacture of office furniture. The firm operates three shifts and has classified the number of defects as low, moderate, high, or very high (Table 7.2). Is there any evidence to suggest a relationship between types of
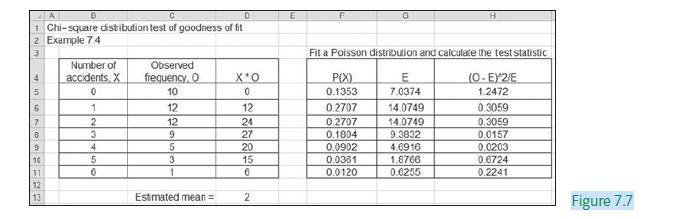
To illustrate the method consider the example of a motorway safety officer who believes that the number of accidents per week occurring on a stretch of motorway can be modelled using a Poisson distribution. If X denotes the number of accidents per week then the sample data can be modelled by
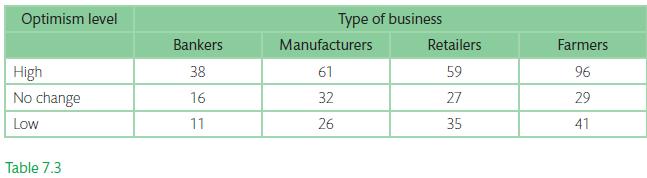
A local trade association is concerned at the level of business activity within the local region. As part of a research project a random sample of business owners were surveyed on how optimistic they were for the coming year. Based upon the contingency Table 7.3 do we have any evidence to suggest
To illustrate the concept consider the situation where 16 randomly-selected people were chosen to measure the effectiveness of a new training programme on the value of sales. For the training programme to be effective we would expect the hypothesis statement to be H1: the training programme results
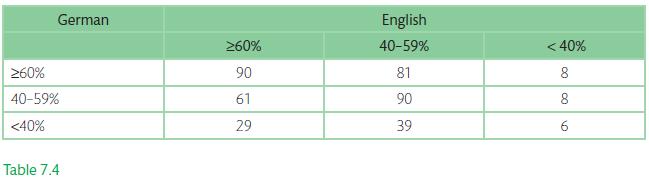
A group of students at a language school volunteered to sit a test that is to be undertaken to assess the effectiveness of a new method to teach German to English-speaking students. To assess effectiveness students sit two different tests with one test in English and the other test in German. Is
A business analyst requests answers to the following questions:(a) What is the p-value when the chi-square test statistic = 2.89 and we have one degree of freedom?(b) If you have one degree of freedom, what is the value of the Z test statistic?(c) Find the critical chi-square value for significance
A local training firm has developed an innovative programme to improve the performance of students on the courses it offers. To assess whether the new programme improves student performance the firm have collected two random samples from the population of students sitting an accountancy
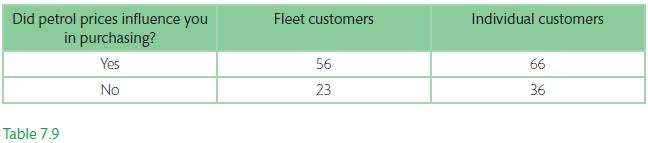
The petrol prices during the summer of 2008 raised concerns with new car sellers that potential customers were taking prices into account when choosing a new car. To provide evidence to test this possibility a group of five local car showrooms agreed to ask fleet managers and individual customers
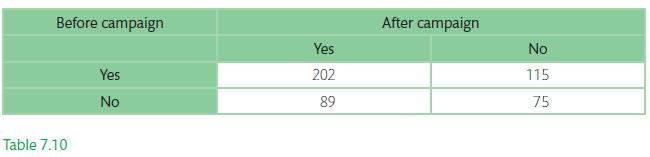
A business analyst has been asked to confirm the effectiveness of a marketing campaign on people’s attitudes to global warming. To confirm that the campaign was effective a group of 500 people were randomly selected from the population and asked the simple question about whether they agree that
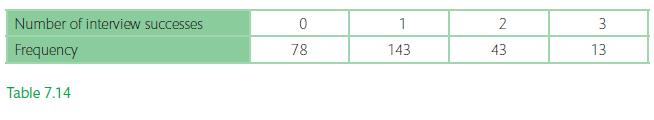
An employment agency has recently implemented a new training programme to develop the interview skills of potential job applicants. Based upon the collected data (Table 7.14) can we say confidently that the data can be modelled using a binomial distribution (assess at 5%)? Number of interview
A university has recently set up a satellite department within a local college of higher education. The university claims that 35% of the undergraduate students are in department A, 26% are in department B, 25% are in department D, and 14% are in department D. A random sample of 320 students finds
A new airport terminal has been assessing waiting times for passengers to be processed at the airport check-in counters. The airport owners would like to be able to attach levels of risk to diff erent aspects of the business. To undertake this we are required to fit an appropriate probability
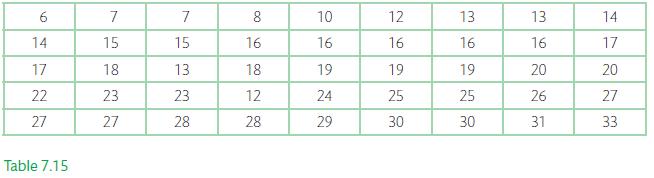
A leading business-training firm advertises in its promotional material that its class sizes at its Paris branch are no greater than 25. Recently, the firm has received a number of complaints from disgruntled students who have complained that class sizes are >25 for a majority of its courses in
The Wilcoxon paired ranks test is considered to be more powerful than the sign test. Explain why.
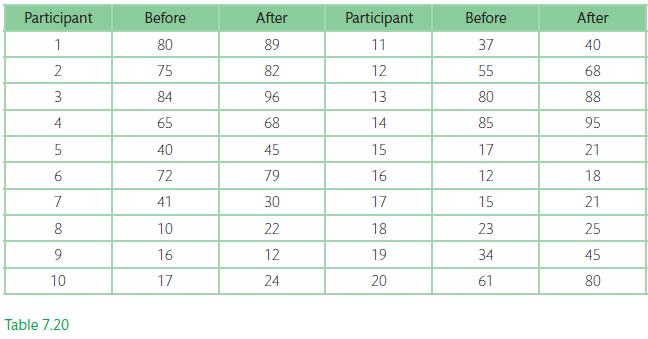
A company is planning to introduce new packaging for a product that has used the same packing for over 20 years. Before it makes a decision on the new packaging it decides to ask a panel of 20 participants to rate the current and proposed packaging (using a rating scale of do not change 0–change
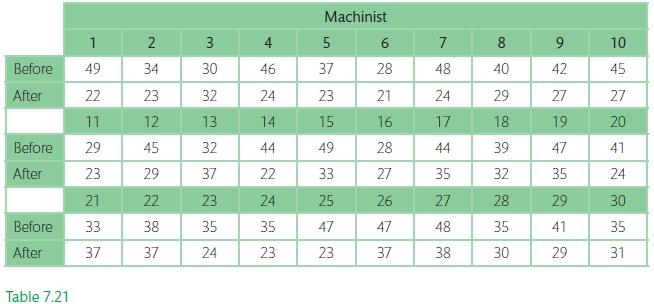
A local manufacturer is concerned at the number of errors made by machinists in the production of kites for a multinational retail company. To reduce the number of errors being made the company decides to retrain all staff in a new set of procedures to minimize the problem. To assess whether the
What assumptions need to be made about the type and distribution of the data when the Mann–Whitney test is used?
Two groups of randomly-selected students are tested on a regular basis as part of professional appraisals that are conducted on a two-year cycle by a leading financial services company based in London. The first group has 8 students, with their sum of the ranks equal to 65, and the second group has
The sale of new homes is tied closely to the level of confidence within the financial markets. A developer builds new homes in two European countries (A and B) and is concerned that there is a direct relationship between the country and the interest rates obtainable to build properties. To provide
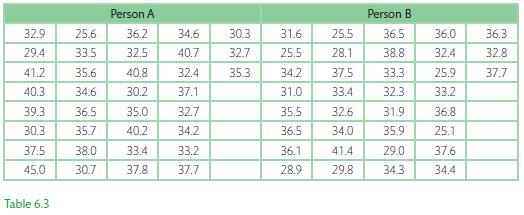
The Indian restaurant manager has employed two new delivery drivers and wishes to assess their performance. The data in Table 6.3 represent the delivery times for person A and B undertaken on the same day.Based upon your analysis of the two samples is there any evidence that the delivery times are
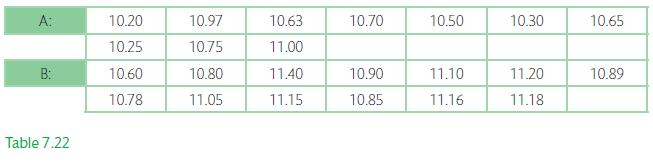
In this example we will use the F test to check if the two population variances in Example 6.7 can be considered equal with a 95% confidence.Data from Example 6.7A certain product of organic beans are packed in tins and sold by two local shops. The local authority have received complaints from
Reconsider Example 6.13, but use the Data Analysis tool to undertake the analysis.Data from Example 6.13In this example we will use the F test to check if the two population variances in Example 6.7 can be considered equal with a 95% confidence.Data from Example 6.7A certain product of organic
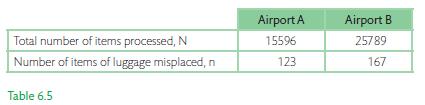
A national airline keeps a record of luggage misplaced at two European airports during one week in the summer of 2006. The sample results are illustrated in Table 6.5Assess whether there is a significant difference in misplaced luggage between the two airports (test at 5%). Total number of items
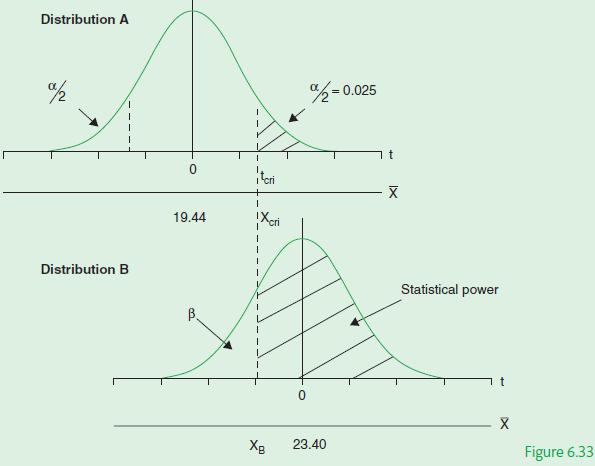
Let us illustrate the calculation of the type II error (β) and the statistical power via a simple example. Consider the problem of estimating the spend on a particular type of sweet per day where, historically, the average spend is £19.44 per day with a standard deviation of £6.23. The shop
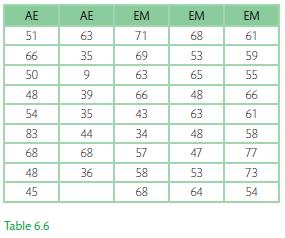
During an examination board concerns were raised concerning the marks obtained by students sitting the final year advanced economics (AE) and e-Marketing (EM) papers (Table 6.6).Historically, the sample data varies as a normal distribution and the population standard deviations are approximately
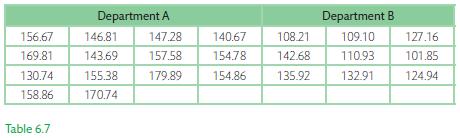
A university finance department would like to compare the travel expenses claimed by staff attending conferences. After initial data analysis the finance director has identified two departments who seem to have very different levels of claims. Based upon the data provided (Table 6.7), undertake a
Repeat Exercise X6.15, but do not assume equal variances. Are the two sets of results significantly different (test at 5%)?Data from Exercises 6.15During an examination board concerns were raised concerning the marks obtained by students sitting the final year advanced economics (AE) and
Repeat Exercise X6.16, but do not assume equal variances. Are the expenses claimed by department A significantly different to department B?Data from Exercises 6.16A university finance department would like to compare the travel expenses claimed by staff attending conferences. After initial data
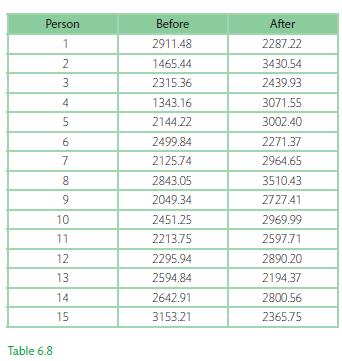
Choko Ltd provides training to its salespeople to aid the ability of each salesperson to increase the value of their sales. During the last training session 15 salespeople attended, and their weekly sales before and sales after are provided in Table 6.8.Assuming that the populations are normally
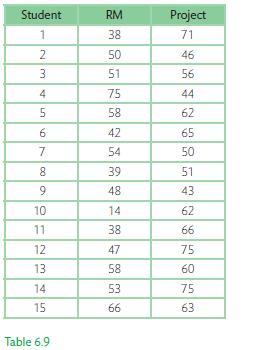
Concern has been raised at the standard achieved by students completing final year project reports within a university department. One of the factors identified as important is the research methods (RM) module mark achieved, which is studied before the students start their project. The department
In Exercise X6.15 we assumed that the two population variances are equal. Conduct an appropriate test to check if the variances are equal (test at 5% and 1%).Data from Exercises 6.15During an examination board concerns were raised concerning the marks obtained by students sitting the final year
In Exercise X6.16 we assumed that the two population variances are equal. Conduct an appropriate test to check if the variances are equal (test at 5%).Data from Exercises 6.16A university finance department would like to compare the travel expenses claimed by staff attending conferences. After
Generate a random sample of 100 observations from a normal distribution with a mean of 10 and a standard deviation of 4. Calculate the sample mean and standard deviation. Why are these values different from the population values?
A local authority installs 2000 electric lamps. The life of lamps in hours (X) follows a normal distribution, where X ~ N (1000, 40,000). Calculate: (a) The number of lamps that might be expected to fail within the first 700 hours; (b) The number of lamps that may be expected to fail between 900
Use the NORM.S.DIST () function to calculate the following probabilities, X ~ N(100, 25): (a) P(X ≤ 95); (b) P(95 ≤ X ≤ 105);(c) P(105 ≤ X ≤ 115); (d) P(93 ≤ X ≤ 99). In each case convert X to Z. Compare with your answers from Exercise X4.1.Data from Exercises 4.1Use the NORM.DIST
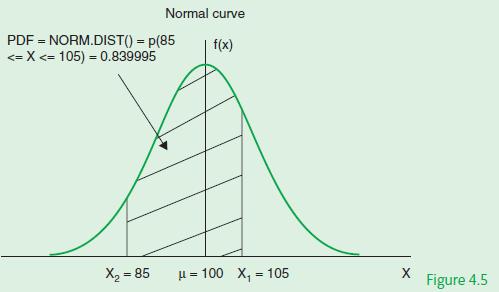
Calculate the probability that X lies between 85 and 105 cm for the problem outlined in Example 4.1.In this example we are required to calculate P (85 ≤ X ≤ 105) which represents the area shaded in Figure 4.5.The value of P (85 ≤ X ≤ 105) can be calculated using Excel’s NORM.DIST ()
CoCo S. A. is concerned at the time taken to react to customer complaints and have implemented a new set of procedures for its support centre staff . The customer service director plans to reduce the mean time for responding to customer complaints to 28 days and has collected the sample data given
Consider two events, A and B, where the associated probabilities are as follows:P(A or B) = 3/4, P(B) = 3/8 and n(A) = 4. Calculate P(A and B) if the total sample size is eight.
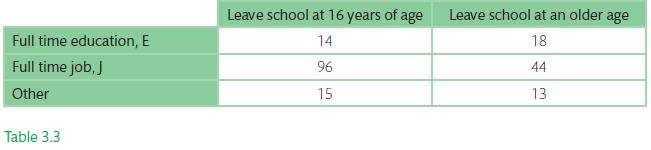
Consider Table 3.3 in X3.7.(a) Are the events E and J mutually exclusive?(b) Determine P(E and J).(c) Using the values of P(E), P( J), and P(E and J) you have already determined in X3.7, evaluate P(E) + P( J). What do you notice when you compare your answer with P(E or J)?Data from X3.7Table 3.3
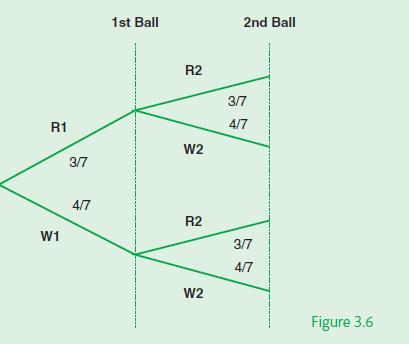
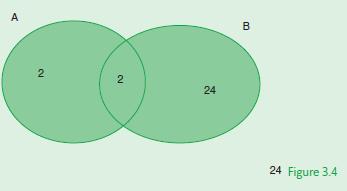
A bag contains three red and four white balls.If one ball is taken at random and then replaced, and another ball is taken calculate the following probabilities:(a) P(first ball red and second ball red)(b) P(just one red)(c) P(second ball white).Figure 3.6 displays the experiment in a tree
Consider two events A and B which contain all sample points with P(A and B) = 1/4 and P(A/B) = 1/3. Calculate (a) P(B), (b) P(A), (c) P(B/A).
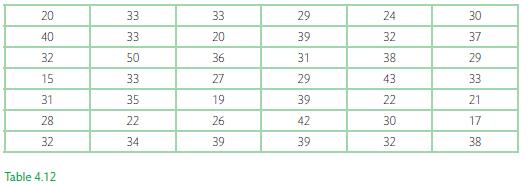
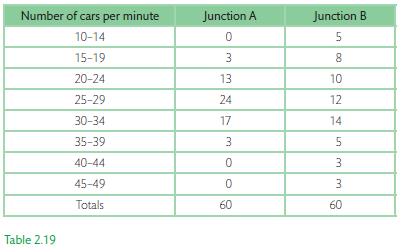
In a debate on the alteration of a traffic system in the city centre, measurements of the number of cars per minute were taken at two junctions; the results were as shown in Table 2.19.Compare the two distributions by plotting out their frequency polygons, and determine the means and standard
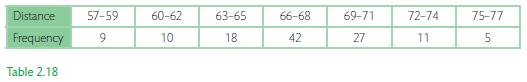
In a number of towns the distance of 1 sample of 122 supermarkets from the towns’ high street was measured to the nearest metre (Table 2.18).Determine the range, mean, and standard deviation. Distance Frequency Table 2.18 57-59 9 60-62 10 63-65 18 66-68 42 69-71 27 72-74 11 75-77 5
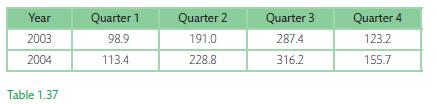
Obtain a scatter plot for the data in Table 1.37 that represents the passenger miles flown by a UK-based airline (millions of passenger miles) during the period 2003–2004.Comment on the relationship between miles flown and quarter. Year 2003 2004 Table 1.37 Quarter 1 98.9 113.4 Quarter
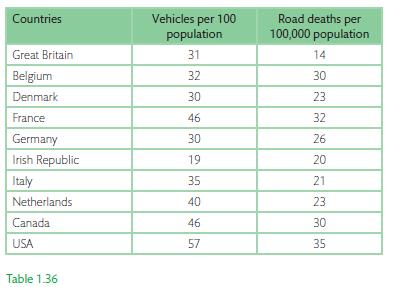
Obtain a scatter plot for the data in Table 1.36 and comment on whether there is a link between road deaths and the number of vehicles on the road. Would you expect this to be true? Provide reasons for your answer. Countries Great Britain Belgium Denmark France Germany Irish
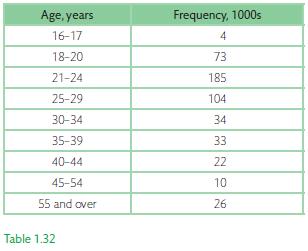
Create a frequency polygon (line graph) for the data in Table 1.32 Age, years 16-17 18-20 21-24 25-29 30-34 35-39 40-44 45-54 55 and over Table 1.32 Frequency, 1000s 4 73 185 104 34 33 22 10 26
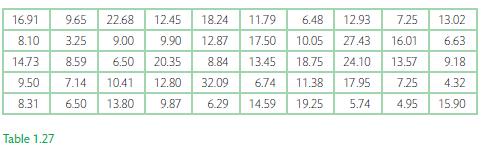
Create a suitable histogram to represent the spending on extracurricular activities for a random sample of university students during the ninth week of the first term (Table 1.27). 16.91 8.10 14.73 9.50 8.31 Table 1.27 6.48 12.93 7.25 13.02 12.87 17.50 10.05 27.43 16.01 6.63 13.45 18.75 24.10
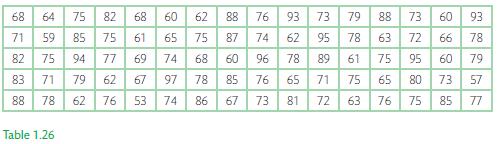
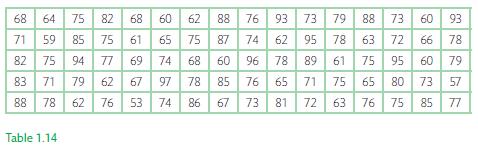
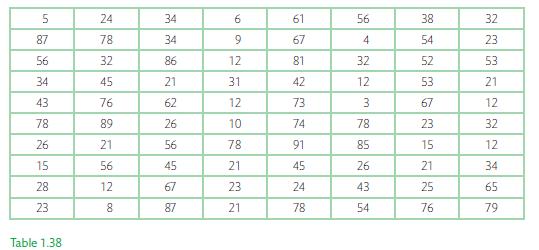
Create a suitable histogram to represent the number of customers visited by a sales man over an 80-week period (Table 1.26). 68 71 82 83 88 5459757 78 75 85 84 7952 西刀75 64 71 Table 1.26 94 82 68 60 62 88 76 93 73 79 88 74 62 95 78 96 78 89 61 76 65 71 75 73 81 72 63 61 65 75 87 77 69 74 68
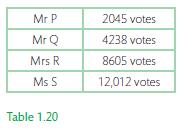
The results of the voting in an election are shown in Table 1.20.Represent this information on a pie chart. Mr P Mr Q Mrs R Ms S Table 1.20 2045 votes 4238 votes 8605 votes 12,012 votes
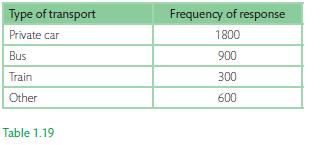
Three thousand six hundred people who work in Bradford were asked about the means of transport that they used for daily commuting. The data collected is shown in Table 1.19.Construct a pie chart to represent this data. Type of transport Private car Bus Train Other Table 1.19 Frequency of
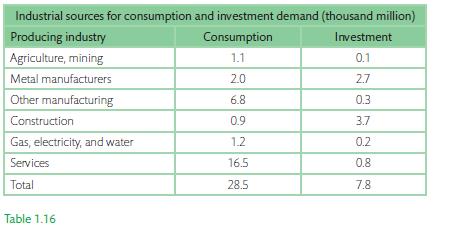
Draw a suitable bar chart for the data in Table 1.16. Industrial sources for consumption and investment demand (thousand million) Producing industry Agriculture, mining Metal manufacturers Other manufacturing Construction Gas, electricity, and water Services Total Table
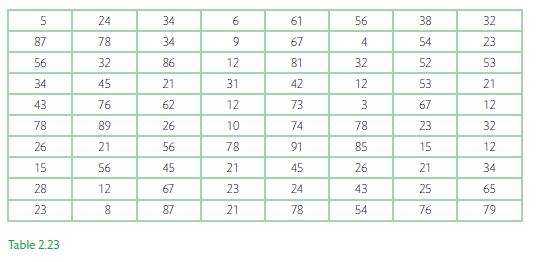
Table 1.14 represents the number of customers visited by a salesman over an 80-week periodUse Excel to construct a grouped frequency distribution from the data set in Table 1.14 and indicate both stated and mathematical limits (start at 50–54 with class width of 5). 68 54 59 64 75 82 71 82 83 71
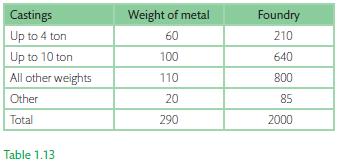
Criticize Table 1.13. Castings Up to 4 ton Up to 10 ton All other weights Other Total Table 1.13 Weight of metal 60 100 110 20 290 Foundry 210 640 800 85 2000
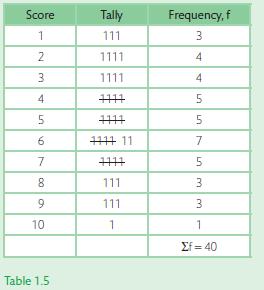
Consider the set of data that represents the number of insurance claims processed each day by an insurance fi rm over a period of 40 days: 3, 5, 9, 6, 4, 7, 8, 6, 2, 5, 10, 1, 6, 3, 6, 5, 4, 7, 8, 4, 5, 9, 4, 2, 7, 6, 1, 3, 5, 6, 2, 6, 4, 8, 3, 1, 7, 9, 7 and 2.The frequency distribution can be
Coco S.A. supplies a range of computer hardware and software to 2000 schools within a large municipal region of Germany. When Coco S.A. won the contract the issue of customer service was considered to be central to the company being successful at the final bidding stage.The company has now
Bakers Ltd run a chain of bakery shops and is famous for the quality of its pies. The management of the company is concerned at the number of complaints from customers who say it takes too long to serve customers at a particular branch. The motto of the company is ‘Have your pie in two
Skodel Ltd is a small brewery that is undergoing a major expansion after a takeover by a large European brewery chain. Skodel Ltd produces a range of beers and lagers, and is renowned for the quality of its beers, winning a number of prizes at trade fairs throughout the European Union. The new
Reconsider Example 2.1 to calculate the twenty-fifth percentile and quartile values.Data from Example 2.1Suppose the marks obtained in the statistics examination are as illustrated in Table 2.1.We can describe the overall performance of these 13 students by calculating an ‘average’ score using
Coco S.A. supplies a range of computer hardware and software to 2000 schools within a large municipal region of Spain. When Coco S.A. won the contract the issue of customer service was considered to be central to the company being successful at the final bidding stage.The company has now requested
In 12 consecutive innings a batman’s scores were: 6, 13, 16, 45, 93, 0, 62, 87, 136, 25, 14, and 31. Find his mean score and the median.
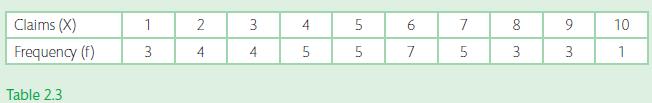
The distribution of insurance claims processed each day is presented in Table 2.3.Calculate the mean, mode, and median. Claims (X) Frequency (f) Table 2.3 1 3 2 4 3 4 LO 5 5 5 6 7 7 5 8 3 9 3 10 1
Bakers Ltd run a chain of bakery shops and is famous for the quality of its pies. The management of the company is concerned at the number of complaints from customers who say it takes too long to serve customers at a particular branch. The motto of the company is ‘Have your pie in two
The following are the IQs of 12 people: 115, 89, 94, 107, 98, 87, 99, 120, 100, 94, 100, 99. It is claimed that ‘the average person in the group has an IQ of over 100’. Is this a reasonable assertion?
Skodel Ltd is a small brewery that is undergoing a major expansion after a takeover by a large European brewery chain. Skodel Ltd produces a range of beers and lagers, and is renowned for the quality of its beers, winning a number of prizes at trade fairs throughout the European Union. The new
Suppose that Karen’s statistics module is assessed via a series of assessments (multiple choice questions—mcq, in-course assignment—ica, end assignment—ea) with a weighting of 20%, 30%, and 50% respectively. The actual marks awarded were 74, 66, and 88. Calculate the weighted average.
Reconsider Example 2.1 and calculate measures of dispersion (or spread) of the statistics examination marks presented in Table 2.13.Data from Example 2.1Suppose the marks obtained in the statistics examination are as illustrated in Table 2.1.We can describe the overall performance of these 13
A sample of six components was tested to destruction to establish how long they would last. The times to failure (in hours) during testing were 40, 44, 55, 55, 64, and 69. Which would be the most appropriate average to describe the life of these components? What are the consequences of your choice?
Find the mean, median, and mode of the following set of data: 1, 1, 1, 1, 1, 2, 2, 2, 2, 2, 2, 3, 3, 3, 3, 3, 4, 4, 4, 4, 5, 5, 5, 5, 5.
Cameos Ltd is employed by a leading market research organization based in Berlin. The company is discussing with the firm whether to expand the catering facilities provided to its employees to include a greater range of products. The initial research by Cameos has identified the following set of
The average salary paid to graduates in three companies is: £7000, £6000, and £9000 per annum respectively. If the respective number of graduates in these companies is 5, 12, and 3, fi nd the mean salary paid to the 20 graduates.
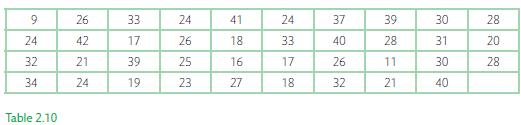
Form a frequency distribution of the following data given in Table 2.10 with intervals centred at 10, 15, 20, 25, 30, 35, and 40, and estimate the mean value. 9 24 32 34 Table 2.10 26 42 21 24 33 17 39 19 24 26 25 23 41 18 16 27 24 33 17 18 37 40 26 32 39 28 11 21 30 31 30 40 28 20 28
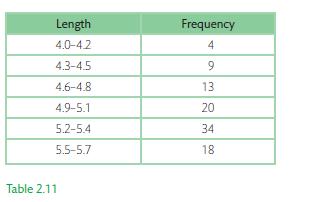
The frequency distribution of the length of a sample of 98 nails is presented in Table 2.11 (measured to the nearest 0.1 mm).(a) Find the mean length of this sample by hand and by using a spreadsheet.(b) Construct the cumulative frequency graph and use this to estimate the median.(c) Check the
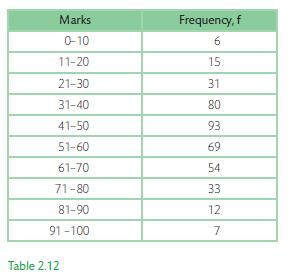
The distribution of marks of 400 candidates in an A-level examination is presented in Table 2.12.(a) Calculate the mean value.(b) Construct the cumulative frequency curve and estimate the median, fi rst, and third quartile values.
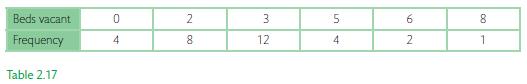
Over a one-month period the number of vacant beds in a West Yorkshire hospital was surveyed. The frequency distribution in Table 2.17 resulted.Determine the mean and standard deviation. Beds vacant Frequency Table 2.17 0 4 N80 2 3 12 5 4 Na 6 2 8 1
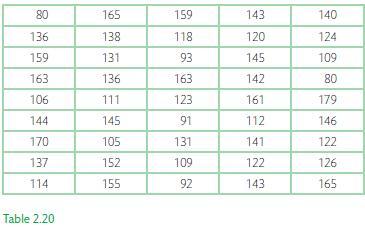
Greendelivery.com has recently decided to review the weekly mileage of the delivery vehicles used to deliver shopping purchased online to customer homes from a central parcel depot. The sample data collected (Table 2.20) is part of the first stage in analysing the economic benefit of potentially
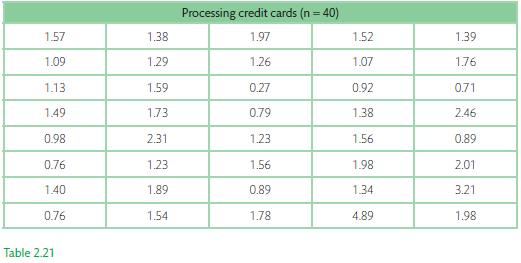
The manager at BIG JIMS restaurant is concerned about the time it takes to process credit card payments at the counter by counter staff . The manager has collected the following processing time data (time in minutes/seconds) (Table 2.21) and requested that summary statistics are calculated.(a)
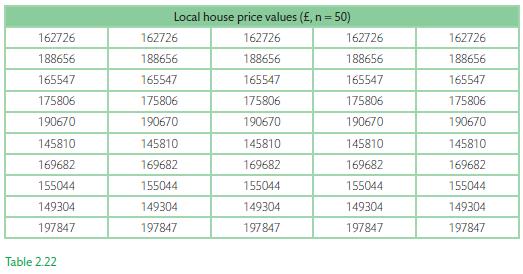
The local regional development agency is conducting a major review of the economic development of a local community. One economic measure to be collected is the local house prices that reflect on the economic well-being of this community. The development agency have collected the following house
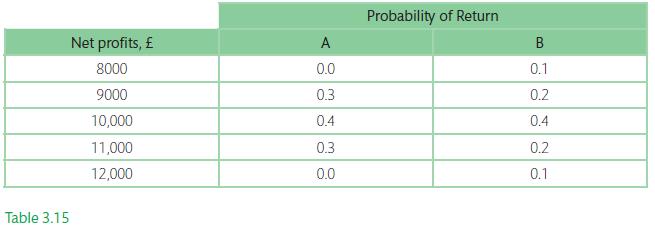
CoCo S.A. are considering putting money into one of two investments, A and B. The net profits for identical periods and probabilities of success for investments A and B are given in Table 3.15.(a) Which investment yields a higher net profit?(b) Can you make a decision on which investment is better,
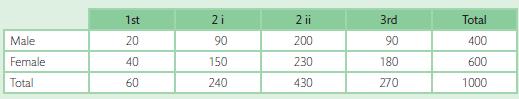
Over the last 3 years a random sample of 1000 students was selected and classified according to degree classification and gender. The results were as recorded in Table 3.2.Calculate: (a) The probability that a student achieves a 2i and is female; (b) The probability that a student achieves a 2i
Give an appropriate sample space for each of the following experiments:(a) A card is chosen at random from a pack of cards (b) A person is chosen at random from a group containing five females and six males (c) A football team records the results of each of two games as ‘win’, ‘draw’, or
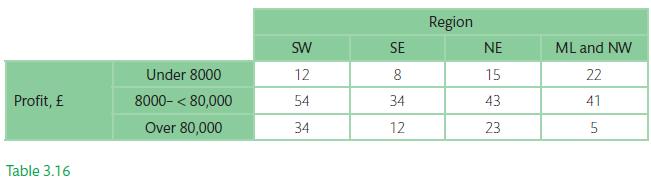
Bakers Ltd currently has 303 shops across the UK. Table 3.16 describes the location of each shop within one of four regions (SW, SE, NE, and ML and NW) and the level of shop profit.As part of Bakers Ltd financial quality control initiative the company select a shop at random and undertake a
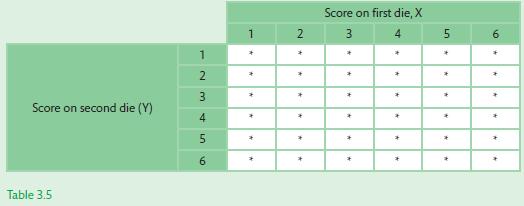
An experiment consists of throwing two dice and noting their two scores. The sample space could be shown as illustrated in Table 3.5.From this sample space calculate the following theoretical probabilities to three decimal places: (a) P(X = Y); (b) P(X + Y = 5); (c) P(X * Y = 36); (d) P(X 2).
For the respective sample spaces given in X3.1 indicate the outcomes that constitute the following events:(a) A queen is chosen(b) A female is chosen(c) A football team draws at least once.Data from X3.1Give an appropriate sample space for each of the following experiments:A card is chosen at
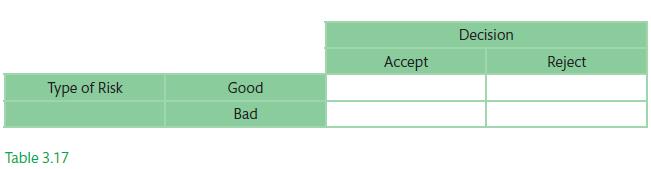
The Skodel Ltd credit manager knows from past experience that if the company accepts a ‘good risk’ applicant for a £60,000 loan the profit will be £15,000. If it accepts a ‘bad risk’ applicant it will lose £6000. If it rejects a ‘bad risk’ applicant nothing is gained or lost. If it
A card is chosen from an ordinary pack of cards. Write down the probabilities that the card is:(a) Black and an ace, (b) Black or an ace, (c) Neither black nor an ace. Let event A and B represent the events obtaining an ace card and B a black card respectively. The sample space is represented
A group of males and females over the age of 16 years; one is chosen at random. State which pair of events is mutually exclusive?(a) Being a male and being aged 21 years or older (b) Being a male and being a female.
A dart is thrown at a board and is likely to land on any one of eight squares numbered 1–8 inclusive. A represents the event the dart lands in square 5 or 8. B represents the event the dart lands in square 2, 3, or 4. C represents the event the dart lands in square 1, 2, 5 or 6. Which two events
How would you give an estimate of the probability of a 25-year-old passing a driving test at a first attempt?
Table 3.3 provides information about 200 school leavers and their destination after leaving school.Determine the probabilities that a person, selected at random:(a) Went into full-time education(b) Went into a full-time job(c) Either went into full-time education or went into a full-time job(d)
In an experiment we toss two unbiased coins 100 times and note the frequency of the two possible outcomes (heads, tails). We are interested in calculating the probability (or chance) that at least 1 head will occur from the 100 tosses of the 2 coins. Calculate:(a) The theoretical probability that
An unbiased coin and a fair die are tossed together. What is the probability of obtaining a head and a 6?
Calculate the following probabilities if two unbiased dice are tossed: (a) The probability of a 3 on the first die and 5 on the second die = P(3, 5); (b) The probability of a 3 on the first die and 5 on the second die = P(3 and 5); (c) The probability of a 3 on the first die or 5 on the second
Showing 2700 - 2800
of 2900
First
15
16
17
18
19
20
21
22
23
24
25
26
27
28
29
Step by Step Answers