New Semester
Started
Get
50% OFF
Study Help!
--h --m --s
Claim Now
Question Answers
Textbooks
Find textbooks, questions and answers
Oops, something went wrong!
Change your search query and then try again
S
Books
FREE
Study Help
Expert Questions
Accounting
General Management
Mathematics
Finance
Organizational Behaviour
Law
Physics
Operating System
Management Leadership
Sociology
Programming
Marketing
Database
Computer Network
Economics
Textbooks Solutions
Accounting
Managerial Accounting
Management Leadership
Cost Accounting
Statistics
Business Law
Corporate Finance
Finance
Economics
Auditing
Tutors
Online Tutors
Find a Tutor
Hire a Tutor
Become a Tutor
AI Tutor
AI Study Planner
NEW
Sell Books
Search
Search
Sign In
Register
study help
business
elementary statistics
Elementary Statistics 3rd Edition William Navidi, Barry Monk - Solutions
A real estate agent believes that the mean size of houses in a certain city is greater than 1500 square feet.He samples 100 houses, and performs a test of H0: μ = 1500 versus H1: μ > 1500. He obtains a P-value of 0.0002.a. The real estate agent concludes that because the P-value is very small,
The manufacturer of a medication designed to lower blood pressure claims that the mean systolic blood pressure for people taking their medication is less than 135.To test this claim, blood pressure is measured for a sample of 500 people who are taking the medication. The P-value for testing H0: μ
When the sample size is large, some people treat the sample standard deviation s as if it were the population standard deviation σ, and use the standard normal distribution rather than the Student’s t distribution, to find a critical value. Assume that a right-tailed test will be made with a
The Pew Research Center reported that only 15% of 18- to 24-year-olds read a daily newspaper. The publisher of a local newspaper wants to know whether the percentage of newspaper readers among students at a nearby large university differs from the percentage among 18- to 24-year-olds in general.
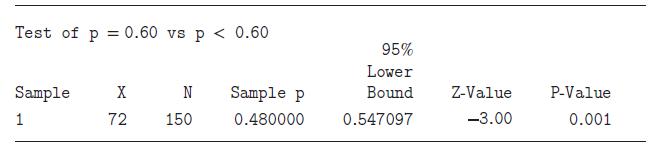
The following output from MINITAB presents the results of a hypothesis test.a. What are the null and alternate hypotheses?b. What is the sample size?c. What is the value of ̂p?d. What is the value of the test statistic?e. Do you reject H0 at the 0.05 level?f. Do you reject H0 at the 0.01 level?
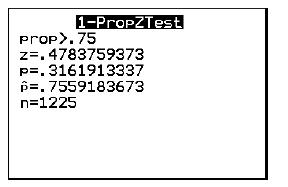
The following display from a TI-84 Plus calculator presents the results of a hypothesis test.a. What are the null and alternate hypotheses?b. What is the sample size?c. What is the value of ̂p?d. What is the value of the test statistic?e. Do you reject H0 at the 0.05 level?f. Do you reject H0 at
A Gallup poll sampled 1000 adults in the United States. Of these people, 770 said they enjoyed situations in which they competed with other people. Can you conclude that less than 80% of U.S. adults like to compete? Use the critical value method with significance level α = 0.05.a. State the null
To test H0: p = p0 with the methods in this section, the values np0 and n(1 − p0) must both be at least _______________ .In Exercises 5 and 6, fill in each blank with the appropriate word or phrase.
To test H0: p = p0 with the methods in this section, the population size must be at least ______________ times as large as the sample size.In Exercises 5 and 6, fill in each blank with the appropriate word or phrase.
When testing a hypothesis for a proportion, we assume that the items in the population are divided into two categories.In Exercises 7 and 8, determine whether the statement is true or false. If the statement is false, rewrite it as a true statement.
When testing a hypothesis for a proportion, the alternate hypothesis is always two-tailed.In Exercises 7 and 8, determine whether the statement is true or false. If the statement is false, rewrite it as a true statement.
In a simple random sample of size 80, there were 54 individuals in the category of interest.a. Compute the sample proportion ̂p.b. Are the assumptions for a hypothesis test satisfied?Explain.c. It is desired to test H0: p = 0.8 versus H1: p < 0.8. Compute the test statistic z.d. Do you reject H0
In a simple random sample of size 60, there were 38 individuals in the category of interest.a. Compute the sample proportion ̂p.b. Are the assumptions for a hypothesis test satisfied?Explain.c. It is desired to test H0: p = 0.7 versus H1: p ≠ 0.7. Compute the test statistic z.d. Do you reject H0
In a simple random sample of size 75, there were 42 individuals in the category of interest.a. Compute the sample proportion ̂p.b. Are the assumptions for a hypothesis test satisfied?Explain.c. It is desired to test H0: p = 0.6 versus H1: p ≠ 0.6. Compute the test statistic z.d. Do you reject H0
In a simple random sample of size 150, there were 90 individuals in the category of interest.a. Compute the sample proportion ̂p.b. Are the assumptions for a hypothesis test satisfied?Explain.c. It is desired to test H0: p = 0.5 versus H1: p > 0.5. Compute the test statistic z.d. Do you reject H0
According to Secure List, 71.8% of all email sent is spam. A system manager at a large corporation believes that the percentage at his company may be 80%. He examines a random sample of 500 emails received at an email server, and finds that 382 of the messages are spam.a. State the appropriate null
A poll conducted by the General Social Survey asked a random sample of 1325 adults in the United States how much confidence they had in banks and other financial institutions. A total of 149 adults said that they had a great deal of confidence. An economist claims that less than 15% of U.S. adults
A marketing manager for a cell phone company claims that more than 55% of children aged 8–12 have cell phones. In a survey of 802 children aged 8–12 by the National Consumers League, 449 of them had cell phones. Can you conclude that the manager’s claim is true? Use the α = 0.01 level of
The Gallup Poll asked 1015 U.S. adults whether they believed that people should pay sales tax on items purchased over the Internet. Of these, 437 said they supported such a tax. Does the survey provide convincing evidence that less than 45% of U.S. adults favor an Internet sales tax? Use the α =
In a survey of 444 HIV-positive smokers, 170 reported that they had used a nicotine patch to try to quit smoking. Can you conclude that less than half of HIV-positive smokers have used a nicotine patch? Use the α = 0.05 level of significance.
A poll taken by the Software Usability Research Laboratory surveyed 341 video gamers, and 110 of them said that they prefer playing games on a console, rather than a computer or hand-held device. An executive at a game console manufacturing company claims that more than 25% of gamers prefer
A Harris poll taken surveyed 2016 adults and found that 423 of them had one or more tattoos. Can you conclude that the percentage of adults who have a tattoo is less than 25%? Use the α = 0.01 level of significance.
Vertical banded gastroplasty is a surgical procedure that reduces the volume of the stomach in order to produce weight loss. In a recent study, 82 patients with Type 2 diabetes underwent this procedure, and 59 of them experienced a recovery from diabetes. Does this study provide convincing evidence
An article in Forbes magazine reported that 73%of Fortune 500 companies have Twitter accounts. A economist thinks the percentage is higher at technology companies. She samples 70 technology companies and finds that 55 of them have Twitter accounts. Can she conclude that more than 73% of technology
A Pew poll surveyed 1802 Internet users and found that 829 of them had posted a photo or video online. Can you conclude that less than half of Internet users have posted photos or videos online? Use the α = 0.05 level of significance.
Which do patients value more when choosing a doctor: interpersonal skills or technical ability? In a recent study, 304 people were asked to choose a physician based on two hypothetical descriptions. One physician was described as having high technical skills and average interpersonal skills, and
A telecommunications company provided its cable TV subscribers with free access to a new sports channel for a period of one month. It then chose a sample of 400 television viewers and asked them whether they would be willing to pay an extra $10 per month to continue to access the channel. A total
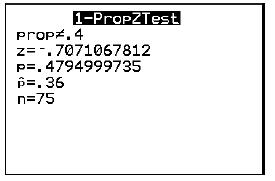
In a recent poll, people were asked whether they supported an increase in the sales tax. The following display from a TI-84 Plus calculator presents the results of a hypothesis test regarding the proportion of individuals who said they supported an increase in the sales tax.a. What are the null and
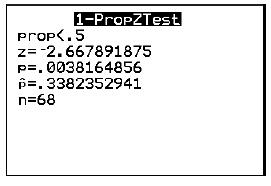
A sample of mothers was asked how old they were when their first child was born. The following display from a TI-84 Plus calculator presents the results of a hypothesis test regarding the proportion who had their first child before the age of 24.a. What are the null and alternate hypotheses?b. What
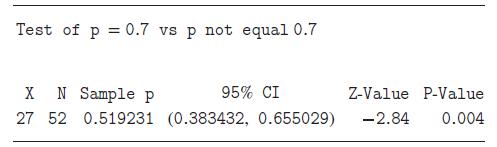
A sample of college students was asked whether they had a job outside of school. The following MINITAB output presents the results of a hypothesis test regarding the proportion of college students who have a job outside of school.a. What are the null and alternate hypotheses?b. What is the value of
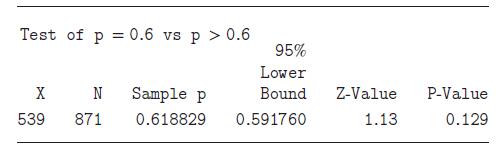
A sample of adults was asked whether they were interested in economic issues. The following MINITAB output presents the results of a hypothesis test regarding the proportion who said they were interested in economic issues.a. What are the null and alternate hypotheses?b. What is the value of the
A simple random sample of 500 students at a certain college were surveyed and asked whether they were satisfied with college life. Two hundred eighty of them replied that they were satisfied. The Dean of Students claims that more than half of the students at the college are satisfied. To test this
A simple random sample of 1500 voters were surveyed and asked whether they were planning to vote for the incumbent mayor for re-election. Seven hundred ninety-eight of them replied that they were planning to vote for the mayor. The mayor claims that more than half of all voters are planning to vote
A few weeks before election day, a TV station broadcast a debate between the two leading candidates for governor. Viewers were invited to send a tweet to indicate which candidate they plan to vote for. A total of 3125 people tweeted, and 1800 of them said that they planned to vote for candidate A.
Over the past 100 days, the price of a certain stock went up on 60 days and went down on 40 days. Explain why these data should not be used to test the claim that this stock price goes down on less than half of the days.
When np0 < 10 or n(1 − p0) < 10, we cannot use the normal approximation, but we can use the binomial distribution to perform what is known as an exact test. Let p be the probability that a given coin lands heads. The coin is tossed 10 times and comes up heads 9 times. Test H0: p = 0.5 versus H1:
A random sample of size 20 from a normal distribution has standard deviation s = 50.Test H0 : σ = 45 versus H1: σ > 45 at the α = 0.05 level. Do you reject H0?
A random sample of size 12 from a normal distribution has standard deviation s = 7.Test H0 : σ = 15 versus H1: σ < 15 at the α = 0.01 level. Do you reject H0?
A random sample of size 28 from a normal distribution has standard deviation s = 5.Test H0 : σ = 3 versus H1: σ ≠ 3 at the α = 0.01 level. Do you reject H0?
A random sample of size 5 from a normal distribution has standard deviation s = 28.Test H0 : σ = 40 versus H1: σ ≠ 40 at the α = 0.05 level. Do you reject H0?
To test a hypothesis about a standard deviation using a sample of size 15, we use a chi-square distribution with ___________________ degrees of freedom.In Exercises 5 and 6, fill in each blank with the appropriate word or phrase.
The method described for testing hypotheses about standard deviations should be used only when the distribution of the population is almost exactly ___________________ .In Exercises 5 and 6, fill in each blank with the appropriate word or phrase.
When a test for a standard deviation is performed, it does not matter whether the population is normal, so long as the sample is large.In Exercises 7 and 8, determine whether the statement is true or false. If the statement is false, rewrite it as a true statement.
Hypothesis tests for a standard deviation may be either one- or two-tailed.In Exercises 7 and 8, determine whether the statement is true or false. If the statement is false, rewrite it as a true statement.
A random sample of size 11 from a normal distribution has standard deviation s = 98.Test H0: σ = 70 versus H1: σ > 70.Use the α = 0.05 level of significance.
A random sample of size 29 from a normal distribution has standard deviation s = 49.Test H0: σ = 55 versus H1: σ < 55.Use the α = 0.01 level of significance.
A random sample of size 24 from a normal distribution has standard deviation s = 29.Test H0: σ = 35 versus H1: σ < 35.Use the α = 0.01 level of significance.
A random sample of size 13 from a normal distribution has standard deviation s = 83.Test H0: σ = 60 versus H1: σ > 60.Use the α = 0.05 level of significance.
A random sample of size 25 from a normal distribution has standard deviation s = 51.Test H0: σ = 30 versus H1: σ ≠ 30.Use the α = 0.05 level of significance.
A random sample of size 8 from a normal distribution has standard deviation s = 75.Test H0: σ = 50 versus H1: σ ≠ 50.Use the α = 0.01 level of significance.
A sample of 25 one-year-old girls had a mean weight of 24.1 pounds with a standard deviation of 4.3 pounds.Assume that the population of weights is normally distributed.A pediatrician claims that the standard deviation of the weights of one-year-old girls is less than 5 pounds. Do the data provide
The General Social Survey asked a large number of people how much time they spent watching TV each day. The mean number of hours was 3.09 with a standard deviation of 2.87. Assume that in a sample of 40 teenagers, the sample standard deviation of daily TV time is 2.0 hours, and that the population
Scores on an IQ test are normally distributed.A sample of 25 IQ scores had standard deviation s = 8.The developer of the test claims that the population standard deviation is σ = 15.Do these data provide sufficient evidence to contradict this claim? Use the α = 0.05 level of significance.
Scores on the math SAT are normally distributed.A sample of 20 SAT scores had standard deviation s = 87.Someone says that the scoring system for the SAT is designed so that the population standard deviation will be σ = 100.Do these data provide sufficient evidence to contradict this claim?Use the
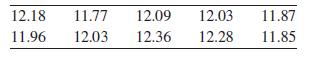
A machine that fills beverage cans is supposed to put 12 ounces of beverage in each can. The standard deviation of the amount in each can is 0.1 ounce.The machine is moved to a new location. To determine whether the standard deviation has changed, ten cans are filled.Following are the amounts in
One of the ways in which doctors try to determine how long a single dose of pain reliever will provide relief is to measure the drug’s half-life, which is the length of time it takes for one-half of the dose to be eliminated from the body. A report of the National Institutes of Health states that
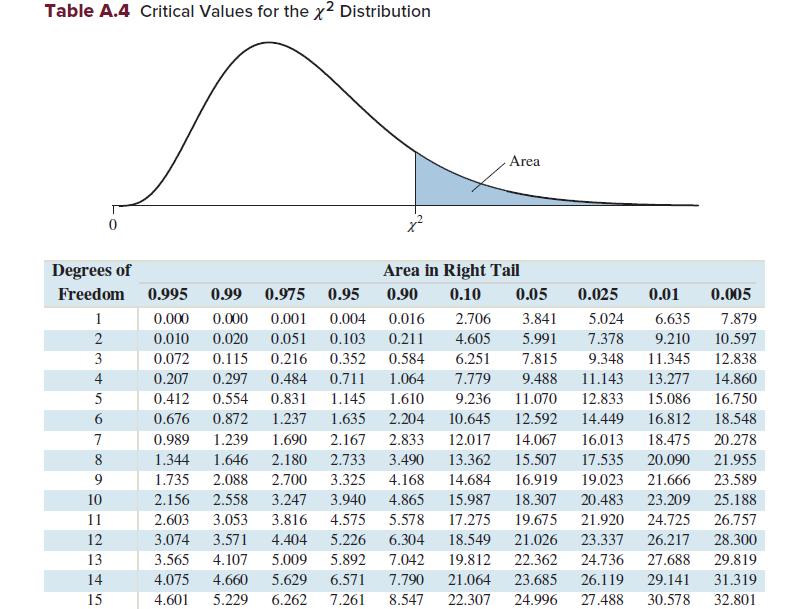
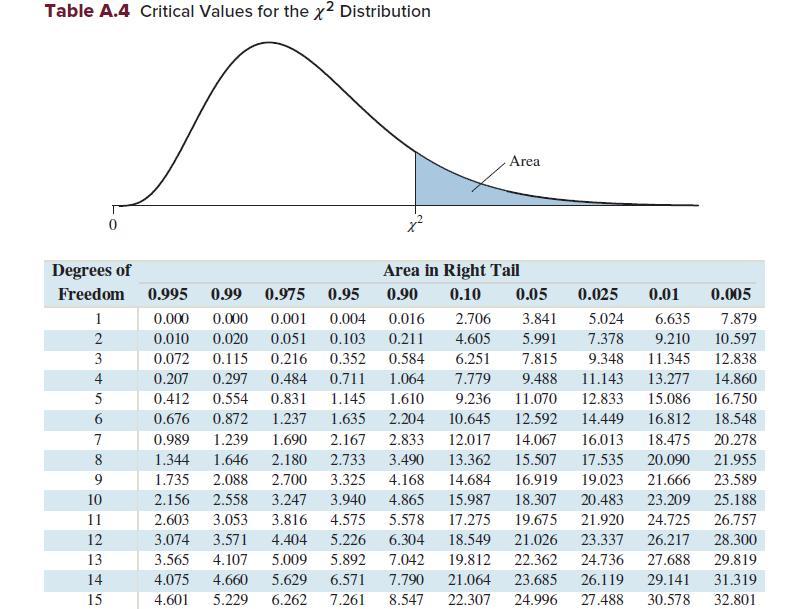
A sample of size 101 from a normal population has sample standard deviation s = 40.Use Table A.4 to find the exact critical values X2 0.025 and X2 0.975 to test H0: σ = 30 versus H1: σ ≠ 30.Can you reject H0 at the α = 0.05 level?A sample of size 101 from a normal population has sample
Refer to Exercise 21.Use the normal approximation to estimate the critical values X2 0.025 and X2 0.975. Using these critical values, can you reject H0 at theα = 0.05 level?A sample of size 101 from a normal population has sample standard deviation s = 40. Use Table A.4 to find the exact critical
Refer to Exercise 21.Use the more accurate normal approximation to estimate the critical values X2 0.025 and X2 0.975. Using these critical values, can you reject H0 at theα = 0.05 level?A more accurate normal approximation to X2α is given bywhere z???? is the z-score that has area α to its
A test is made of H0 : μ = 25 versus H1: μ < 25.The value of the test statistic is z = −1.84.a. Find the critical value and the critical region for a significance level ofα = 0.05.b. Do you reject H0 at the α = 0.05 level?c. Find the critical value and the critical region for a significance
A test is made of H0 : μ = 7.5 versus H1: μ > 7.5. The value of the test statistic is z = 2.71.a. Find the critical value and the critical region for a significance level ofα = 0.05.b. Do you reject H0 at the α = 0.05 level?c. Find the critical value and the critical region for a significance
A test is made of H0 : μ = 12 versus H1: μ ≠ 12.The value of the test statistic is z = 1.78.a. Find the critical value and the critical region for a significance level ofα = 0.05.b. Do you reject H0 at the α = 0.05 level?c. Find the critical value and the critical region for a significance
A test is made of H0 : μ = 15 versus H1: μ > 15.The sample mean is x̄ = 16.5, the sample size is n = 50, and the population standard deviation is σ = 5.a. Find the value of the test statistic z.b. Find the critical region for a level α = 0.05 test.c. Do you reject H0 at the α = 0.05 level?
A test is made of H0 : μ = 125 versus H1: μ < 125.The sample mean is x̄ = 123, the sample size is n = 100, and the population standard deviation is σ = 20.a. Find the value of the test statistic z.b. Find the critical region for a level α = 0.02 test.c. Do you reject H0 at the α = 0.02 level?
A test is made of H0 : μ = 100 versus H1: μ ≠ 100.The sample mean is x̄ = 97, the sample size is n = 75, and the population standard deviation is σ = 8.a. Find the value of the test statistic z.b. Find the critical region for a level α = 0.01 test.c. Do you reject H0 at the α = 0.01 level?
Which provides stronger evidence against H0: a P-value of 0.05 or a P-value of 0.50?
A test is made of H0 : μ = 30 versus H1: μ < 30.The test statistic is z = −1.28. Find and interpret the P-value.
A test is made of H0 : μ = 6 versus H1: μ ≠ 6.a. The test statistic is z = 0.75. Find and interpret the P-value.b. The test statistic is z = −2.20. Find and interpret the P-value.c. Which provides stronger evidence against H0 : z = 0.75 or z = −2.20?
If P = 0.02, which is the best conclusion?i. The probability that H0 is true is 0.02.ii. If H0 is true, the probability of obtaining a test statistic more extreme than the one actually observed is 0.02.iii. The probability that H1 is true is 0.02.iv. If H1 is true, the probability of obtaining a
A hypothesis test is performed with a significance level of α = 0.05.a. If the P-value is 0.08, is H0 rejected?b. If the P-value is 0.08, are the results statistically significant at the 0.05 level?c. If the P-value is 0.03, is H0 rejected?d. If the P-value is 0.03, are the results statistically
For each of the following P-values, state whether H0 will be rejected at the 0.10 level.a. P = 0.12b. P = 0.07c. P = 0.05d. P = 0.20
For each of the following P-values, state whether the result is statistically significant at the 0.10 level.a. P = 0.08b. P = 0.15c. P = 0.01d. P = 0.50
A social scientist suspects that the mean number of years of education μ for adults in a certain large city is greater than 12 years. She will test the null hypothesis H0 : μ =12 against the alternate hypothesis H1: μ > 12.She surveys a random sample of 100 adults and finds that the sample mean
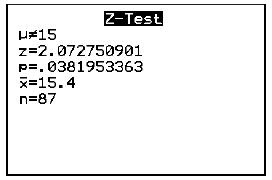
The following display from a TI-84 Plus calculator presents the results of a hypothesis test for a population mean.a. What are the null and alternate hypotheses?b. What is the value of the test statistic?c. What is the P-value?d. Do you reject H0 at the α = 0.05 level? #15 Z-Test z=2.072750901
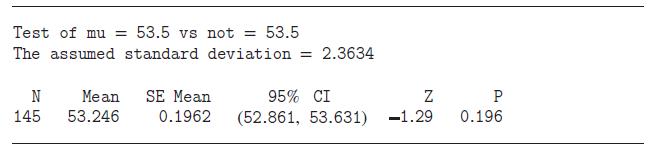
The following output from MINITAB presents the results of a hypothesis test for a population mean.a. What are the null and alternate hypotheses?b. What is the value of the test statistic?c. What is the P-value?d. Do you reject H0 at the α = 0.05 level? Test of mu = 53.5 vs not = 53.5 The assumed
A 95% confidence interval for μ is computed to be (1.75, 3.25). For each of the following hypotheses, state whether H0 will be rejected at the 0.05 level.a. H0 : μ = 3 versus H1: μ ≠ 3b. H0 : μ = 4 versus H1: μ ≠ 4c. H0 : μ = 1.7 versus H1: μ ≠ 1.7d. H0 : μ = 3.5 versus H1: μ ≠ 3.5
You want to test H0 : μ = 4 versus H1: μ ≠ 4, so you compute a 95% confidence interval for μ. The 95% confidence interval is 5.1 < μ < 7.2.a. Do you reject H0 at the α = 0.05 level?b. Your friend thinks that α = 0.01 is a more appropriate significance level. Can you tell from the confidence
A hypothesis test is performed at a significance level α = 0.05. What is the probability of a Type I error?
Charlie will perform a hypothesis test at the α = 0.05 level. Felice will perform the same test at the α = 0.01 level.a. If H0 is true, who has a greater probability of making a Type I error?b. If H0 is false, who has a greater probability of making a Type II error?
A test was made of the hypotheses H0 : μ = 15 versus H1: μ > 15.Four statisticians wrote summaries of the results. For each summary, state whether it contains enough information. If there is not enough information, indicate what needs to be added.a. The P-value was 0.02, so we reject H0 at the α
A certain type of calculator battery has a mean lifetime of 100 hours and a standard deviation of σ = 10 hours. A company has developed a new battery and claims it has a longer mean life. A random sample of 1000 batteries is tested, and their sample mean lifetime is x̄ = 101 hours. A test was
The ______________ is the probability, assuming H0 is true, of observing a value for the test statistic that is as extreme as or more extreme than the value actually observed.In Exercises 23–28, fill in each blank with the appropriate word or phrase.
The smaller the P-value is, the stronger the evidence against the ______________ hypothesis becomes.In Exercises 23–28, fill in each blank with the appropriate word or phrase.
When using the critical value method, the region that contains the unusual values is called the _______________ region.In Exercises 23–28, fill in each blank with the appropriate word or phrase.
If we decrease the value of the significance level α, we _______________ the probability of a Type I error.In Exercises 23–28, fill in each blank with the appropriate word or phrase.
If we decrease the value of the significance level α, we ________________ the probability of a Type II error.In Exercises 23–28, fill in each blank with the appropriate word or phrase.
When results are statistically significant, they do not necessarily have _______________ significance.In Exercises 23–28, fill in each blank with the appropriate word or phrase.
The smaller the P-value, the stronger the evidence against H0.In Exercises 29–34, determine whether the statement is true or false. If the statement is false, rewrite it as a true statement.
If the P-value is less than the significance level, we reject H0.In Exercises 29–34, determine whether the statement is true or false. If the statement is false, rewrite it as a true statement.
The probability of a Type II error is α, the significance level.In Exercises 29–34, determine whether the statement is true or false. If the statement is false, rewrite it as a true statement.
If the P-value is very small, we can be sure that the results have practical significance.In Exercises 29–34, determine whether the statement is true or false. If the statement is false, rewrite it as a true statement.
The P-value represents the probability that H0 is true.In Exercises 29–34, determine whether the statement is true or false. If the statement is false, rewrite it as a true statement.
When presenting the results of a hypothesis test, one should report the P-value or the value of the test statistic.In Exercises 29–34, determine whether the statement is true or false. If the statement is false, rewrite it as a true statement.
A test is made of H0: μ = 50 versus H1: μ > 50.A sample of size n = 75 is drawn, and x̄ = 56.The population standard deviation is σ = 20.a. Compute the value of the test statistic z.b. Is H0 rejected at the α = 0.05 level?c. Is H0 rejected at the α = 0.01 level?
A test is made of H0: μ = 14 versus H1: μ ≠ 14.A sample of size n = 48 is drawn, and x̄ = 12.The population standard deviation is σ = 6.a. Compute the value of the test statistic z.b. Is H0 rejected at the α = 0.05 level?c. Is H0 rejected at the α = 0.01 level?
A test is made of H0: μ = 130 versus H1: μ ≠ 130.A sample of size n = 63 is drawn, and x̄ = 135.The population standard deviation is σ = 40.a. Compute the value of the test statistic z.b. Is H0 rejected at the α = 0.05 level?c. Is H0 rejected at the α = 0.01 level?
A test is made of H0: μ = 5 versus H1: μ < 5.A sample of size n = 87 is drawn, and x̄ = 4.5. The population standard deviation is σ = 25.a. Compute the value of the test statistic z.b. Is H0 rejected at the α = 0.05 level?c. Is H0 rejected at the α = 0.01 level?
A test of the hypothesis H0: μ = 65 versus H1: μ ≠ 65 was performed. The P-value was 0.035. Fill in the blank: Ifμ = 65, then the probability of observing a test statistic as extreme as or more extreme than the one actually observed is _________________ .
A test of the hypothesis H0: μ = 150 versus H1: μ < 150 was performed. The P-value was 0.28. Fill in the blank: If μ = 150, then the probability of observing a test statistic as extreme as or more extreme than the one actually observed is __________________ .
True or false: If P = 0.02, thena. The result is statistically significant at the α = 0.05 level.b. The result is statistically significant at the α = 0.01 level.c. The null hypothesis is rejected at the α = 0.05 level.d. The null hypothesis is rejected at the α = 0.01 level.
Showing 5900 - 6000
of 7930
First
53
54
55
56
57
58
59
60
61
62
63
64
65
66
67
Last
Step by Step Answers