New Semester
Started
Get
50% OFF
Study Help!
--h --m --s
Claim Now
Question Answers
Textbooks
Find textbooks, questions and answers
Oops, something went wrong!
Change your search query and then try again
S
Books
FREE
Study Help
Expert Questions
Accounting
General Management
Mathematics
Finance
Organizational Behaviour
Law
Physics
Operating System
Management Leadership
Sociology
Programming
Marketing
Database
Computer Network
Economics
Textbooks Solutions
Accounting
Managerial Accounting
Management Leadership
Cost Accounting
Statistics
Business Law
Corporate Finance
Finance
Economics
Auditing
Tutors
Online Tutors
Find a Tutor
Hire a Tutor
Become a Tutor
AI Tutor
AI Study Planner
NEW
Sell Books
Search
Search
Sign In
Register
study help
business
elementary statistics
Elementary Statistics 3rd Edition William Navidi, Barry Monk - Solutions
True or false: If P = 0.08, thena. The result is statistically significant at the α = 0.05 level.b. The result is statistically significant at the α = 0.10 level.c. The null hypothesis is rejected at the α = 0.05 level.d. The null hypothesis is rejected at the α = 0.10 level.
A test of H0: μ = 17 versus H1: μ < 17 is performed using a significance level of α = 0.01. The value of the test statistic is z = −2.68.a. Is H0 rejected?b. If the true value of μ is 17, is the result a Type I error, a Type II error, or a correct decision?c. If the true value of μ is 10, is
A test of H0: μ = 50 versus H1: μ ≠ 50 is performed using a significance level of α = 0.01. The value of the test statistic is z = 1.23.a. Is H0 rejected?b. If the true value of μ is 50, is the result a Type I error, a Type II error, or a correct decision?c. If the true value of μ is 65, is
A test of H0: μ = 0 versus H1: μ ≠ 0 is performed using a significance level of α = 0.05. The P-value is 0.15.a. Is H0 rejected?b. If the true value of μ is 1, is the result a Type I error, a Type II error, or a correct decision?c. If the true value of μ is 0, is the result a Type I error, a
A test of H0: μ = 6 versus H1: μ > 6 is performed using a significance level of α = 0.01. The P-value is 0.002.a. Is H0 rejected?b. If the true value of μ is 8, is the result a Type I error, a Type II error, or a correct decision?c. If the true value of μ is 6, is the result a Type I error, a
If H0 is rejected at the α = 0.05 level, which of the following is the best conclusion?i. H0 is also rejected at the α = 0.01 level.ii. H0 is not rejected at the α = 0.01 level.iii. We cannot determine whether H0 is rejected at the α = 0.01 level.
If H0 is rejected at the α = 0.01 level, which of the following is the best conclusion?i. H0 is also rejected at the α = 0.05 level.ii. H0 is not rejected at the α = 0.05 level.iii. We cannot determine whether H0 is rejected at the α = 0.05 level.
If P = 0.03, which of the following is the best conclusion?i. If H0 is true, the probability of obtaining a test statistic as extreme as or more extreme than the one actually observed is 0.03.ii. The probability that H0 is true is 0.03.iii. The probability that H0 is false is 0.03.iv. If H0 is
If P = 0.25, which of the following is the best conclusion?i. The probability that H0 is true is 0.25.ii. If H0 is false, the probability of obtaining a test statistic as extreme as or more extreme than the one actually observed is 0.25.iii. If H0 is true, the probability of obtaining a test
A study conducted in 2015 by the technology company Rovi (now TiVo) showed that the mean time spent per day browsing the video streaming service Netflix for something to watch was 19.3 minutes. Assume the standard deviation is???? = 8.Suppose a simple random sample of 100 visits taken this year has
A random sample of 60 second graders in a certain school district are given a standardized mathematics skills test. The sample mean score is x̄ = 52.Assume the standard deviation of test scores is σ = 15.The nationwide average score on this test is 50.The school superintendent wants to know
Are older men shorter than younger men?According to the National Health Statistics Reports, the mean height for U.S. men is 69.4 inches. In a sample of 300 men between the ages of 60 and 69, the mean height was x̄ = 69.0 inches. Public health officials want to determine whether the mean height μ
Making sure that the scales used by businesses in the United States are accurate is the responsibility of the National Institute for Standards and Technology (NIST)in Washington, D.C. Suppose that NIST technicians are testing a scale by using a weight known to weigh exactly 1000 grams.They weigh
One of the measurements used to determine the health of a person’s lungs is the amount of air a person can exhale under force in one second. This is called the forced expiratory volume in one second, and is abbreviated FEV1. Assume the mean FEV1 for 10-year-old boys is 2.1 liters and that the
Are children heavier now than they were in the past? The National Health and Nutrition Examination Survey (NHANES) published in 2004 reported that the mean weight of six-year-old girls in the United States was 49.3 pounds. Another NHANES survey, published in 2012, reported that a sample of 177
Data from the National Association of Realtors indicate that the mean price of a home in Denver, Colorado, in December 2016 was 366.5 thousand dollars. A random sample of 50 homes sold in 2017 had a mean price of 396.3 thousand dollars.a. Assume the population standard deviation is σ = 150.Can you
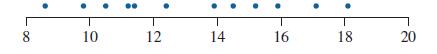
The College Board reports that in 2016 the mean score on the math SAT was 510 and the population standard deviation was σ = 103.A random sample of 20 students who took the test in 2017 had a mean score of 515.Following is a dotplot of the 20 scores.a. Are the assumptions for a hypothesis test
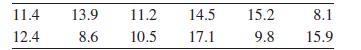
Environmental Protection Agency standards require that the amount of lead in drinking water be less than 15 micrograms per liter. Twelve samples of water from a particular source have the following concentrations, in units of micrograms per liter:a. Explain why it is necessary to check that the
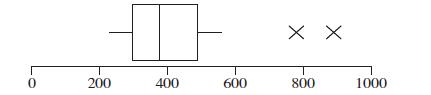
The mean GPA at a certain university is 2.80. Following are GPAs for a random sample of 16 business students from this university.a. Following is a boxplot of the data. Is it reasonable to assume that the population is approximately normal?b. Assume that the population standard deviation is σ =
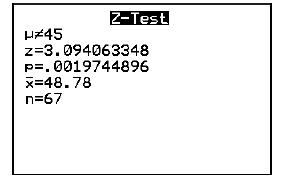
The age in years was recorded for a sample of books in a college library. The following display from a TI-84 Plus calculator presents the results of a hypothesis test regarding the mean age of books in this library.a. What are the null and alternate hypotheses?b. What is the value of the test
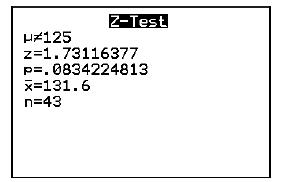
The number of characters was determined for a sample of text messages sent by a certain student. The following display from a TI-84 Plus calculator presents the results of a hypothesis test regarding the mean number of characters in a text message.a. What are the null and alternate hypotheses?b.
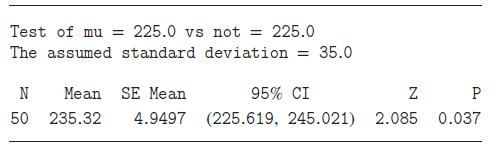
A zoologist recorded the weight, in grams, for a sample of white-fronted Amazon parrots. The following MINITAB output presents the results of a hypothesis test regarding the mean weight of this variety of parrot.a. What are the null and alternate hypotheses?b. What is the value of the test
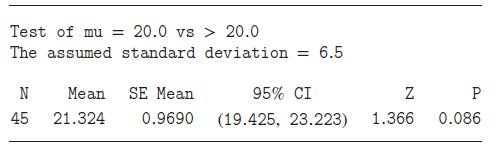
A sample of students at a certain college was drawn, and the age of each, in years, was determined. The following MINITAB output presents the results of a hypothesis test regarding the mean age of students at this college.a. What are the null and alternate hypotheses?b. What is the value of the
A new method of teaching arithmetic to elementary school students was evaluated. The students who were taught by the new method were given a standardized test with a maximum score of 100 points. They scored an average of one point higher than students taught by the old method. A hypothesis test was
A new method of postoperative treatment was evaluated for patients undergoing a certain surgical procedure. Under the old method, the mean length of hospital stay was 6.3 days. The sample mean for the new method was 6.1 days. A hypothesis test was performed in which the null hypothesis stated that
A math teacher has developed a new program to help high school students prepare for the math SAT. A sample of 100 students enroll in the program. They take a math SAT exam before the program starts and again at the end to measure their improvement. The mean number of points improved was x̄ = 2.5.
doctor has developed a new diet to help people lose weight. A random sample of 500 people went on the diet for six weeks. The mean number of pounds lost was x̄ = 0.5.Assume the standard deviation is σ = 5.Let μ be the population mean number of pounds lost. To determine whether the diet is
A test was made of the hypotheses H0: μ = 70 versus H1: μ ≠ 70.A report of the results stated:‘‘P < 0.05, so we reject H0 at the α = 0.05 level.’’ Is there any additional information that should have been included in the report? If so, what is it?
A test was made of the hypotheses H0: μ = 10 versus H1: μ > 10.A report of the results stated:‘‘The critical value was 1.645. Since z > 1.645, we reject H0 at the α = 0.05 level.’’ Is there any additional information that should have been included in the report? If so, what is it?
Cindy computes a 95% confidence interval for μ and obtains (94.6, 98.3). Luis performs a test of the hypotheses H0: μ = 100 versus H1: μ ≠ 100 and obtains a P-value of 0.12. Explain why they can’t both be right.
A sample of size n = 100 is used to test H0: μ = 20 versus H1: μ > 20.The value of μ will not have practical significance unless μ > 25.The population standard deviation is σ = 10.The value of x̄ is 21.a. Assume the sample size is n = 100.Compute the P-value. Show that you do not reject H0 at
A simple random sample of 200 third graders in a large school district was chosen to participate in an after-school program to improve reading skills. After completing the program, the children were tested, and 142 of them showed improvement in their reading skills.a. Find a point estimate for the
In a preliminary study, a simple random sample of 100 computer chips was tested, and 17 of them were found to be defective. Now another sample will be drawn in order to construct a 95% confidence interval for the proportion of chips that are defective. Use the results of the preliminary study to
A pollster is going to sample a number of voters in a large city and construct a 98% confidence interval for the proportion who support the incumbent candidate for mayor. Find a sample size so that the margin of error will be no larger than 0.05.
A pollster is planning to draw a simple random sample of 500 people in Colorado (population 5.5 million). He will then conduct a similar poll in Texas (population 27.9 million). He wants to have approximately the same standard error in both polls.True or false:a. The pollster needs a sample in
A marketing firm in New York City (population 8.6 million) plans to draw a simple random sample of 1000 people to estimate the proportion who have heard about a new product. The firm then plans to take a simple random sample of 500 in Denver(population 683,000) for the same purpose. True or
In a simple random sample of 15 seniors from a certain college, 8 of them had found jobs. Use the small-sample method to construct a 95% confidence interval for the proportion of seniors at that college who have found jobs.
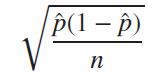
If p̂ is the sample proportion and n is the sample size, then is the ____________________ .In Exercises 7 and 8, fill in each blank with the appropriate word or phrase. p(1 - p) n
To estimate the necessary sample size when no value of p̂ is available, we use p̂ = ______________ .In Exercises 7 and 8, fill in each blank with the appropriate word or phrase.
If we estimate the necessary sample size and no value for p̂ is available, the estimated sample size will be larger than if a value for p̂ were available.In Exercises 9 and 10, determine whether the statement is true or false. If the statement is false, rewrite it as a true statement.
The margin of error does not depend on the sample size.In Exercises 9 and 10, determine whether the statement is true or false. If the statement is false, rewrite it as a true statement.
x = 146, n = 762, confidence level 95%In Exercises 11–14, find the point estimate, the standard error, and the margin of error for the given confidence levels and values of x and n.
x = 46, n = 97, confidence level 99%In Exercises 11–14, find the point estimate, the standard error, and the margin of error for the given confidence levels and values of x and n.
x = 236, n = 474, confidence level 90%In Exercises 11–14, find the point estimate, the standard error, and the margin of error for the given confidence levels and values of x and n.
x = 29, n = 80, confidence level 92%In Exercises 11–14, find the point estimate, the standard error, and the margin of error for the given confidence levels and values of x and n.
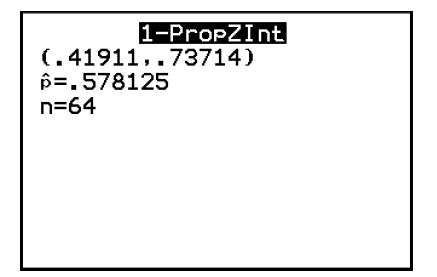
x = 28, n = 64, confidence level 93%In Exercises 15–18, use the given data to construct a confidence interval of the requested level.
x = 52, n = 71, confidence level 97%In Exercises 15–18, use the given data to construct a confidence interval of the requested level.
x = 125, n = 317, confidence level 95%In Exercises 15–18, use the given data to construct a confidence interval of the requested level.
x = 178, n = 531, confidence level 90%In Exercises 15–18, use the given data to construct a confidence interval of the requested level.
Among 238 cell phone owners aged 18–24 surveyed by the Pew Research Center, 102 said their phone was an Android phone.a. Find a point estimate for the proportion of cell phone owners aged 18–24 who have an Android phone.b. Construct a 95% confidence interval for the proportion of cell phone
According to the U.S. Census Bureau, 43% of men who worked at home were college graduates. In a sample of 500 women who worked at home, 162 were college graduates.a. Find a point estimate for the proportion of college graduates among women who work at home.b. Construct a 98% confidence interval for
Sleep apnea is a disorder in which there are pauses in breathing during sleep. People with this condition must wake up frequently to breathe. In a sample of 427 people aged 65 and over, 104 of them had sleep apnea.a. Find a point estimate for the population proportion of those aged 65 and over who
An Internet service provider sampled 540 customers and found that 75 of them experienced an interruption in high-speed service during the previous month.a. Find a point estimate for the population proportion of all customers who experienced an interruption.b. Construct a 90% confidence interval for
The General Social Survey asked 1294 people whether they performed any volunteer work during the past year. A total of 517 people said they did.a. Find a point estimate for the proportion of people who performed volunteer work during the past year.b. Construct a 95% confidence interval for the
A college admissions officer sampled 120 entering freshmen and found that 42 of them scored more than 550 on the math SAT.a. Find a point estimate for the proportion of all entering freshmen at this college who scored more than 550 on the math SAT.b. Construct a 98% confidence interval for the
In the computer game League of Legends, some of the strikes are critical strikes, which do more damage.Assume that the probability of a critical strike is the same for every attack, and that attacks are independent. Assume that a character has 242 critical strikes out of 595 attacks.a. Construct a
In a sample of 42 water specimens taken from a construction site, 26 contained detectable levels of lead.a. Construct a 90% confidence interval for the proportion of water specimens that contain detectable levels of lead.b. Construct a 95% confidence interval for the proportion of water specimens
A sociologist wants to construct a 95% confidence interval for the proportion of children aged 8–12 living in New York who own a cell phone.a. A survey by the National Consumers League estimated the nationwide proportion to be 0.56. Using this estimate, what sample size is needed so that the
An educator wants to construct a 98%confidence interval for the proportion of elementary schoolchildren in Colorado who are proficient in reading.a. The results of a recent statewide test suggested that the proportion is 0.70. Using this estimate, what sample size is needed so that the confidence
A medical researcher wants to construct a 99% confidence interval for the proportion of knee replacement surgeries that result in complications.a. An article in the Journal of Bone and Joint Surgery suggested that approximately 8% of such operations result in complications. Using this estimate,
A pollster wants to construct a 95%confidence interval for the proportion of adults who believe that economic conditions are getting better.a. A Gallup poll estimates this proportion to be 0.34. Using this estimate, what sample size is needed so that the confidence interval will have a margin of
A sociologist sampled 200 people who work in computer-related jobs, and found that 42 of them have changed jobs in the past 6 months.a. Construct a 95% confidence interval for the proportion of those who work in computer-related jobs who have changed jobs in the past six months.b. Among the 200
A simple random sample of 300 voters was polled several months before a presidential election. One of the questions asked was: ‘‘Are you satisfied with the choice of candidates for president?’’ A total of 123 of them said that they were not satisfied.a. Construct a 99% confidence interval
Eighteen concrete blocks were sampled and tested for crushing strength in order to estimate the proportion that were sufficiently strong for a certain application. Sixteen of the 18 blocks were sufficiently strong. Use the small-sample method to construct a 95% confidence interval for the
During an economic downturn, 20 companies were sampled and asked whether they were planning to increase their workforce. Only 3 of the 20 companies were planning to increase their workforce. Use the small-sample method to construct a 98% confidence interval for the proportion of companies that are
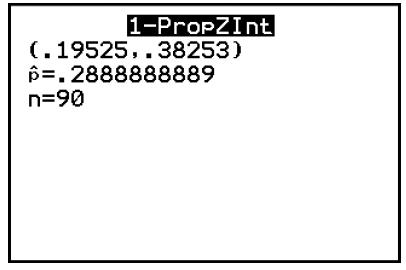
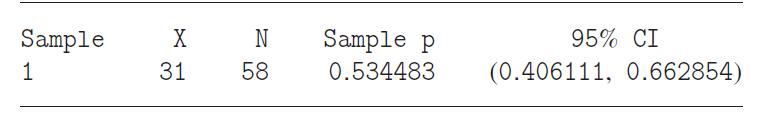
A sample of voters in a certain city was asked whether they planned to vote for the incumbent mayor in the next election. The following display from a TI-84 Plus calculator presents a 99% confidence interval for the population proportion that plan to vote for the incumbent mayor.a. Fill in the
A sample of employed people was asked whether they had changed jobs in the past two years.The following display from a TI-84 Plus calculator presents a 95% confidence interval for the population proportion who had changed jobs during that time.a. Fill in the blanks. We are___________________
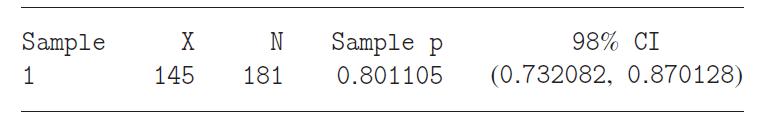
A sample of drivers was asked whether they regularly use seat belts. The following MINITAB output presents a confidence interval for the population proportion who regularly use seat belts.a. Fill in the blanks. We are___________________ confident that the population proportion is between
A football game starts with the toss of a coin to determine which team will get the ball first.Before the game, the referee tosses the coin a number of times and records the number of times the coin lands heads. The following MINITAB output presents a confidence interval for the probability that
The United States Senate consists of 100 senators. In January 2017, 21 of them were women. Explain why these data should not be used to construct a 95% confidence interval for the proportion of senators who are women.
At the end of a television documentary on the nature of government, viewers are invited to tweet an answer to the question, ‘‘Do you believe that women are more effective at governing than men are?’’ A total of 2348 viewers answer the question, and 1247 of them answer ‘‘Yes.’’
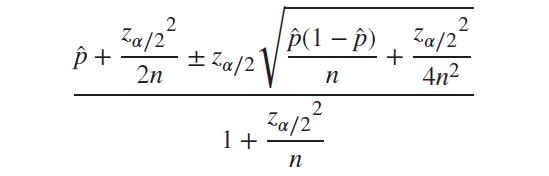
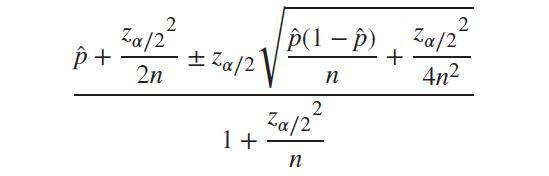
In a certain high school, 9 out of 15 tenth graders said they planned to go to college after graduating.Construct a 95% confidence interval for the proportion of tenth graders who plan to attend college:a. Using Wilson’s methodb. Using the small-sample methodc. Using the traditional method
Refer to Exercise 41.a. Which of the three confidence intervals is the narrowest?b. Does the small-sample method provide a good approximation to Wilson’s interval in this case?c. Explain why the traditional interval is the widest of the three.Wilson’s interval: The small-sample method for
The small-sample method is a good approximation to Wilson’s method for all confidence levels commonly used in practice, but is best when zα∕2 is close to 2. Refer to Exercise 41.a. Use Wilson’s method to construct a 90% confidence interval, a 95% confidence interval, and a 99%
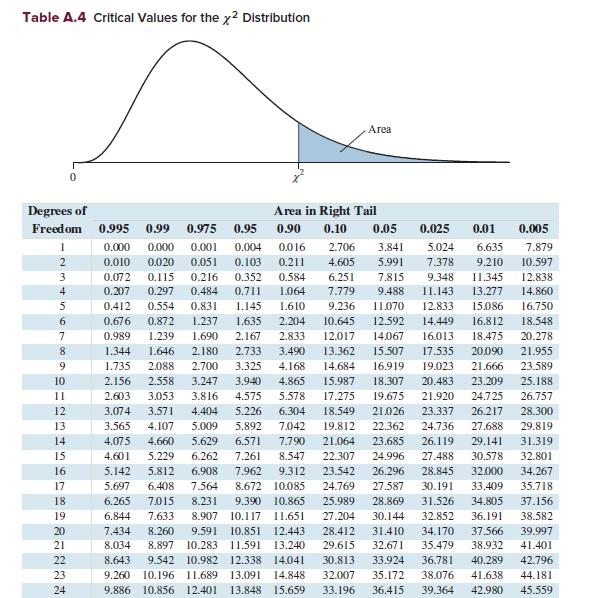
Find the critical values for a 95% confidence interval using the chi-square distribution with 18 degrees of freedom.
Find the critical values for a 99% confidence interval using the chi-square distribution with 25 degrees of freedom.
Construct a 95% confidence interval for the population standard deviation σ if a sample of size 10 has standard deviation s = 6.
Construct a 99% confidence interval for the population standard deviation σ if a sample of size 23 has standard deviation s = 12.
To find a confidence interval for a standard deviation from a sample of size 15, we use a chi-square distribution with ____________ degrees of freedom.In Exercises 5 and 6, fill in each blank with the appropriate word or phrase.
The method described for finding confidence intervals should be used only when the distribution of the population is almost exactly _________________ .In Exercises 5 and 6, fill in each blank with the appropriate word or phrase.
When constructing a confidence interval for a standard deviation, we must find two critical values.In Exercises 7 and 8, determine whether the statement is true or false. If the statement is false, rewrite it as a true statement.
If we have a confidence interval for a variance, we can obtain a confidence interval for the standard deviation by squaring the confidence bounds.In Exercises 7 and 8, determine whether the statement is true or false. If the statement is false, rewrite it as a true statement.
Find the critical values for a 95% confidence interval using the chi-square distribution with 15 degrees of freedom.
Find the critical values for a 99% confidence interval using the chi-square distribution with 5 degrees of freedom.
Construct a 95% confidence interval for the population standard deviation σ if a sample of size 25 has standard deviation s = 15.
Scores on the math SAT are normally distributed.A sample of 20 SAT scores had standard deviation s = 87.a. Construct a 98% confidence interval for the population standard deviation σ.b. Someone says that the scoring system for the SAT is designed so that the population standard deviation will be
Scores on an IQ test are normally distributed. A sample of 25 IQ scores had standard deviation s = 8.a. Construct a 95% confidence interval for the population standard deviation σ.b. The developer of the test claims that the population standard deviation is σ = 15.Does this confidence interval
Following are weights of 12 two-month-old baby girls. Assume that the population is normally distributed.a. Find the sample standard deviation s.b. Construct a 95% confidence interval for the population standard deviation σ.c. According to the National Health Statistics Reports, the standard
Boxes of cereal are labeled as containing 14 ounces. Following are the weights of a sample of 12 boxes.Assume that the population is normally distributed.a. Find the sample standard deviation s.b. Construct a 98% confidence interval for the population standard deviation σ.c. The goal of the
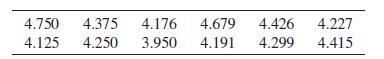
Six measurements were made of the mineral content (in percent) of spinach, with the following results.Assume that the population is normally distributed.a. Find the sample standard deviation s.b. Construct a 99% confidence interval for the population standard deviation σ.c. Based on the confidence
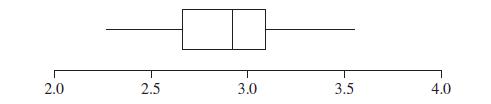
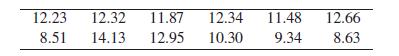
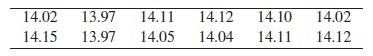
Following are interest rates (annual percentage rates) for a 30-year fixed rate mortgage from a sample of lenders in Macon, Georgia on a recent day. It is reasonable to assume that the population is approximately normal.a. Find the sample standard deviation s.b. Construct a 95% confidence interval
A sample of size 101 from a normal population has sample standard deviation s = 40.Use Table A.4 to find the exact critical values X2 0.025 and X2 0.975 for a 95% confidence interval, and construct a 95% confidence interval for σ.The chi-square distribution is skewed, but as the number of degrees
Refer to Exercise 19.Use the normal approximation to estimate the critical values X2 0.025 and X2 0.975 for a 95% confidence interval, and construct a 95% confidence interval for σ.The chi-square distribution is skewed, but as the number of degrees of freedom becomes large, the skewness
How close is the confidence interval based on the normal approximation constructed in Exercise 20 to the exact confidence interval constructed in Exercise 19?The chi-square distribution is skewed, but as the number of degrees of freedom becomes large, the skewness diminishes. If the number of
Refer to Exercise 19.Use the more accurate normal approximation to estimate the critical values X2 0.025 and X2 0.975 for a 95% confidence interval, and construct a 95% confidence interval for σ.A more accurate normal approximation to X2 α is given bywhere zα is the z-score that has area α to
How close is the confidence interval based on the more accurate normal approximation to the exact one?A more accurate normal approximation to X2 α is given bywhere zα is the z-score that has area α to its right. x 0.5 (za + 2k - 1
A simple random sample of size 15 has mean x̄ = 10.34 and standard deviation s = 3.48. The population is normally distributed. Construct a 95% confidence interval for the population standard deviation.In Exercises 1–4, state which type of parameter is to be estimated, then construct the
A simple random sample of size 80 has mean x̄ = 7.31. The population standard deviation is σ = 6.26. Construct a 99% confidence interval for the population mean.In Exercises 1–4, state which type of parameter is to be estimated, then construct the confidence interval.
In a simple random sample of 100 children, 22 had reading skills above their grade level. Construct a 99% confidence interval for the proportion of children who have reading skills above their grade level.In Exercises 1–4, state which type of parameter is to be estimated, then construct the
A simple random sample of size 25 has mean x̄ = 17.4 and standard deviation s = 5.3. The population is approximately normally distributed. Construct a 95%confidence interval for the population mean.In Exercises 1–4, state which type of parameter is to be estimated, then construct the confidence
Showing 6000 - 6100
of 7930
First
54
55
56
57
58
59
60
61
62
63
64
65
66
67
68
Last
Step by Step Answers