New Semester
Started
Get
50% OFF
Study Help!
--h --m --s
Claim Now
Question Answers
Textbooks
Find textbooks, questions and answers
Oops, something went wrong!
Change your search query and then try again
S
Books
FREE
Study Help
Expert Questions
Accounting
General Management
Mathematics
Finance
Organizational Behaviour
Law
Physics
Operating System
Management Leadership
Sociology
Programming
Marketing
Database
Computer Network
Economics
Textbooks Solutions
Accounting
Managerial Accounting
Management Leadership
Cost Accounting
Statistics
Business Law
Corporate Finance
Finance
Economics
Auditing
Tutors
Online Tutors
Find a Tutor
Hire a Tutor
Become a Tutor
AI Tutor
AI Study Planner
NEW
Sell Books
Search
Search
Sign In
Register
study help
business
nonparametric statistical inference
Statistical Reasoning For Everyday Life 4th Edition Jeffrey Bennett - Solutions
Weights of Diet Coke. Construct a frequency table for the weights (in pounds)given below of 36 cans of Diet Coke. Start the first bin at 0.7750 pound and use a bin width of 0.0050 pound. Discuss your findings.0.7773 0.7874 0.7868 0.7802 0.7806 0.7907 0.7879 0.7833 0.7923 0.7910 0.7813 0.7859 0.7822
Weights of Coke. Construct a frequency table for the weights (in pounds) given below of 36 cans of regular Coke.Start the first bin at 0.7900 pound and use a bin width of 0.0050 pound. Discuss your findings.0.8192 0.8194 0.8211 0.8176 0.8062 0.8143 0.8110 0.8152 0.7901 0.8152 0.8079 0.8161 0.8161
Frequency Table Practice. A guidebook for San Francisco lists 2 one-star restaurants, 12 two-star restaurants, 18 three-star restaurants, 6 four-star restaurants, and 2 fivestar restaurants. Make a frequency table for these ratings.Include columns for relative frequency and cumulative frequency.
Frequency Table Practice. Professor Diaz records the following final grades in one of her courses:A A A B B B B B B B B B B C C C C C C C C C C C D D F F F F Construct a frequency table for these grades. Include columns for relative frequency and cumulative frequency.
bins. For a given data set of IQ scores, if you increase the width of the bins, the number of bins decreases.decide whether the statement makes sense (or is clearly true) or does not make sense (or is clearly false). Explain clearly. Not all of these statements have definitive answers, so your
Cumulative Frequency. The cumulative frequency of a category in a table is 25.5.decide whether the statement makes sense (or is clearly true) or does not make sense (or is clearly false). Explain clearly. Not all of these statements have definitive answers, so your explanation is more important
Relative Frequency. The relative frequency of category A in a table is 0.27 or 27%.decide whether the statement makes sense (or is clearly true) or does not make sense (or is clearly false). Explain clearly. Not all of these statements have definitive answers, so your explanation is more important
Frequency Table. A friend tells you that her frequency table has two columns labeled State and Median Income.decide whether the statement makes sense (or is clearly true) or does not make sense (or is clearly false). Explain clearly. Not all of these statements have definitive answers, so your
Frequency Table. The first class in a frequency table of incomes shows a frequency of 24 corresponding to the range of values from $0 to $999. Using only this information about the frequency table, is it possible to identify the original 24 sample values that are summarized by this class? Explain.
Cumulative Frequency. A frequency table of grades has five classes with frequencies of 4, 12, 16, 6, and 2.What are the corresponding cumulative frequencies of the five classes?
Relative Frequency. A frequency table of grades has five classes (A, B, C, D, F) with frequencies of 4, 12, 16, 6, and 2.What are the relative frequencies of the five classes?
Frequency Table. What is a frequency table? Explain what we mean by the categories (or classes) and frequencies.
While most economists believe that the CPI overstates the effects of inflation, a few believe hat it actually understates the effects, especially on lower-income people.Research why some economists come to this conclusion, then draw your own conclusion: Does the CPI sometimes understate the effects
In Figure 5, notice that the revenue increases and spending savings get larger each year. Discuss why this occurs, focusing on how a change in the CPI compounds over time, much like compound interest in a bank account.
As this text goes to press, the government is considering making a change to the chained CPI. Has it happened yet? Investigate the current status of the debate over whether the CPI should be adjusted for the purposes of setting tax rates and cost of living adjustments.
Because adjusting the CPI would lead to a slower rise in the income thresholds for various tax rates, conservatives often claim that this change would mean “tax increases.” Similarly, because the change would reduce the annual increases in cost of living adjustments, liberals often claim that
Find examples in your own spending or the spending of friends and family of substitution effects and the purchase of products that were unavailable or lower quality a few years ago. Overall, do you think these examples support the claim that the CPI overstates the effects of inflation? Defend your
Have any tax law changes been proposed by the U.S.Congress or the President this year? Discuss the fairness of current proposals.
Do a Web search on “benefit of tax cuts” and find an article arguing for or against a particular tax cut proposal or policy. Briefly summarize the article and discuss whether you think the article made its case well.
Do you think that either of the charts in Figure 4 accurately portrays the overall “fairness” of the tax cuts? If so, which one and why? If not, how do you think the data could have been portrayed more fairly?
Discuss the chart in Figure 4b. Why does it show actual incomes rather than incomes as a percentage of all taxpayers? What does it tell us about the effects of the tax cuts on each income level? Do you think it supports the claim in its title? Defend your opinion.
Discuss the chart in Figure 4a. Why does it only show taxpayer income levels from the top 1% to the top 25%?What does it tell us about the relative tax burden on each group shown? Do you think its claim that the “rich pay more” is an honest depiction or a distortion of the facts?Defend your
Refer to the same table used for Exercise 9.If the net profit in the sixth year is projected to be 12% more than in the fifth year, what is that projected net profit for the sixth year?
The Telektronics Company has been in business for five years, and the table lists the net profits in each of those years. Using the first year as a reference, find the index number for the net profit in the second year.year Net Profit 1 $12,335 2 $15,257 3 $23,444 4 $31,898 5 $47,296
Two different students measure the height of an instructor who is actually 178.44 cm tall. The first student obtains a measurement of 178 cm and the second student obtains a measurement of 179.18 cm. Which measurement is more accurate? Which measurement is more precise?
In a Gallup poll of 1,038 adults, 5% of the respondents said that second-hand smoke is not at all harmful. How many respondents said that second-hand smoke is not at all harmful?
Sitting heights of 750 randomly selected licensed drivers are measured and 38 of those heights are greater than 97.2 cm. What is the percentage of sitting heights greater than 97.2 cm?
Recorded survey results include the states in which respondents reside. What is the level of measurement of those data? (nominal, ordinal, interval, ratio)
A researcher measures the sitting height of a subject and records a value of 91.4 cm, but the subject’s actual sitting height is 89.0 cm. What is the relative error?
A researcher measures the sitting height of a subject and records a value of 91.4 cm, but the subject’s actual sitting height is 89.0 cm. What is the absolute error?
What is the level of measurement of the values described in the preceding exercise? (nominal, ordinal, interval, ratio)
Sitting heights of 750 randomly selected licensed drivers are measured. Are those values continuous or discrete?
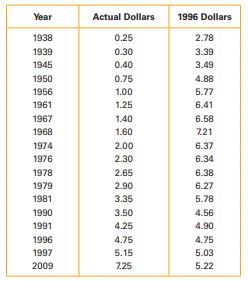
Minimum Wage. The accompanying table lists the federal hourly minimum in both actual dollars at the time and 1996 dollars. The table entries correspond to years in which the minimum wage changed (based on data from the Department of Labor).a. According to the table, how much is $0.25 in 1938
health care Spending. Total spending on health care in the United States rose from $80 billion in 1973 to $2.5 trillion in 2010. The Consumer Price Index was 44.4 in 1973, and it was 218.1 in 2010 (with 1982–1984= 100). Compare the change in health care spending from 1973 to 2010 to the overall
aoL Poll. In an America OnLine poll of 671 people, 36%answered yes when asked if today’s NFL games are too long.a. What is the number of respondents who answered yes?b. Among the respondents, 40 answered by saying that they were not sure. What is the percentage of “not sure”responses?c. Given
astrology. In a Harris Interactive poll of 2,303 adults, 26%said that they believe in astrology.a. Find the true number of the poll respondents who believe in astrology.b. Is the number of respondents who believe in astrology from a discrete data set or a continuous data set?Explain.c. Of the 2,303
Index Numbers. Find a recent news report that includes an index number other than the Consumer Price Index.Describe the index number and its meaning, and discuss how the index is important in the story
consumer Price Index. Find a recent news report that includes a reference to the Consumer Price Index.Briefly describe how the Consumer Price Index is important in the story.
convenience Store Index. Go to a local supermarket and find the prices of a few staples, such as bread, milk, juice, and coffee. Compute the total cost of those items. Then go to a few smaller convenience stores and find the prices of the same items. Using the supermarket total as the reference
human Development Index. The United Nations Development Programme regularly releases its Human Development Report. A closely watched finding of this report is the Human Development Index (HDI), which measures the overall achievements in a country in three basic dimensions of human development: life
consumer confidence Index. Use a search engine to find recent news about the Consumer Confidence Index.After studying the news, write a short summary of what the Consumer Confidence Index is trying to measure and describe any recent trends in the Consumer Confidence Index.
Producer Price Index. Go to the Producer Price Index(PPI) home page. Read the overview and recent news releases. Write a short summary describing the purpose of the PPI and how it is different from the CPI. Also summarize any important recent trends in the PPI.
consumer Price Index. Go to the Consumer Price Index home page and find the latest news release with updated figures for the CPI. Summarize the news release and any important trends in the CPI.
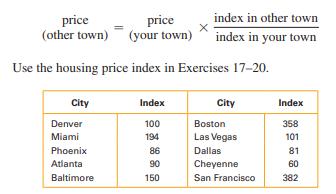
housing Prices. If you see a house valued at $1,000,000 in Boston, find the price of a comparable house in San Francisco and Cheyenne.
housing Prices If you see a house valued at $250,000 in Cheyenne, find the price of a comparable house in San Francisco and Boston.
housing Prices. If you see a house valued at $500,000 in Boston, find the price of a comparable house in Baltimore and Phoenix.
housing Prices. If you see a house valued at $300,000 in Denver, find the price of a comparable house in Miami and Cheyenne.
home Prices—West. The typical (median) price of a new single-family home in the West (United States) rose from $129,600 in 1990 to $235,600 in 2010. Calculate the percentage rise in cost of a home from 1990 to 2010, and compare it with the overall rate of inflation as measured by the Consumer
home Prices—South. The typical (median) price of a new single-family home in the South (United States) rose from $75,300 in 1990 to $122,000 in 2010. Calculate the percentage rise in cost of a home from 1990 to 2010, and compare it with the overall rate of inflation as measured by the Consumer
Public college costs. The average annual cost (tuition, fees, and room and board) at four-year public universities rose from $2,550 in 1980 to $16,100 in 2010. Calculate the percentage rise in cost from 1980 to 2010, and compare it with the overall rate of inflation as measured by the Consumer
Private college costs. The average annual cost (tuition, fees, and room and board)at four-year private universities rose from$5,600 in 1980 to $37,000 in 2010. Calculate the percentage rise in cost from 1980 to 2010, and compare it with the overall rate of inflation as measured by the Consumer
Using the Gas Price Index. If it cost $23.40 to fill your gas tank in 2000, how much would it have cost to fill the same tank in 2010?
Using the Gas Price Index. If it cost $19.52 to fill your gas tank in 1980, how much would it have cost to fill the same tank in 2010?
reconstructing the Gasoline Price Index. Identify the six price indexes in Table 1 that result from using the price from 1970 as the reference value. (Hint: Create a column for price as a percentage of 1970 price and another column giving the price index with 1970 = 100.)
reconstructing the Gasoline Price Index.Identify the six price indexes in Table 1 that result from using the price from 2000 as the reference value. (Hint: Create a column for price as a percentage of 2000 price and another column giving the price index with 2000 = 100.)
2005 Price. Using the 1980 price as the reference value, the gasoline price index for 2005 is 189.3. What was the cost of a gallon of gasoline in 2005?
1998 Price. Using the 1980 price as the reference value, the gasoline price index for 1998 is 0.9. What was the cost of a gallon of gasoline in 1998?use the gasoline price index from Table 1.Briefly explain your reasoning in each case.
2006 Index. The average price of a gallon of gas was $2.62 in 2006. What is the price index for gasoline in 2006, with the 1980 price as the reference value?use the gasoline price index from Table 1.Briefly explain your reasoning in each case.
current Data. Suppose the cost of gasoline today is $5.00 per gallon. What is the price index number for gasoline today, with the 1980 price as the reference value? (See the data in Table 1.)use the gasoline price index from Table 1.Briefly explain your reasoning in each case.
cPI. If the Consumer Price Index increases, must wages also increase? Explain.
cPI. If the prices of goods, services, and housing increase, must the Consumer Price Index increase? Explain.
Index Number. If computer costs in the year 2000 are set equal to 100 so they can be used as the basis for determining index numbers, and the index number for the year 2012 is 15, what do we know about computer costs in 2012 compared with computer costs in 2000?
Index Number. A newspaper reports that the Gas Price Index in 2011 was $3.92 per gallon. What is wrong with that statement?
Quote Interpretation. Consider this quote: “The rate [of smoking] among 10th graders jumped 45 percent, to 18.3 percent, and the rate for 8th graders is up 44 percent, to 10.4 percent.” Briefly explain the meaning of each of the percentages in this statement.
Percentage change. Find a recent news report in which percentages are used to express the change in a statistical result from one time to another (such as an increase in population or in the number of children who smoke). Describe the meaning of the change. Be sure to watch for key words such as of
Percentages. Find three recent news reports in which percentages are used to describe statistical results. In each case, describe the meaning of the percentage.
Drug Use Statistics. Go to the Web site for the National Center on Addiction and Substance Abuse (CASA) and find a recent report giving statistics on substance abuse.Write a summary of the new research, giving at least some of the conclusions in terms of percentages.
World Population. Find the current estimate of world population on the U.S. Census Bureau’s world population clock. Describe the percentage change in population since the 6 billion mark was passed during 1999. Also find how the population clock estimates are made, and discuss the uncertainties in
The five-year survival rate for Blacks for all forms of cancer increased from 27% in the 1960s to 48% now.describe changes in which the measurements themselves are percentages. Express each change in two ways: (1) as an absolute difference in terms of percentage points and (2) as a relative
The five-year survival rate for Caucasians for all forms of cancer increased from 39% in the 1960s to 61% now.describe changes in which the measurements themselves are percentages. Express each change in two ways: (1) as an absolute difference in terms of percentage points and (2) as a relative
The percentage of the world’s population living in developed countries decreased from 27.1% in 1970 to 19.5% now.describe changes in which the measurements themselves are percentages. Express each change in two ways: (1) as an absolute difference in terms of percentage points and (2) as a
The percentage of high school seniors using alcohol decreased from 68.2% in 1975 to 52.7% now.describe changes in which the measurements themselves are percentages. Express each change in two ways: (1) as an absolute difference in terms of percentage points and (2) as a relative difference in terms
Margin of Error. A Pew Research Center survey of 3,002 adults showed that the percentage who listen to National Public Radio is probably between 14% and 18%. How should a newspaper report the margin of error? Explain.
Margin of Error. A Gallup poll of 1,012 adults showed that 89% of Americans say that human cloning should not be allowed. The margin of error was 3 percentage points. Would it matter if a newspaper reported the margin of error as“3%”? Explain.
Salary. The Vice President’s salary is currently 42% less than the President’s salary, so the Vice President’s salary is ____% of the President’s salary.Fill in the blanks in Exercise.Briefly explain your reasoning in each case.
Population. If the population of Montana is 20% less than the population of New Hampshire, then Montana’s population is ____% of New Hampshire’s population.Fill in the blanks in Exercise.Briefly explain your reasoning in each case.
areas. If the area of Norway is 24% more than the area of Colorado, then Norway’s area is ____% of Colorado’s area.Fill in the blanks in Exercise.Briefly explain your reasoning in each case.
Weights. If a truck weighs 40% more than a car, then the truck’s weight is ____% of the car’s weight.Fill in the blanks in Exercise.Briefly explain your reasoning in each case.
cell Phones. In a Harris Interactive survey of 9,132 adults, 89% reported being cell phone users.Some important analyses of survey results require that you know the actual number of subjects whose responses fall into a particular category. Find the actual number of respondents corresponding to the
Televisions. In a Frank N. Magid Associates survey of 1,005 adults, 83% reported having more than one television at home.Some important analyses of survey results require that you know the actual number of subjects whose responses fall into a particular category. Find the actual number of
Interview Mistakes. In an Accountemps survey of 150 executives, 47% said that the most common interview mistake is to have little or no knowledge of the company.Some important analyses of survey results require that you know the actual number of subjects whose responses fall into a particular
Personal calls. In an At-A-Glance survey of 1,385 office workers, 4.8% said that they do not make personal phone calls.Some important analyses of survey results require that you know the actual number of subjects whose responses fall into a particular category. Find the actual number of respondents
airports. Chicago’s O’Hare Airport handled 67 million passengers last year. As the busiest airport in the world, Atlanta’s Hartsfield Airport handled 89 million passengers last year.For each pair of values, use a percentage to express their relative change or difference. Use the second given
car Sales. In the current month, 18,830 Toyota Camry cars were sold, and there were 18,341 Honda Civic cars sold.For each pair of values, use a percentage to express their relative change or difference. Use the second given value as the reference value, and express results to the nearest percentage
Newspapers. The daily circulation of the Wall Street Journal is currently 2.09 million (the largest in the country). The daily circulation of USA Today is currently 1.83 million (the second largest in the country).For each pair of values, use a percentage to express their relative change or
Bankruptcies. There were 1,531,997 bankruptcy cases filed last year, and in the year 2000 there were 1,276,900 bankruptcy cases filed.For each pair of values, use a percentage to express their relative change or difference. Use the second given value as the reference value, and express results to
airline Flights. This January there were 751,183 scheduled passenger flights in the United States, and in January of 1996 there were 634,343.For each pair of values, use a percentage to express their relative change or difference. Use the second given value as the reference value, and express
cars. There are now 143,781,202 registered passenger cars, and in 1980 there were 121,601,000.For each pair of values, use a percentage to express their relative change or difference. Use the second given value as the reference value, and express results to the nearest percentage point. Also, write
Newspapers. The number of daily newspapers in the United States is now 1,387, and it was 2,226 in 1900.For each pair of values, use a percentage to express their relative change or difference. Use the second given value as the reference value, and express results to the nearest percentage point.
Percentage Practice. A study was conducted to determine whether flipping a penny or spinning a penny has an effect on the proportion of heads. Among 49,437 trials, 29,015 involved flipping pennies, and 14,709 of those pennies turned up heads. The other 20,422 trials involved spinning pennies, and
Percentage Practice. A study was conducted of pleas made by 1,348 criminals. Among those criminals, 956 pleaded guilty and 392 of them were sentenced to prison.Among 72 other criminals who pleaded not guilty, 58 were sent to prison (based on data from “Does It Pay to Plead Guilty?” by Brereton
Fractions, Decimals, Percentages. Express the following numbers in the three forms of fraction, decimal, and percentage.a. 350%b. 2.5c. −0.44d. −200%
Fractions, Decimals, Percentages. Express each of the following numbers in the three forms of a fraction, decimal, and percentage.a. 75%b. 3/8c. 0.4d. 80%
Interest rate. The Jefferson Valley Bank increased its new-car loan rate (annual) by 100 percentage points.new poll?decide whether the statement makes sense (or is clearly true) or does not make sense (or is clearly false). Explain clearly; not all of these have definitive answers, so your
Interest rate. The Jefferson Valley Bank increased its new-car loan rate by 100%.new poll?decide whether the statement makes sense (or is clearly true) or does not make sense (or is clearly false). Explain clearly; not all of these have definitive answers, so your explanation is more important than
Salary Percentages. The CEO of the Brandon Marketing Group announces that all employees must take a 5% cut in pay this year, but they will all get a 5% raise next year, so the salaries will then be the same as they are now.new poll?decide whether the statement makes sense (or is clearly true) or
cell Phones. The percentage of people with cell phones increased by 1.2 million people.new poll?decide whether the statement makes sense (or is clearly true) or does not make sense (or is clearly false). Explain clearly; not all of these have definitive answers, so your explanation is more
Of and More Than. In an Opinion Research poll, 1,072 adults were asked what they would do with their old cell phones, and 44.0% of them said that they would donate them to charity. What is the actual number of respondents who plan to donate their old cell phones to charity? If another poll is to be
Percentage Points. A Ridgid survey of 1,023 high school students showed that 25% of them plan to enter the field of information technology, and the margin of error is 3 percentage points. Why is it misleading to state that the margin of error is 3% instead of 3 percentage points?
Percentage A New York Times editorial criticized a chart caption that described a dental rinse as one that“reduces plaque on teeth by over 300%.” If the dental rinse removes all of the plaque, what percentage is removed?Is it possible to reduce plaque by over 300%?
Showing 2300 - 2400
of 5397
First
17
18
19
20
21
22
23
24
25
26
27
28
29
30
31
Last
Step by Step Answers