New Semester
Started
Get
50% OFF
Study Help!
--h --m --s
Claim Now
Question Answers
Textbooks
Find textbooks, questions and answers
Oops, something went wrong!
Change your search query and then try again
S
Books
FREE
Study Help
Expert Questions
Accounting
General Management
Mathematics
Finance
Organizational Behaviour
Law
Physics
Operating System
Management Leadership
Sociology
Programming
Marketing
Database
Computer Network
Economics
Textbooks Solutions
Accounting
Managerial Accounting
Management Leadership
Cost Accounting
Statistics
Business Law
Corporate Finance
Finance
Economics
Auditing
Tutors
Online Tutors
Find a Tutor
Hire a Tutor
Become a Tutor
AI Tutor
AI Study Planner
NEW
Sell Books
Search
Search
Sign In
Register
study help
business
project quality management
The Asq Certified Six Sigma Yellow Belt Study Guide 2nd Edition Erica L Farmer ,Grace L Duffy - Solutions
38. The purpose of FMEA is to:a. use process or design features to prevent the acceptance or further processing of nonconforming products.b. determine the set of components that could cause a failure in a process.c. understand the opportunities for failure and the impact of risks in a product or
37. The eight types of waste are categorized as which of the following?a. Reworkb. Value-addedc. Business value-addedd. Non-value-added
36. Consider the following two-way ANOVA table with interaction from a gage R&R study. What conclusions can be drawn from the part-to-operator interaction?Gage R&R: Two-Way ANOVA Table with Interactions Source DF SS MS F P Part 9 88.362 9.81799 492.290 0.000 Operator 2 3.1673 1.58363 79.406 0.000
35. In a gage R&R study, the difference between using the ANOVA method and range method is that the ANOVA method provides which of the following?a. Interactions between operators and samplesb. Interactions between each operatorc. Interactions between leadership and operatorsd. Interactions between
34. The purpose of a gage R&R study is to determine which of the following?a. The part of variation in the data resulting from the variation in the measurement systemb. The part of variation in the data resulting from the shift in the mean of the measurement systemc. The part of variation in the
33. The Six Sigma team has conducted a gage R&R study. The specific measure they are interested in is the variation in measurement between appraisers. Which of the following terms represents this variation?a. Repeatabilityb. Reproducibilityc. Precisiond. Accuracy
32. Which of the following best describes linearity in MSA?a. Closeness of repeated readings to each otherb. Accuracy of measurement at various points of measuring range in the equipmentc. Closeness of agreement between the average of one or more measured results and a reference valued. Drift in
31. A process improvement team has conducted a measurement systems analysis(MSA). The team would like to know the difference between the absolute value and true value with respect to a standard master at various measurement points of the measuring range. Which of the following terms represents what
30. During a quarterly business meeting, an automotive company reviewed the focus group results presented by the Six Sigma team specific to the customer’s experience with maintenance and servicing of its cars. The results provided significant insight into customer service requirements. In order
29. A local insurance company initiated a Six Sigma project where upper levels of leadership were directly involved. For this project the assigned team knew they would need to gather information at the executive level. Which of the following data collection techniques would be used to collect this
28. During the define phase of a Six Sigma project, a team gathered customer requirement information from customers through focus groups in three different locations in the country. The team concluded from their analysis that they needed further clarification on a couple of key factors. Given that
27. A type of measurement scale that has a rational zero point for the scale is:a. ratio.b. ordinal.c. interval.d. nominal.
26. Which of the following is a type of quantitative data?a. Ordinalb. Nominalc. Continuousd. Categorical
25. The three elements of “what to measure” in the data collection plan are:a. measure, type of measure, sampling plan.b. measure, type of measure, operational definition.c. measurement or test method, stratification level, data collection method.d. measurement or test method, stratification
24. The operational definition in a data collection plan is defined as:a. measurement defined to describe the data to collect.b. measurement of the process improvement observed.c. measurement to achieve repeatable results from multiple observers.d. measurement description of the participants of the
23. The standard deviation for the 10-week period is:a. 1.31.b. 1.28.c. 1.12.d. 1.25.
22. The variance for the 10-week period is:a. 1.57.b. 1.25.c. 1.55.d. 1.28.
21. The range for the 10-week period is:a. 4.0.b. 3.0.c. 3.5.d. 3.7.
20. Which of the following control chart patterns is caused by special sources of variation that gradually affect the quality characteristics of a product or service?a. Cycleb. Shiftc. Trendd. Mixture
19. In reference to process management, removing the causes of an abnormal condition refers to__________, whereas __________ means changing the performance to a new level.a. performance, innovationb. control, improvementc. inspection, innovationd. variation, breakthrough
18. Which of the following tools would be used to categorize the outcome of a brainstorming session?a. Fishbone diagramb. Histogramc. Interrelationship digraphd. Affinity diagram
17. The purpose of a supply chain is to:a. Plan and manage a list of activities to successfully complete goals and deliverables.b. Develop collaborative approaches for delivering goods and services to customers.c. Build confidence that a supplier’s product or service will fulfill its customer’s
16. What is the ultimate goal of an effective supply chain?a. Customer loyaltyb. Reduced costsc. Increased profitsd. Speed to market
15. Which of the following is the most effective way to choose project team members?a. Select all employees who can contribute something worthwhile to the improvement projectb. Include only specialists who are experienced in details specific to the project being initiatedc. Assign a combination of
14. A work team has been assigned the responsibility of collecting data on the number of blemishes on cabinets in a laboratory scheduled for refurbishing.Which of the following tools would be most effective for this assignment?a. Check sheetb. c-chartc. u-chartd. Affinity diagram
13. Which of the following tools is most effective in analyzing data collected on check sheets?a. Cause-and-effect diagramb. Workflow diagramc. Affinity diagramd. Pareto diagram
12. The pattern reflected in a histogram when data values are subject to a natural limit is:a. skewed.b. bimodal.c. bell-shaped.d. symmetrical.
11. Which of the following tools is most effective for determining how purchase orders are handled and who should handle them?a. Pareto chartb. Gantt chartc. Workflow diagramd. Deployment flowchart
10. Which of the following flowchart formats is used to show major steps in a process and occasionally the next level of sub-steps?a. Deploymentb. Top-downc. Opportunityd. Horizontal
9. Which of the following is the most usual progression through the four stages of team growth?a. The team generally spends longer in forming, then quickly progresses through storming, and alternates between norming and performing.b. The team moves quickly through forming to storming and norming,
8. During the first stage of a team’s growth, the most appropriate leadership style for the team leader is to:a. resolve issues of power and authority.b. monitor progress and celebrate achievements.c. fully utilize team member’s skills.d. provide clear direction and purpose.
7. Which of the following is a normal behavior during the storming stage of team growth?a. Arguing between members even when they agree on the real issueb. Ability to prevent or work through group problemsc. Discussions of symptoms or problems not relevant to the taskd. Attempts to determine
6. Which of the following is an initial question to be asked when establishing a team?a. What are the goals of this project?b. What is to be the final solution?c. When are the interim tasks to be completed?d. What type of control charts will be used to analyze the data?
5. Which of the following is a characteristic of an effective project team member?a. Is independent of the department affectedb. Prefers to work on tasks independentlyc. Creative and adept at problem solvingd. Holds strongly to personal opinions
4. Which of the following is a characteristic of successful teams?a. Annual performance appraisalsb. Total agreement on issuesc. Established ground rulesd. High member turnover
3. Which of the following are responsibilities of a natural team?a. Set budgets, manage resources, and schedule workb. Assess other teams’ work product and work closely with team members outside their departmentc. Make decisions affecting multiple departments and recommend new strategic
2 Teams are generally formed in organizational settings by direction from a manager, or a(n):a. quality circle.b. sponsor.c. board of directors.d. audit committee.
1. In a 300-person auto insurance organization forming a project team to determine ways to reduce the cycle time for processing policyholder claims, which of the following choices may represent the most effective size and composition of the project team?a. Four persons, all from the headquarters’
26. The work instruction document answers which of the following questions?a. Why is it done?b. How is it done?c. When is it done?d. Where is it done?
25. Which one of the following would be used to help document work instructions?a. Matrix diagramb. Strategy mapc. Flowchartd. Control plan
24. A(n) _______________ is a step-by-step description of how to complete a task.a. quality management systemb. deployment flowchartc. standard operating procedured. operations checklist
23. The process during the control phase required to control document changes and communication to stakeholders is called:a. document control.b. stakeholder communication.c. process improvement.d. knowledge management.
22. When intentional changes are made in a process, the operator should do which of the following?a. Conduct a root cause analysisb. Open an error recordc. Gather voice of the customer datad. Update all related documents
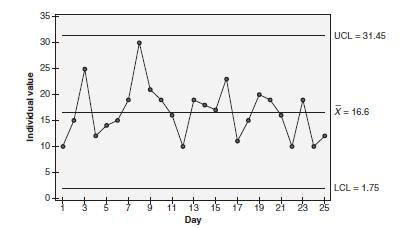
21. What type of variation is displayed in the following individuals chart?a. Special causeb. Common causec. Simple caused. Relative cause Individual value 25 35 30- UCL = 31.45 20- 15+ 10- N X=16.6 5- SH LCL = 1.75 13 15 17 19 19 21 23 25 Day
20. Which of the following is the formula is used to construct the upper control limits of the X and R chart?a. X + A2Rb. X − A2Rc. X+E2Rd. X −E2R
19. Which of the following indicates on a control chart what a process should be capable of doing?a. Standard deviationb. Control limitsc. Specification limitsd. Variance
18. Which of the following is true regarding control charts?a. Control charts can be used to monitor a process for the existence of common cause variation.b. The major components of a control chart are the lower specification limits, the centerline, and the upper specification limits.c. Control
17. Which one of the following is an advantage of using a control chart?a. Provide consistency between operators, shifts, and facilitiesb. Provide a process for monitoring the voice of the customerc. Provide performance results based on specification limitsd. Provide a method for analyzing
16. The purpose of a control plan is:a. to summarize the results of the capability analysis.b. to document objectives of the project.c. to explain how to control the workflow in a process.d. to record information on sample size determination.
15. Which of the following is a control plan that provides for a written method to describe the system that controls the proper usage of the equipment to help ensure that measurement variation is as low as possible given the current set of conditions?a. Gageb. Dynamicc. Frequencyd. Measure
14. The _______________ combines necessary information into one document to help plan, monitor, control, study, and maintain your process.a. dynamic control planb. measurement control planc. communication control pland. gage control plan
13. The following steps would be used to create which document that ensures the correct monitoring and measurement of required actions and process outcomes?1. Specify those variables with direct or indirect impact to the remedy and the customer.2. Establish the control limits and standards for when
12. Control ________ provide a structured approach for the design, selection, and implementation of value-added control methods for the total system.a. panelsb. chartsc. indicatorsd. plans
11. Cost/benefit analysis is used in the ________________ phase of a Six Sigma project.a. defineb. measurec. improved. control
10. A quality tool closely aligned with assessing the financial impact of poor quality is:a. statistical process control.b. the Shewhart cycle.c. cost/benefit analysis.d. quality function deployment.
9. The time it takes to recoup the investment made in a project (the shorter the period, the better) is referred to as:a. payback period.b. recoup cycle.c. internal rate of return.d. return on investment.
8. The PDSA improvement model was modified to PDCA by which of the following quality gurus?a. Dr. W. Edwards Demingb. Joseph M. Juranc. Philip B. Crosbyd. Armand F. Feigenbaum
7. The plan stage of the PDCA cycle includes which of the following activities?a. Maintain and standardizeb. Set targets and schedulesc. Plan implementation activitiesd. Select the next project
6. In the __________ stage of the Deming cycle the team evaluates the effects of the implementation.a. checkb. doc. pland. act
5. In which stage of the Deming cycle is a plan implemented on a trial basis?a. Studyb. Testc. Dod. Act
4. The individual attributed with making the practice of kaizen popular is:a. Kaoru Ishikawa.b. Masaaki Imai.c. Eiji Toyoda.d. Genichi Taguchi.
3. Incremental improvement, or kaizen, is achieved by:a. frontline employees.b. top management.c. customers.d. middle management.
2. When a team must address a critical problem, they often schedule an intense, short time frame (typically 3–5 consecutive days) to apply the concepts and techniques of continual improvement (for example, to reduce cycle time, increase throughput, and reduce waste). What is this intense
1. A Japanese term that means gradual, unending improvement by doing little things better and setting and achieving increasingly higher standards is what?a. Poka-yokeb. Gembac. Heijunkad. Kaizen
37. Which of the following is the correct conclusion?a. Reject the null hypothesisb. Fail to reject the null hypothesisc. Accept the null hypothesisd. Fail to accept the null hypothesis
36. Which of the following is the null hypotheses?a. μ = 85b. μ ≠ 85c. μ = 88.33d. μ ≠ 88.33
35. Which of the following is representative of a two-tailed hypothesis test?a. H0: μ ≤ 0; H1: μ > 0b. H0: μ ≥ 0; H1: μ < 0c. H0: μ = 0; H1: μ ≠ 0d. H0: μ > 0; H1: μ ≤ 0 Use the following output from a one-sample t-test for questions 36–37.Test of = 85 vs 85 Variable N Mean
34. A type I error occurs when the:a. null hypothesis is rejected when it is true.b. sample size is too small.c. null hypothesis is not rejected when it is false.d. power of the test is < .80.
33. Which of the following is a linear equation representing a straight line?a. ˆy = a + bxb. ˆy = ax+ bc. ˆy = a + bx2d. ˆy = ax2 + b
32. Which of the following is a graphical component of regression analysis?a. Quality function deploymentb. Scatter diagramc. Standard deviationd. Interrelationship digraph
31. Which of the following statistics provides evidence that time spent in training is a significant driver of safety scores?a. S = 6.44725b. R2 (adj) = 80.14%c. t = 18.19d. p value < .05
29. The correlation coefficient “r” is expressed as a number between ____________________ and ___________.a. 1.00, –1.00b. 0.50. –0.50c. 2.00, –2.00d. 1.50, –1.50 30. Based on the output above, ____________________ of the variation in safety scores is explained by time spent in
28. A Six Sigma project team wants to determine whether there is a linear relationship between the tenure of call center representatives and customer satisfaction. Which of the following would indicate there is a linear relationship between these two variables?a. Pearson correlation coefficientb.
27. Which of the following would indicate a strong positive linear relationship between two variables?a. .25b. .80c. .50d. .00
26. Which of the following tools is used to identify special cause variation?a. Run chartb. Pareto chartc. Control chartsd. Histogram
25. Which of the following describes when to use Hypothesis Testing:a. To understand the probability that results could have occured through random chance.b. To understand the likelihood that special cause variation is the source of the increase in cycle time.c. To understand if there is a causal
24. When a system is affected only by common cause variation, that system:a. is optimized.b. is affected by external sources.c. meets a customer’s quality specifications.d. is in control.
23. Which of the following formulas represents the normal distribution?a. P(x) = le−1xb. P(x) = e−(x−μ )2 2σ 2σ 2πc. P(x) = n!x!(n − x)! px(1− p)n−xd. P(x) = e−1lx x!
22. The binomial distribution is used to model which of the following types of data?a. Continuous datab. Discrete datac. Variable datad. Ordinal data
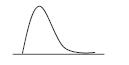
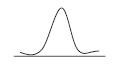
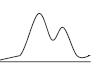
21. Which of the following diagrams represents a bimodal distribution?a.b.c.d.
20. A Six Sigma project team is analyzing cycle time for an underwriting application process. The target for cycle time is Which of the following best describes the shape of this distribution?a. No skewb. Horizontal skewc. Positive skewd. Negative skew
19. Which of the following is accurate for the normal distribution?a. The mean of the sampling distribution of means is equal to the mean of the population.b. The variance of the sampling distribution is not equal to the variance of the population.c. The normal probability plot graphically shows
18. During a process planning effort, which of the following tools identifies progressively finer levels of actions needed to design new products or services with no errors?a. Force-field analysisb. SIPOCc. Tree diagramd. Gantt chart
17. When designing a manufacturing process for preventive action, which of the following are the two major poka-yoke system approaches that can be applied?a. Corrective and preventiveb. Alpha and betac. Major and minord. Control and warning
16. Which of the following is a common approach to effective corrective action?a. 8 Disciplinesb. Hoshin Kanric. Correlation Analysisd. Taguchi method
15. Complete the following sentence: The difference between corrective action and preventive action is:a. the level of management involved.b. who discovers the defect.c. the timing of the problem.d. how the resolution is documented.
14. When an improvement team needs a problem-solving approach to identify, correct, and eliminate recurring problems, which of the following might they correctly choose?a. Taguchi methodb. 8 Disciplinesc. Correlation analysisd. Quality function deployment
13. When starting on a new 8D (8 Disciplines) process, what is the first step?a. Map the current processb. Initiate a root cause analysisc. Organize a small groupd. Stop future problems
12. A diagram that graphically illustrates the relationship between a given outcome and all the factors that influence the outcome is referred as a:a. cause-and-effect matrix.b. Ishikawa diagram.c. histogram.d. control chart.
11. Root cause analysis depends on an accurate map of the process under study.Another term for process mapping is:a. flowcharting.b. critical path.c. is/is not analysis.d. brainstorming.
10. The ______________is a good tool for prioritizing the potential root causes of a problem.a. histogramb. control chartc. radar chartd. matrix diagram
9. Which of the following tools is the best choice in collecting data to identify potential causes during a root cause analysis?a. Design of experimentsb. Customer surveyc. Force-field analysisd. Taguchi method
8. In the first step of a process FMEA—review the design/process—the team does which of the following?a. Uses a flowchart to identify the scope and to ensure that every team member understands it in detailb. Lists possible causes for every failure modec. Assigns a detection rating based on the
7. In creating the risk priority number, the three scales are calculated using which mathematical function?a. Addb. Subtractc. Multiplyd. Divide
6. In creating a risk priority number, what are the three scales that are calculated together?a. Cycle time, occurrence, priorityb. Severity, range, priorityc. Cycle time, range, detectiond. Severity, occurrence, detection
5. Which of the following FMEA versions looks at how a part actually is produced on the shop floor and the various effects that can arise?a. Systemb. Processc. Designd. Product
4. ______________ is a process analysis tool used to understand the rate of customer demand.a. Processing timeb. Takt timec. Lead timed. Cycle time
3. ______________ is a system of sending delivery signals from downstream to upstream activities where the upstream supplier does not produce until the downstream customer signals the need.a. Kanban/pullb. Point-of-use storagec. Visual controlsd. 5S
2. The ABC Company is studying problems due to delays across a number of different activities. Each activity has been tested and runs perfectly on its own.These delays can most effectively be identified through:a. value analysis.b. brainstorming.c. prioritization matrices.d. just-in-time.
1. Which of the following tools is used to reduce problems arising from poor housekeeping or organization?a. 5 Whysb. 8Dc. 5Sd. A3
Showing 200 - 300
of 911
1
2
3
4
5
6
7
8
9
10
Step by Step Answers