New Semester
Started
Get
50% OFF
Study Help!
--h --m --s
Claim Now
Question Answers
Textbooks
Find textbooks, questions and answers
Oops, something went wrong!
Change your search query and then try again
S
Books
FREE
Study Help
Expert Questions
Accounting
General Management
Mathematics
Finance
Organizational Behaviour
Law
Physics
Operating System
Management Leadership
Sociology
Programming
Marketing
Database
Computer Network
Economics
Textbooks Solutions
Accounting
Managerial Accounting
Management Leadership
Cost Accounting
Statistics
Business Law
Corporate Finance
Finance
Economics
Auditing
Tutors
Online Tutors
Find a Tutor
Hire a Tutor
Become a Tutor
AI Tutor
AI Study Planner
NEW
Sell Books
Search
Search
Sign In
Register
study help
business
statistics econometrics
Making Sense Of Statistics A Conceptual Overview 7th Edition Fred Pyrczak, Deborah M. Oh - Solutions
Which of the following statements is true (circle one)?
Give an example of one continuous data and one categorical data with two categories that would require performing a Dependent Samples t Test.
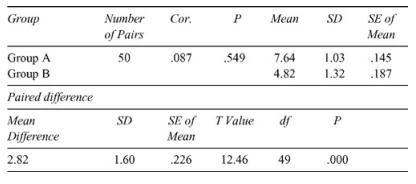
Given the results below what would you conclude about the mean difference between Group A and Group B? Group Number Cor. P Mean SD SE of of Pairs Mean Group A 50 .087 .549 7.64 1.03 .145 Group B 4.82 1.32 .187 Paired difference Mean SD SE of T Value df P Difference Mean 2.82 1.60 .226 12.46 49 .000
The Dependent Samples t Test would have less sampling error in its design. Discuss the reasons.
In a Dependent Samples t Test what is the df for a sample of 100 participants in a particular study?
What is Dependent Samples t Test with one sample also known as?
What are the similarities in the assumptions behind both the Dependent and Independent Samples t Test?
How is the Dependent Samples t Test different from Independent Samples t Test in terms of samples?
Give an example of one continuous data and one categorical data with two categories that would require performing an Independent Samples t Test.
What do the following results indicate in terms of rejecting the null hypothesis: (t = 3.20, df = 28, p < .05, two-tailed test)?
Calculating the standard error of the difference between means depends on the standard deviations as well as the sample sizes between the groups, and can be considered equal or unequal. This statement is(circle one)?True False
Generally, the larger the samples, the smaller the standard errors become, increasing the likelihood of finding statistical significance. This statement is (circle one)?True False
The above alternative hypothesis would be (circle one)?Nondirectional hypothesis Directional hypothesis
In another study, if the alternative hypothesis is μ1 < μ2, and you concluded in favor of the alternative hypothesis, in words what you would conclude?
The above alternative hypothesis would be (circle one)?Nondirectional hypothesis Directional hypothesis
If alternative hypothesis is as follows: HA: μ1 ≠ μ2, and you rejected the null hypothesis in favor of the alternative hypothesis, state in words what you would conclude.
In the above scenario, state the null and the alternative hypotheses.
Assume that a researcher interested in growth spurts among young teens decided to measure the height difference between boys and girls in middle school from a random sample of 200 boys and girls. In this study, what are the two variables of interest and which of the two variables is the independent
What is the scenario when performing an Independent Samples t Test is required?
Which type of data tends to have less sampling error (circle one)?Independent Dependent
If participants are first paired before being randomly assigned to experimental and control groups, are the resulting data “independent” or “dependent”?
If there is no variation among members of a population, is it possible to have sampling errors when sampling from the population?
The smaller the observed difference between two means, the (circle one)more likely the null hypothesis will be rejected.less likely the null hypothesis will be rejected.
The larger the sample, the (circle one)more likely the null hypothesis will be rejected.less likely the null hypothesis will be rejected.
If a t test yields a low probability, such as p < .05, what decision is usually made about the null hypothesis?
The t test is used to test the difference between two population means to determine statistical significance.
The t test is used to test the difference between two sample means to determine statistical significance.
Which of the following statements is true (circle one)?
What is the name of the hypothesis which states that the observed difference is due to sampling errors created by random sampling?
Example 1 mentions how many possible explanations for the 3-point difference?
Is it possible for a researcher to reject the null hypothesis with absolute certainty?
When p > .05, is the difference usually regarded as “statistically significant” or “statistically insignificant”?
When p < .05, is the difference usually regarded as “statistically significant” or “statistically insignificant”?
Is the “.01 level” or the “.001 level” more significant?
Is the “.05 level” or the “.01 level” more significant?
If a difference is declared statistically significant, what decision is being made about the null hypothesis?
What is the name of the error of rejecting the null hypothesis when it is true?
What is a synonym for the phrase “rejecting the null hypothesis”?
Which of the following indicates that the probability is less than 5 in 100 (circle one)?p < .05.p > .05.
What does an inferential test of a null hypothesis yield as its final result?
A researcher has studied all the girls and all the boys in the populations of boys and girls in a school. The researcher has found a difference between the mean for boys and the mean for girls. Is the null hypothesis a possible explanation for the difference? Explain.
What is the name of the branch of statistics that has statistical techniques that can be used to test the truth of the null hypothesis?
For what does the symbol μ1 stand?
What is the symbol for an alternative hypothesis?
What is the symbol for the null hypothesis?
Consider this hypothesis, which is expressed in symbols: HA: μ1 > μ2. Is this a “directional” or a“nondirectional” hypothesis?
If a researcher believes that Group A will have a higher mean than Group B, is his or her research hypothesis “directional” or “nondirectional”?
A researcher’s “expectation” is called what?
What is the name of the hypothesis which states that a researcher has found a difference between the means of the two randomly selected samples only because of the chance errors associated with random sampling?
To what extent do the scattergrams in this chapter and the discussion of them help you to understand the concept of correlation and the meanings of various values of the Pearson r? Explain.
When the dots on a scattergram form a pattern going from the upper left to the lower right, what type of relationship is indicated?
Which of the four scattergrams in this chapter has the greatest amount of scatter?
When a relationship is perfect, what is the percentage of explained variance?“Perfect relationships are frequently found in the social and behavioral sciences.” This statement is (circle one) A. true; B. false.
“The more scattered the dots are in a scattergram, the stronger the relationship.” This statement is (circle one) A. true; B. false.
In Example 1 on page 96, Jude and Jake have the two highest math scores and the two highest algebra grades. This suggests that the relationship is (circle one) A. direct; B. inverse.
While scattergrams are seldom presented in research reports, they are useful for obtaining what?
What is the general term that refers to the extent to which two variables are related across one group of participants?
Very briefly describe a study you might conduct in which it would be appropriate to compute a Pearson r(i.e., a study with one group of participants, with two scores per participant). Predict whether the r would be “positive” or “negative” in direction and whether it would be “high” or
Consider a value of r of .50. Would it be appropriate to multiply this value by 100 and to interpret it as representing 50%?
Consider a value of r of .65. According to this chapter, would it always be appropriate to characterize the relationship as being “very strong”?
Is it possible for a relationship to be both inverse and strong?
Is it possible for a relationship to be both direct and weak?
Which one of the following indicates the weakest relationship:A. .93; B. –.88; C. –.95; D. .21?
Are inverse relationships always weak?
Which one of the following indicates the strongest relationship:A. .68; B. .77; C. –.98; D. .50?
What does a Pearson r of –1.00 indicate?
What does a Pearson r of 0.00 indicate?
What is the full, formal name of the Pearson r?
Name two variables that you think have an inverse relationship with each other.
Name two variables that you think have a direct relationship with each other.
When a large number of cases are examined and a positive relationship is found, what else should one expect to find?
Is correlation a good way to determine cause-and-ef ect?
What type of study is needed in order to identify cause-and-ef ect relationships?
In an inverse relationship, those who tend to score low on one variable tend to have what kind of score on the other variable?
In an inverse relationship, those who tend to score high on one variable tend to have what kind of score on the other variable?
There is a positive relationship between the scores on Tests E and F. Which participant is an exception to the rule? Explain why he or she is an exception.Participant Test E Test F Homer 1050 160 Billy 2508 169 Scott 2702 184 Kathy 3040 205 Leona 5508 90 Bruce 5567 210
Is the relationship between the scores on Test C and Test D “direct” or “inverse”?Participant Test C Test D Monica 1 33 Lola 2 38 Jim 4 40 Oscar 6 45 Joey 8 52 Cathleen 9 57
Is the relationship between the scores on Test A and Test B “direct” or “inverse”?Participant Test A Test B David 20 600 Julie 30 500 Happy 40 400 Shorty 50 300 Marcia 60 200 Kelly 70 100
What is another name for an inverse relationship?
A direct relationship was found between scores on a reading test and a vocabulary test. This indicates that those who scored high on the reading test tended to have what kind of score on the vocabulary test(circle one): A. high score or B. low score?
The Scholastic Aptitude Test (SAT) total scores range from 400 to 1,600 with a mean of 1,020 and standard deviation of 194.What is the z score of the score of 1,214? And what does this mean in terms of its percentile score?
If another student received a test score that showed a z score of 0, what does this mean?
How does this student’s z score differ from another student whose z score is –3.00?
Discuss in terms of its percentile score.
Discuss in terms of units of standard deviation.
Suppose a student’s z score is 3.00. What does this mean?
What do z scores help us understand?
What do z scores refer to?
Suppose M = 80 and S = 10 for a normal distribution of scores. About 68% of the cases lie between what two scores?
Suppose M = 30 and S = 3 for a normal distribution of scores. What percentage of the cases lies between scores of 27 and 30?
What percentage of the cases in a normal curve lies within one standard deviation unit of the mean (i.e., within one unit above and one unit below the mean)?
If you read the following statistics in a research report, which group should you conclude has the greatest variability?Group F: M = 30.23, S = 2.14 Group G:M = 25.99, S = 3.01 Group H:M = 22.43, S = 4.79
If all the participants in a group have the same score, what is the value of the standard deviation of the scores?
Will the scores for “Group D” or “Group E” below have a larger standard deviation if the two standard deviations are computed? (Do not compute the standard deviations; examine the scores to determine the answer.)Group D:23, 23, 24, 25, 27, 27, 27 Group E:10, 19, 20, 21, 25, 30, 40
What is the symbol for the standard deviation when a population has been studied?
If the differences among a set of scores are small, this indicates which of the following (circle one)?There is much variability There is little variability
The standard deviation provides an overall measurement of how much participants’ scores differ from what other statistic?
Is the standard deviation a frequently used measure of variability?
The term variability refers to what?
When the median is reported as the average, it is also customary to report which measure of variability?
Showing 4900 - 5000
of 7357
First
43
44
45
46
47
48
49
50
51
52
53
54
55
56
57
Last
Step by Step Answers