New Semester
Started
Get
50% OFF
Study Help!
--h --m --s
Claim Now
Question Answers
Textbooks
Find textbooks, questions and answers
Oops, something went wrong!
Change your search query and then try again
S
Books
FREE
Study Help
Expert Questions
Accounting
General Management
Mathematics
Finance
Organizational Behaviour
Law
Physics
Operating System
Management Leadership
Sociology
Programming
Marketing
Database
Computer Network
Economics
Textbooks Solutions
Accounting
Managerial Accounting
Management Leadership
Cost Accounting
Statistics
Business Law
Corporate Finance
Finance
Economics
Auditing
Tutors
Online Tutors
Find a Tutor
Hire a Tutor
Become a Tutor
AI Tutor
AI Study Planner
NEW
Sell Books
Search
Search
Sign In
Register
study help
mathematics
practical business statistics
Practical Business Statistics 7th Edition Andrew Siegel - Solutions
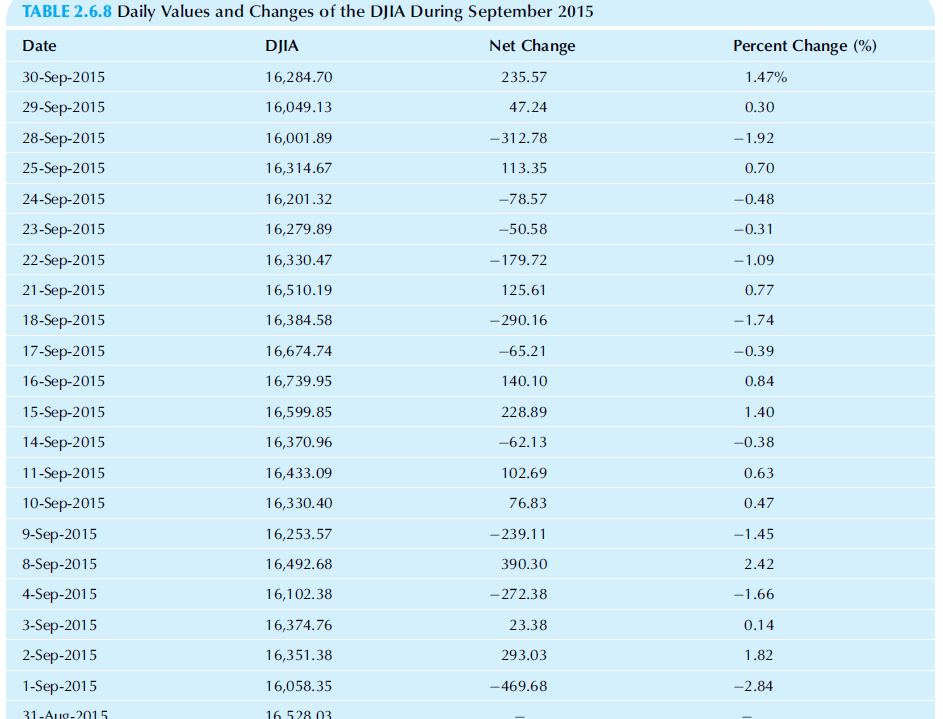
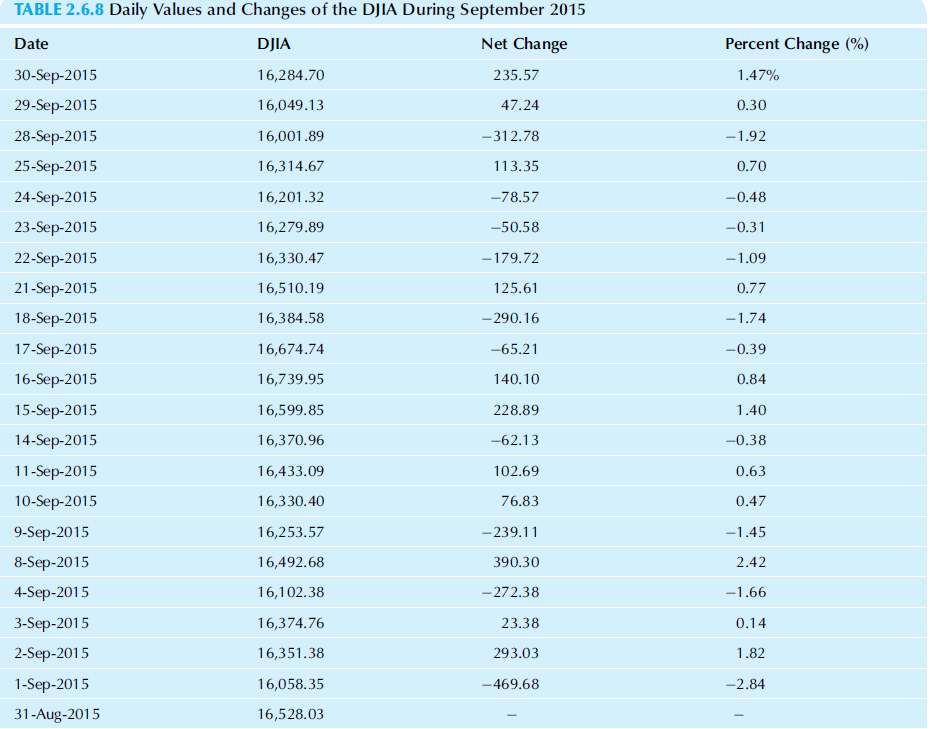
Using the data from Table 2.6.8 of Chapter 2 for daily values for the Dow Jones Industrial Average: a. Find the standard deviation of the net change. b. Find the range of net change. c. Find the standard deviation of the percent change. d. Find the range of the percent
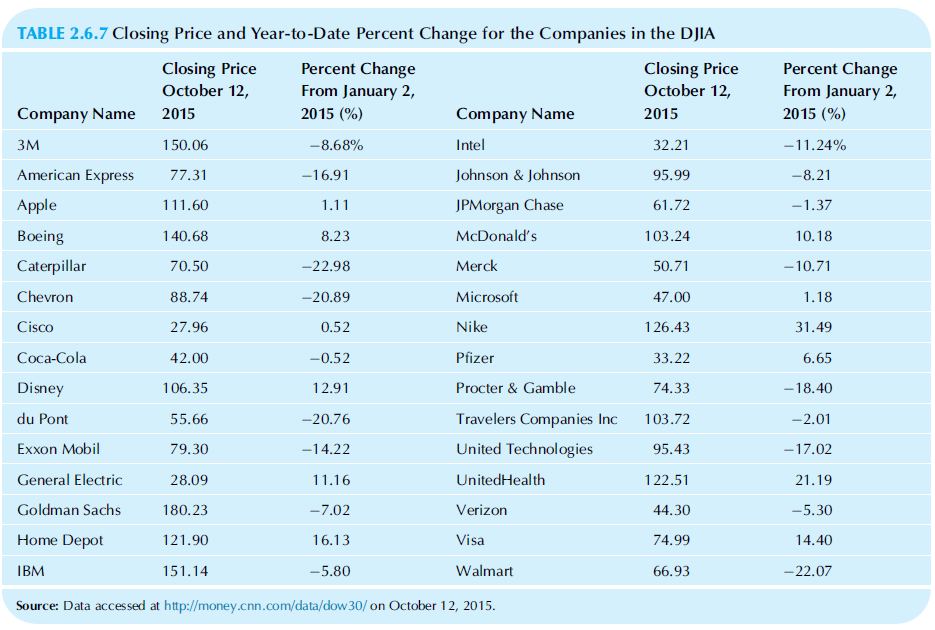
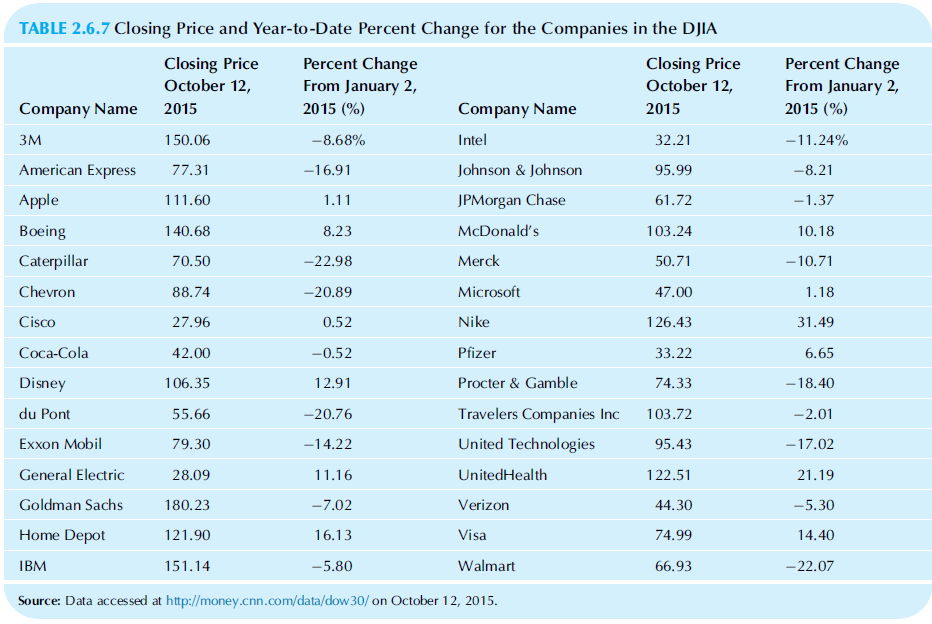
Using the data from Table 2.6.7 of Chapter 2 for the 30 Dow Jones Industrial companies percent changes since January 2015: a. Find the standard deviation of the percent change. b. Find the range of the percent change. TABLE 2.6.7 Closing Price and Year-to-Date Percent Change for the
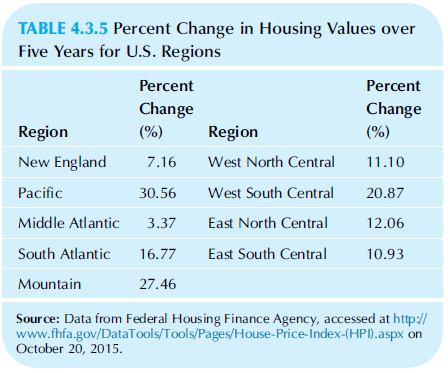
Find the amount of variability in the 5-year percent change in housing prices for U.S. regions using the data from Table 4.3.5 of Chapter 4. TABLE 4.3.5 Percent Change in Housing Values over Five Years for U.S. Regions Percent Percent Change Change Region (%) Region (%) New England 7.16 West
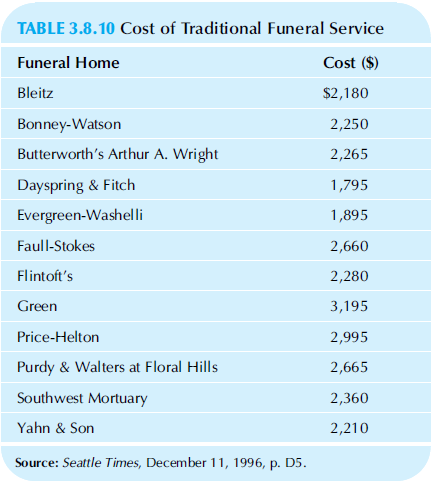
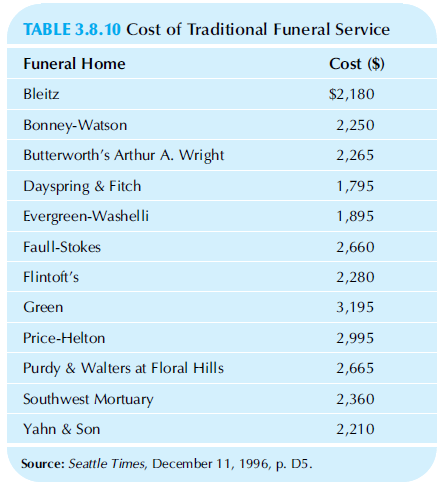
Summarize the variability in the cost of a traditional funeral service using the standard deviation, based on the data in Table 3.8.10 of Chapter 3. TABLE 3.8.10 Cost of Traditional Funeral Service Funeral Home Cost ($) Bleitz $2,180 Bonney-Watson 2,250 Butterworth's Arthur A. Wright 2,265
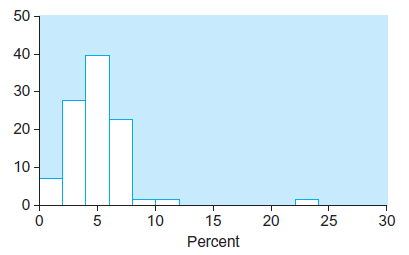
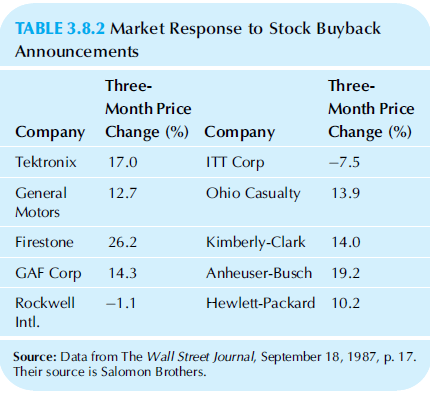
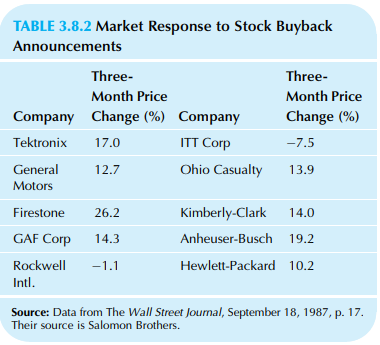
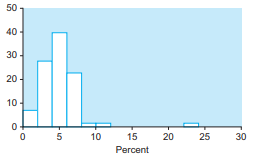
Using the data from Table 3.8.2 in Chapter 3, find the standard deviation and range to summarize the typical variability (or uncertainty) of the market response to stock buyback announcements. 50 40 - 30 20 - 10 - 5 10 15 20 30 25 Percent
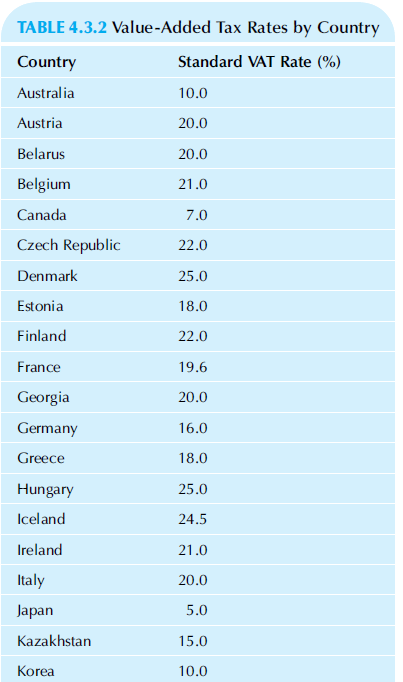
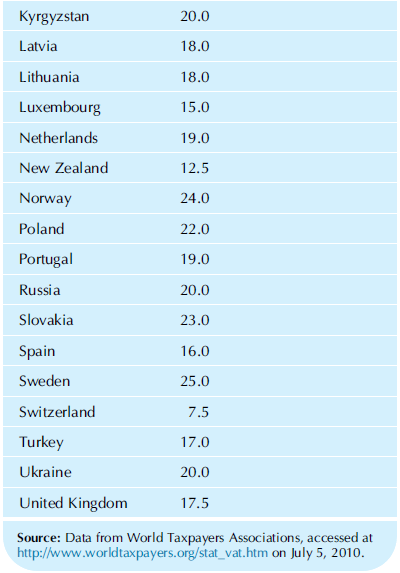
Find the standard deviation of the VAT taxes from Table 4.3.2 in Chapter 4. What does this tell you about international taxation practices from one country to another? TABLE 4.3.2 Value-Added Tax Rates by Country Standard VAT Rate (%) Country Australia 10.0 Austria 20.0 Belarus 20.0 Belgium
You are sales manager for a regional division of a beverage company. The sales goals for your representatives have an average of $768,000 with a standard deviation of $240,000. You have been instructed to raise the sales goal of each representative by $85,000. What happens to the standard deviation?
Your costs had been forecast as having an average of $138,000 with a standard deviation of $35,000. You have just learned that your suppliers are raising prices by 4% across the board. Now what are the average and standard deviation of your costs?
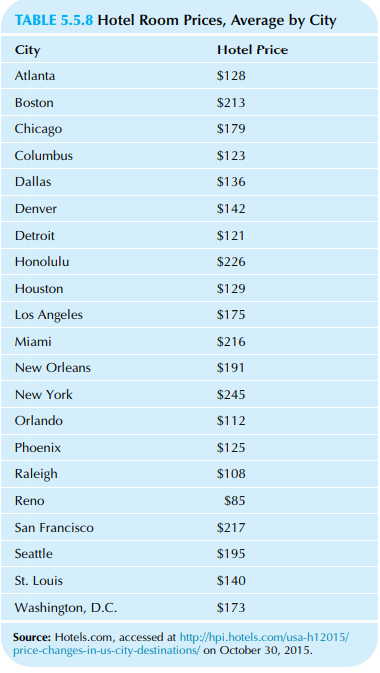
Consider the average price of a hotel room in 21 U.S. cities (Table 5.5.8) for the first half of 2015. a. Find the average price of a major-city hotel room in the United States, based on this data set. b. Find the sample standard deviation of these prices. c. What does the standard
Here are weights of recently produced sinks: 20.8, 20.9, 19.5, 20.8, 20.0, 19.8, 20.1, 20.5, 19.8, 20.3, 20.0, 19.7, 20.3, 19.5, 20.2, 20.2, 19.5, 20.5 Find the usual summary measure that tells approximately how far from average these weights are.
Consider interest rates on accounts at a sample of local banks: 3.00%, 4.50%, 4.90%, 3.50%, 4.75%, 3.50%, 3.50%, 4.25%, 3.75%, 4.00% a. Find the standard deviation of these interest rates. b. What does this standard deviation tell you about banks in this area?
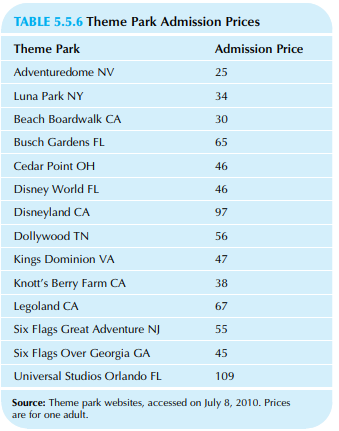
Summarize the variability in admission prices for the theme parks shown in Table 5.5.6 by reporting the standard deviation, the range, and the coefficient of variation. TABLE 5.5.6 Theme Park Admission Prices Theme Park Admission Price Adventuredome NV 25 Luna Park NY 34 Beach Boardwalk CA 30
Which variability measure is most useful for comparing variability in two different situations, adjusting for the fact that the situations have very different average sizes? Justify your choice.
a. What is the coefficient of variation? b. What are the measurement units of the coefficient of variation?
a. What is the variance?b. What are the measurement units of the variance?c. Which is the more easily interpreted variability measure, the standard deviation or the variance? Why?d. Once you know the standard deviation, does the variance provide any additional real information about the variability?
a. What is the traditional measure of variability? b. What other measures are also used?
What is variability?
Using the data from Table 2.6.8 of Chapter 2 for daily values for the Dow Jones Industrial Average: a. Find the mean net change. b. Find the median net change. c. Find the five-number summary for net change. d. Draw a box plot for net change. e. Find the mean percent
Using the data from Table 2.6.7 of Chapter 2 for the 30 Dow Jones Industrial companies percent changes since January 2015: a. Find the mean percent change. b. Find the median percent change. c. Find the five-number summary for percent change. d. Draw the box plot for percent
Summarize prices of funeral services using the average and median, based on the data in Table 3.8.10 of Chapter 3. TABLE 3.8.10 Cost of Traditional Funeral Service Funeral Home Cost ($) Bleitz $2,180 Bonney-Watson 2,250 Butterworth's Arthur A. Wright 2,265 Dayspring & Fitch 1,795
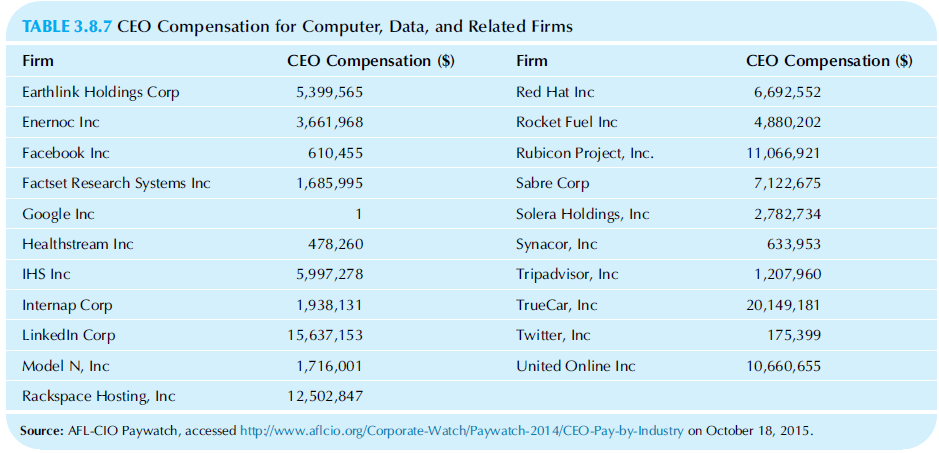
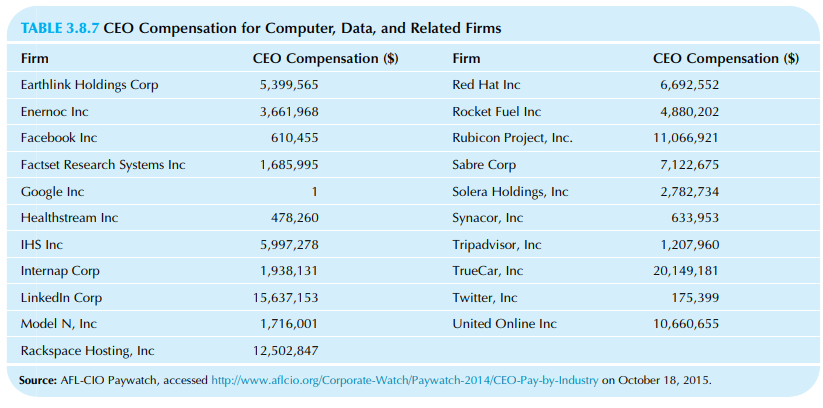
Consider the data on CEO compensation in computer programming, data processing, and other related services firms from Table 3.8.7 of Chapter 3. a. Draw a detailed box plot. b. Find the 10th percentile of compensation. TABLE 3.8.7 CEO Compensation for Computer, Data, and Related
A wine store carries 86 types of wine produced in 2007, 125 types from 2008, 73 from 2009, and 22 from 2010. Identify the types of wine as the elementary units for analysis. a. Find the mode of the year of production. What does this tell you? b. Find the average year of production and
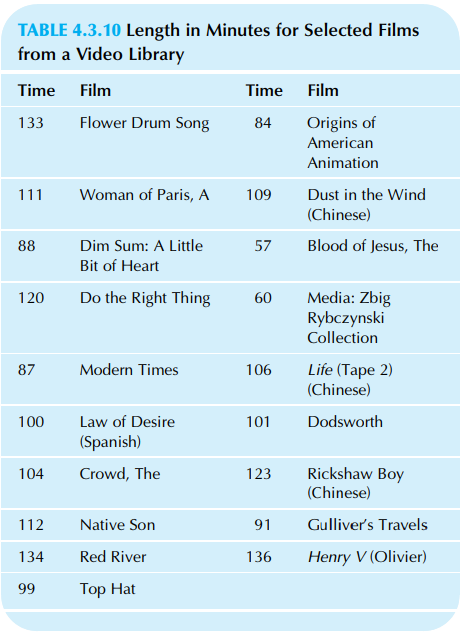
A social group shows only movies of 100 min or less at its meetings. Consider the running times of selected films from a video library as shown in Table 4.3.10. a. What percentage of these movies can the group show? b. What is the name of the longest of these movies that could be
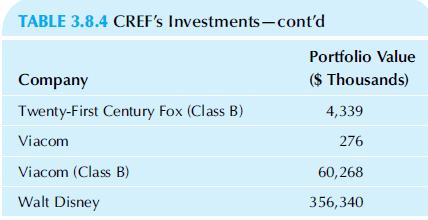
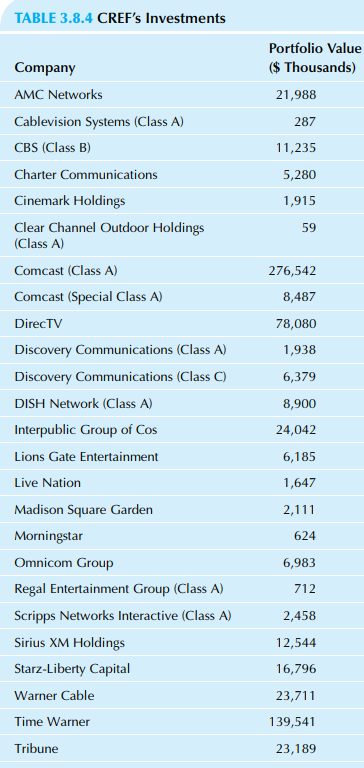
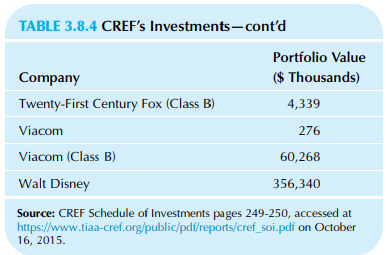
Using the data from Table 3.8.4 in Chapter 3, for the market values of the portfolio investments of the College Retirement Equities Growth Fund in the media sector: a. Find the average market value for these firms’ stock in CREF’s Growth Fund portfolio. b. Find the median of these
Using the data from Table 3.8.2 in Chapter 3, find the average and median to summarize the typical size of the market response to stock buyback announcements. TABLE 3.8.2 Market Response to Stock Buyback Announcements Three- Three- Month Price Month Price Company Change (%) Company Change (%)
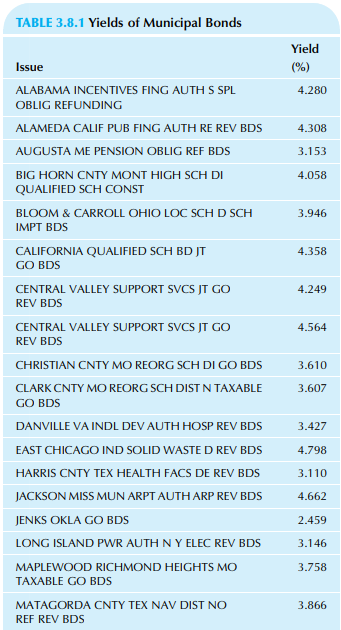
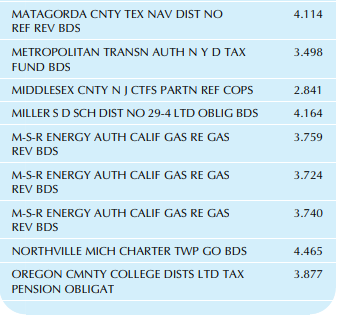
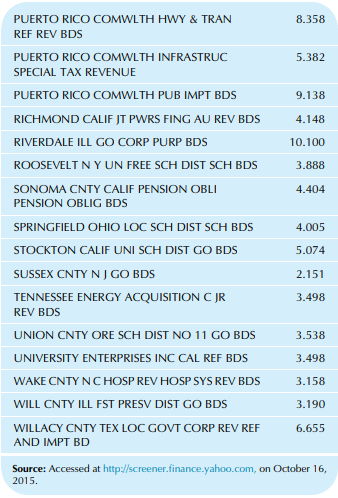
For the yields of municipal bonds (Table 3.8.1 in Chapter 3): a. Find the average yield. b. Find the median yield. c. Find the quartiles. d. Find the five-number summary. e. Draw a box plot of these yields. f. Identify the outliers, if any, and draw a detailed box
If you had a list of the miles per gallon for various cars, which of the following is the only possibility for the 65th percentile: 65 cars, 65%, $13,860, or 27 miles per gallon?
Your factory’s inventory level was measured 12 times last year, with the results shown below. Find the average inventory level during the year. 313, 891, 153, 387, 584, 162, 742, 684, 277, 271, 285, 845
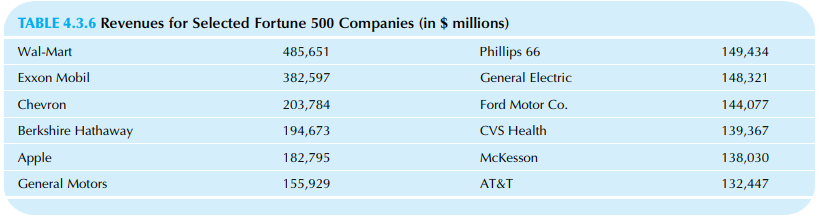
Consider the revenues (in $ millions) for the top 12 companies in the Fortune 500 (from http://fortune.com/ fortune500/ accessed October 20, 2015.), as shown in Table 4.3.6. a. Find the five-number summary. b. Draw a box plot. TABLE 4.3.6 Revenues for Selected Fortune 500 Companies
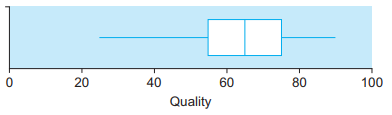
Find the upper quartile for the following box plot. 20 40 60 80 100 Quality 20
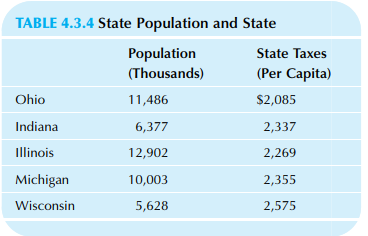
Given the state taxes and populations for the East North Central States, as shown in Table 4.3.4, compute the percapita state tax burden for this entire region. TABLE 4.3.4 State Population and State Population (Thousands) State Taxes (Per Capita) Ohio 11,486 $2,085 Indiana 6,377 2,337
A large outdoor recreational facility has three entrances. According to automatic vehicle counters, last year 11,976 vehicles entered at the first entrance, 24,205 at the second, and 7,474 at the third. A survey done at each entrance showed that the average planned length of stay was 3.5 days at
Your marketing research team has identified four distinct groups of people (Type A, B, C, and D, where D represents “all others”) according to personality traits. You figure that market penetration for a new product will be highest among Type A personalities, with 38% purchasing the product
Active consumers make up 13.6% of the market and spend an average of $16.23 per month on your product. Passive consumers make up 23.8% of the market and spend $9.85. The remaining consumers have average spending of $14.77. Find the average spending for all consumers.
Your firm has the following securities outstanding: common stock (market value $4,500,000; investors demand 17% annual rate of return), preferred stock (market value $1,700,000; current annual yield is 13%), and 20-year bonds (market value $2,200,000; current annual yield is 11%). Find your cost
Some people who work at your company would like to visually compare the income distributions of people who buy various products in order to better understand customer selections. For each of 16 products, a list of incomes of representative customers (who bought that product) has been obtained. What
Your company is trying to estimate the total size of its potential market. A survey has been designed, and data have been collected. A histogram of the data shows a small amount of skewness. Which summary measure would you recommend to the company for this purpose and why?
What is a box plot? What additional detail is often included in a box plot?
What is the five-number summary?
What are the quartiles?
What is the mode?
How should you deal with exceptions when summarizing a set of data?
What is the summarization of a data set? Why is it important?
Using the data from Table 2.8 of Chapter 2 for daily values for the Dow Jones Industrial Average: a. Construct a histogram for net change during September 2015. b. Describe the shape of the distribution. c. Construct a histogram for percent change during September 2015. d. Describe
Business firms occasionally buy back their own stock for various reasons, sometimes when they view the market price as a bargain compared to their view of its true worth. It has been observed that the market price of stock often increases around the time of the announcement of such a buyback.
Using the data from Table 2.7 of Chapter 2 for the 30 Dow Jones Industrial companies: a. Construct a histogram for percent change since January 2015. b. Describe the shape of the distribution.
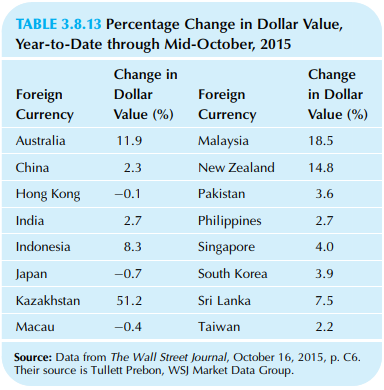
Consider the percentage change in the value of the dollar with respect to Asia-Pacific currencies over approximately three quarters from the start of 2015 through mid-October (Table 3.8.13). a. Construct an appropriate histogram of this data set. b. Describe the distribution shape.
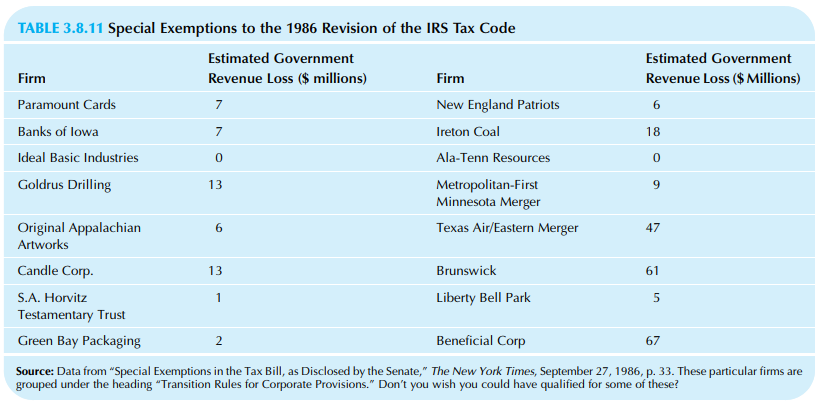
Continuing with the revenue loss data of Table 3.8.11: a. Find the logarithm for each data value. Omit the two firms with zero revenue loss from your answers to this problem. b. Construct a histogram for this data set. c. Describe the distribution shape. d. Compare this analysis
When the Internal Revenue Service (IRS) tax code was revised in 1986, Congress granted some special exemptions to specific corporations. The U.S. government’s revenue losses due to some of these special transition rules for corporate provisions are shown in Table 3.8.11. a. Construct a
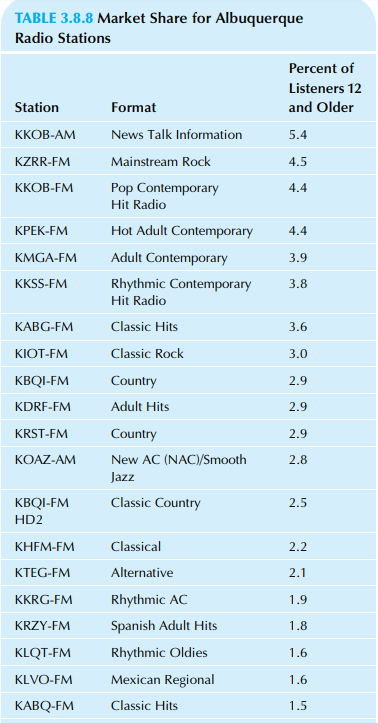
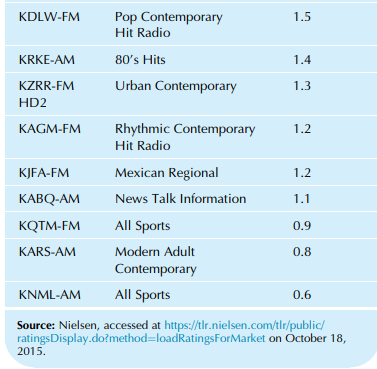
There are many different and varied formats and strategies for radio stations, but one thing they all have in common is the need for an audience in order to attract advertisers. Table 3.8.8 shows the percent of listeners for radio stations in the Albuquerque area (averages for ages 12 and older, 6
Consider the compensation paid to CEOs of computer programming, data processing, and other related services firms, as shown in Table 3.8.7. a. Construct a histogram. b. Describe the distribution shape. TABLE 3.8.7 CEO Compensation for Computer, Data, and Related Firms CEO
Consider CREF, the College Retirement Equities Fund, which manages retirement accounts for employees of nonprofit educational and research organizations. CREF manages a large and diversified portfolio in its growth stock account, somewhere around $22.5 billion. Investment in media represents 5.0%
Consider the yields (as an interest rate, in percent per year) of municipal bonds, as shown in Table 3.8.1. a. Construct a histogram of this data set. b. Based on the histogram, what values appear to be typical for this group of tax-exempt bonds? c. Describe the shape of the
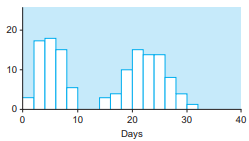
What distribution shape is represented by the histogram in Fig. 3.8.4 of hospital length of stay (in days)? Fig. 3.8.4 20- 10 10 20 30 40 Days
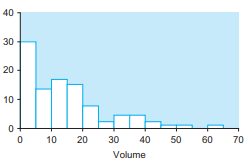
What distribution shape is represented by the histogram in Fig. 3.8.3 of volume (in thousands of units) by sales region?Fig. 3.8.3 40 30 20 10 10 20 30 40 50 60 70 Volume
What distribution shape is represented by the histogram in Fig. 3.8.2 of profit margins for consumer products? Figure 3.8.2 50 40 30 20 10 20 10 15 25 30 Percent
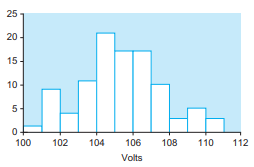
What distribution shape is represented by the histogram in Fig. 3.8.1 of voltages measured for incoming components as part of a quality control program? Fig 3.8.1 25 20 15 10 5- 100 102 104 106 108 110 112 Volts
Suppose there is an outlier in your data. You plan to analyze the data twice: once with and once without the outlier. What result would you be most pleased with? Why?
When is it appropriate to set aside an outlier and analyze only the rest of the data?
What is an outlier?
Are all data sets normally distributed?
When a real data set is normally distributed, should you expect the histogram to be a perfectly smooth bell-shaped curve? Why or why not?
What is a number line?
What is a list of numbers?
As part of your firm’s loyalty system, there is a database with information about customers who have joined, including the size of their immediate family, the number of cars they own, and their income. a. Based only on this information, does this database consist of information from an
Suppose a data set includes the variable “business organization” recorded as 1 = sole proprietor, 2 = partnership, 3 = S corporation, 4 = C corporation. Is this a quantitative or qualitative variable?
The ease of assembling products is recorded using the scale 1 = very easy, 2 = easy, 3 = moderate, 4 = difficult, 5 = very difficult. Is this a quantitative, ordinal, or nominal variable?
Suppose a database includes the variable “security type” for which 1= common stock, 2 = preferred stock, 3 = bond, 4 = futures contract, and 5 = option. Is this a quantitative or qualitative variable?
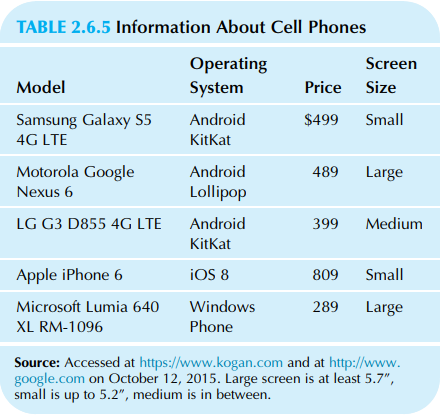
Consider the information about selected cell phones shown in Table 2.6.5. a. What is an elementary unit for this data set? b. Is this a univariate, bivariate, or multivariate data set? c. Is this a cross-sectional or time-series data set? d. Is “Operating System”
One column of a large inventory spreadsheet shows the name of the company that sold you each part. a. Is this variable quantitative or qualitative? b. Is this variable ordinal, nominal, or neither?
A quality control inspector has rated each batch produced today on a scale from A through E, where A represents the best quality and E is the worst. a. Is this variable quantitative or qualitative? b. Is this variable ordinal, nominal, or neither?
You are looking at the sales figures for 35 companies. a. Is this data set univariate, bivariate, or multivariate? b. Is this variable qualitative or quantitative? c. Is this variable ordinal, nominal, or neither?
Consider a listing of the bid price and the ask price for 18 different U.S. Treasury bonds at the close of trading on a particular day. a. Is this univariate, bivariate, or multivariate data? b. Is this cross-sectional or time-series data?
Your firm’s sales, listed each quarter for the past 5 years, should be helpful for strategic planning. a. Is this data set cross-sectional or time-series? b. Is this univariate, bivariate, or multivariate data?
In order to figure out how much of the advertising budget to spend on various types of media (TV, radio, newspapers, etc.), you are looking at a data set that lists how much each of your competitors spent last year for TV, how much they spent for radio, and how much for newspaper advertising. Give
If you think about a telephone directory as a large data set, what are the elementary units?
Classify a data set found on the Internet consisting of sales, profits, and number of employees for 100 banking firms. Be sure to provide standard information about the number of variables, who controlled the design of the data-gathering plan, and whether or not the data were recorded in a
Choose a firm and identify a database (in general terms) that would be important to it. Identify three different kinds of data sets contained within this database. For each of these three data sets, identify the elementary unit and indicate what might be learned from an appropriate analysis.
Which are simpler to analyze, time-series or cross-sectional data?
What are the qualitative data?
What can be done with multivariate data?
What can be done with multivariate data?
In what way do bivariate data represent more than just two separate univariate data sets?
What is an elementary unit?
What is a variable?
What is a data set?
While your longer-term goal is to better understand your customer base by seeing how their attitudes correlate with purchasing activity, you realize that (at the moment) the information you would need to do this is not available. Thus your immediate task is to figure out how to survey customers in
The results of the customer survey just arrived as a spreadsheet from the firm that was hired to do the research, and you are eager to understand what can be learned from these responses. Naturally you will be producing charts and summaries in order to obtain an overall impression of this new
Using data on the characteristics of houses that sold recently in a city of interest, you would like to specify the way in which features such as the size (in square feet) and number of bedrooms relate to the sale price. You are working out an equation that asserts that the sales price is given by
Your boss has asked you to take a close look at the marketing data that just came in and would like you to report back with your overall impressions of its quality and usefulness. Which main activity of statistics will you be performing?
You think that one of the machines may be broken, but you are not sure because even when it is working properly there are a few badly manufactured parts. When you analyze the rate at which defective parts are being produced to decide whether or not there has been an increase in the defect rate,
You are trying to determine the quality of the latest shipment of construction materials based on careful observation of a sample. Which basic activity of statistics will help you reach your goal?
By looking carefully at graphs of data, your marketing department has identified three distinct segments of the marketplace with different needs and price levels. Which basic activity of statistics helped you to obtain this helpful information?
Your firm has been accused of discrimination. Your defense will argue in part that the imbalance is so small that it could have happened at random and that, in fact, no discrimination exists. Which basic activity of statistics is involved?
You have collected and explored the data on Internet information requests. Before continuing on to use the data for estimation and hypothesis testing, you want to develop a framework that identifies meaningful parameters to describe relationships in the data. What basic activity of statistics is
You are wondering whom to interview, how many to interview, and how to process the results so that your questions can be answered at the lowest possible cost. Identify the basic activity of statistics involved here.
Your work group would like to estimate the size of the market for high-quality stereo components in New Orleans but cannot find any reliable data that are readily available. Which basic activity of statistics is involved initially in proceeding with this project?
Your company has been collecting detailed data for years on customer contacts, including store purchases, telephone inquiries, and Internet orders, and you would like to systematically use this resource to learn more about your customers and, ultimately, to improve sales. What is the name of the
Before you proceed with the analysis of a large accounting data set that has just been collected, your boss has asked you to take a close look at the data to check for problems and surprises and ensure its basic integrity. Identify the basic statistical activity you are performing.
If your factories produce too much, then you will have to pay to store the extra inventory. If you produce too little, then customers will be turned away and profits will be lost. Therefore, you would like to produce exactly the right amount to avoid these costs to your company. Unfortunately,
Showing 200 - 300
of 307
1
2
3
4
Step by Step Answers