New Semester
Started
Get
50% OFF
Study Help!
--h --m --s
Claim Now
Question Answers
Textbooks
Find textbooks, questions and answers
Oops, something went wrong!
Change your search query and then try again
S
Books
FREE
Study Help
Expert Questions
Accounting
General Management
Mathematics
Finance
Organizational Behaviour
Law
Physics
Operating System
Management Leadership
Sociology
Programming
Marketing
Database
Computer Network
Economics
Textbooks Solutions
Accounting
Managerial Accounting
Management Leadership
Cost Accounting
Statistics
Business Law
Corporate Finance
Finance
Economics
Auditing
Tutors
Online Tutors
Find a Tutor
Hire a Tutor
Become a Tutor
AI Tutor
AI Study Planner
NEW
Sell Books
Search
Search
Sign In
Register
study help
mathematics
practice of statistics
The Practice Of Statistics 6th Edition Daren S. Starnes, Josh Tabor - Solutions
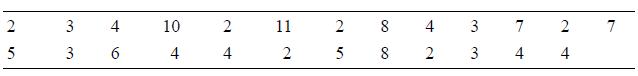
Here are data on the lengths of the first 25 words on a randomly selected page from Toni Morrison’s Song of Solomon:a. Make a dotplot of these data.b. Long words can make a book hard to read. What percentage of words in the sample have 8 or more letters? 2 4 10 11 4 7 2 7 6. 2 5 8 2 4 4 3. 3. 2.
Students in a high school statistics class responded to a survey designed by their teacher. One of the survey questions was “How much sleep did you get last night?” Here are the data (in hours):a. Make a dotplot to display the data.b. Experts recommend that high school students sleep at least 9
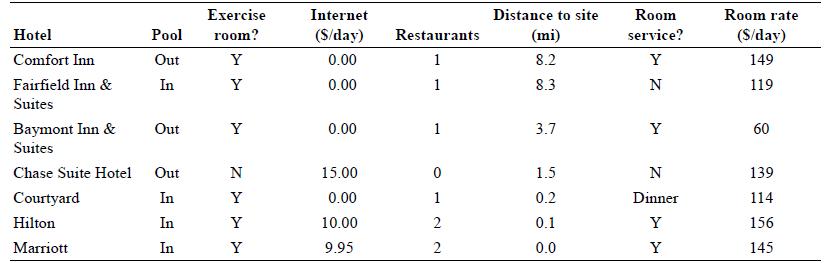
A high school lacrosse team is planning to go to Buffalo for a three-day tournament. The tournament’s sponsor provides a list of available hotels, along with some information about each hotel. The following table displays data about hotel options. Identify the individuals and variables in this
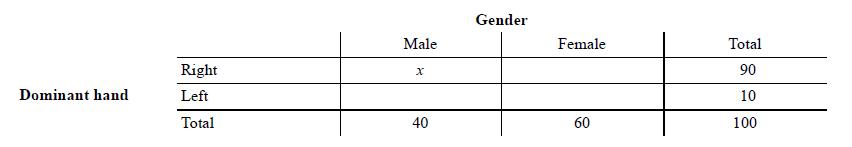
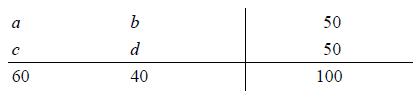
The following partially completed two-way table shows the marginal distributions of gender and handedness for a sample of 100 high school students.If there is no association between gender and handedness for the members of the sample, which of the following is the correct value of x?a. 20b. 30c.
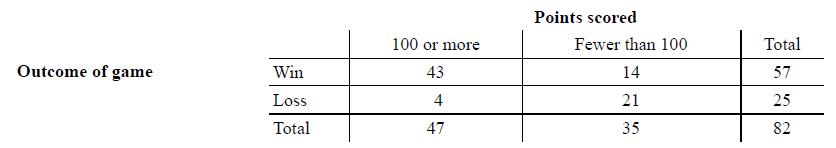
The Dallas Mavericks won the NBA championship in the 2010–2011 season. The two-way table displays the relationship between the outcome of each game in the regular season and whether the Mavericks scored at least 100 points.Which of the following is the best evidence that there is an association
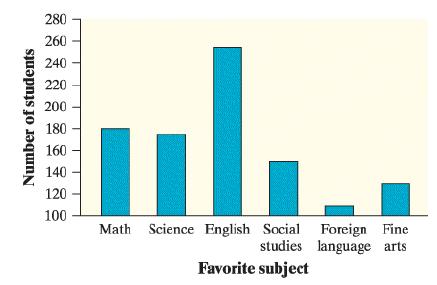
The following bar graph shows the distribution of favorite subject for a sample of 1000 students. What is the most serious problem with the graph?a. The subjects are not listed in the correct order.b. This distribution should be displayed with a pie chart.c. The vertical axis should show the
For which of the following would it be inappropriate to display the data with a single pie chart?a. The distribution of car colors for vehicles purchased in the last monthb. The distribution of unemployment percentages for each of the 50 statesc. The distribution of favorite sport for a sample of
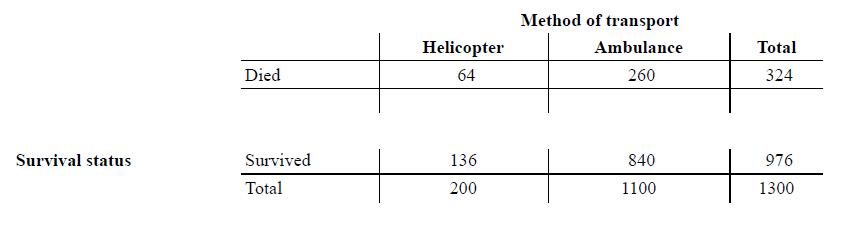
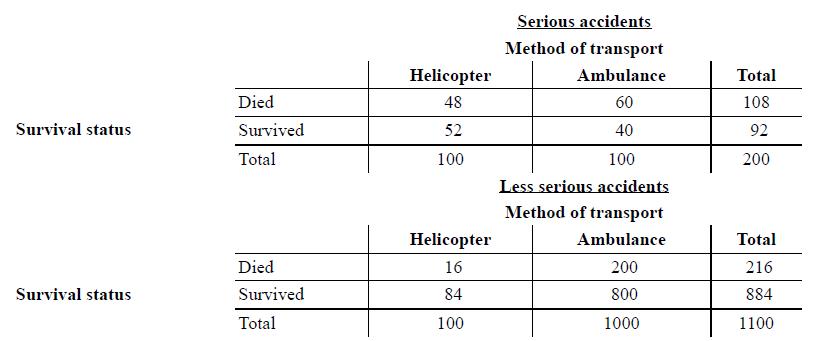
Accident victims are sometimes taken by helicopter from the accident scene to a hospital. Helicopters save time. Do they also save lives? The two-way table summarizes data from a sample of patients who were transported to the hospital by helicopter or by ambulance.a. What percent of patients died
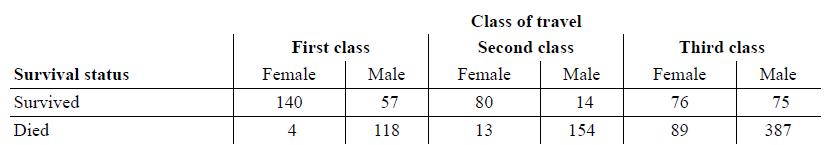
Here’s another table that summarizes data on survival status by gender and class of travel on the Titanic:a. Find the distributions of survival status for males and for females within each class of travel. Did women survive the disaster at higher rates than men? Explain.b. In an earlier example,
Here are the row and column totals for a two-way table with two rows and two columns:Find two different sets of counts a, b, c, and d for the body of the table that give these same totals. This shows that the relationship between two variables cannot be obtained from the two individual
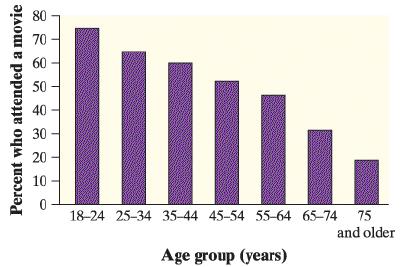
The bar graph displays data on the percent of people in several age groups who attended a movie in the past 12 months.a. Describe what the graph reveals about the relationship between age group and movie attendance.b. Would it be appropriate to make a pie chart of the data? Explain. 80 70 60 50 40
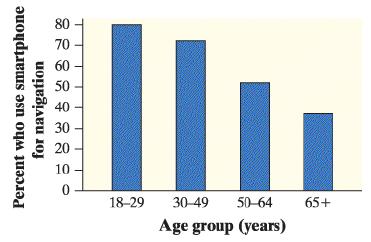
The bar graph displays data on the percent of smartphone owners in several age groups who say that they use their phone for turn-by-turn navigation.a. Describe what the graph reveals about the relationship between age group and use of smartphones for navigation.b. Would it be appropriate to make a
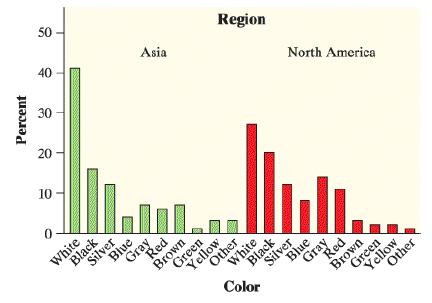
Favorite car colors may differ among countries. The side-by-side bar graph displays data on the most popular car colors in a recent year for North America and Asia. Write a few sentences comparing the distributions. 50 40 Asia Region 30 20 North America 10 White Silver Biue Black Gray Brown ..
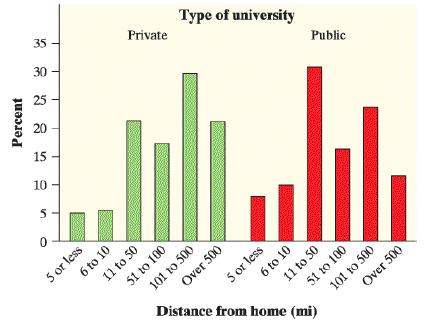
A survey asked first-year college students, “How many miles is this college from your permanent home?” Students had to choose from the following options: 5 or fewer, 6 to 10, 11 to 50, 51 to 100, 101 to 500, or more than 500. The side-by-side bar graph shows the percentage of students at public
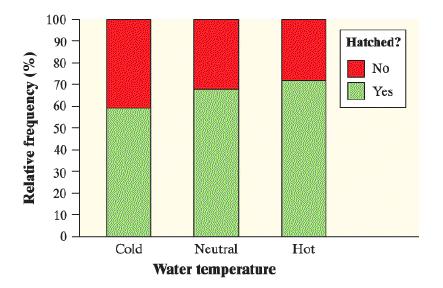
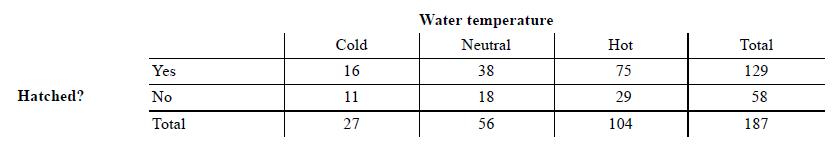
Refer to Exercise 26.a. Of the eggs that hatched, what proportion were randomly assigned to hot water?b. Of the eggs that were randomly assigned to hot water, what percent hatched?c. The segmented bar graph displays the distribution of hatching status by water temperature. Describe what this graph
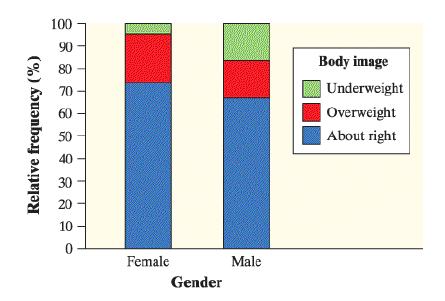
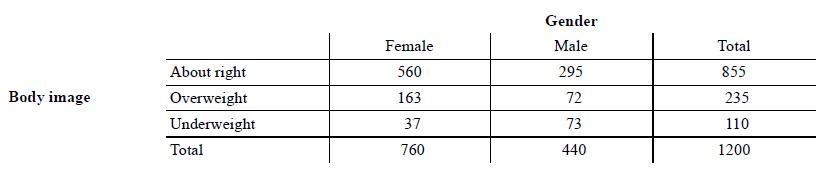
Refer to Exercise 25.a. Of the respondents who felt that their body weight was about right, what proportion were female?b. Of the female respondents, what percent felt that their body weight was about right?c. The segmented bar graph displays the distribution of perceived body image by gender.
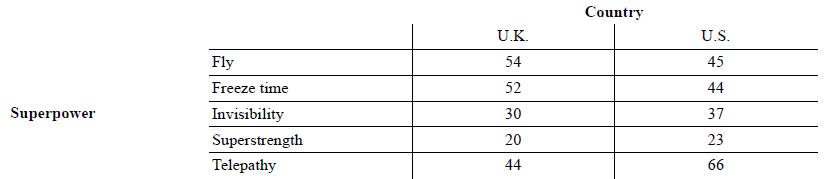
Refer to Exercise 24.a. Find the distribution of superpower preference for the students in the sample from each country (i.e., the United States and the United Kingdom). Make a segmented bar graph to compare these distributions.b. Describe what the graph in part (a) reveals about the association
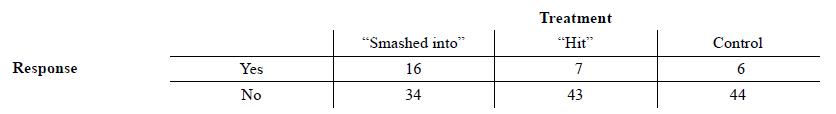
Refer to Exercise 23.a. Find the distribution of responses about whether there was broken glass at the accident for each of the three treatment groups. Make a segmented bar graph to compare these distributions.b. Describe what the graph in part (a) reveals about the association between response
Refer to Exercise 24.a. What proportion of students in the sample who prefer invisibility as their superpower are from the United States?b. What percent of students in the sample who are from the United Kingdom prefer superstrength as their superpower?Exercise 24.A total of 415 children from the
Refer to Exercise 23.a. What proportion of subjects who said they saw broken glass at the accident received the “hit” treatment?b. What percent of subjects who received the “smashed into” treatment said they did not see broken glass at the accident?Exercise 23.Researchers asked 150 subjects
How is the hatching of water python eggs influenced by the temperature of the snake’s nest? Researchers randomly assigned newly laid eggs to one of three water temperatures: hot, neutral, or cold. Hot duplicates the extra warmth provided by the mother python, and cold duplicates the absence of
A random sample of 1200 U.S. college students was asked, “What is your perception of your own body? Do you feel that you are overweight, underweight, or about right?” The two-way table summarizes the data on perceived body image by gender.a. What percent of respondents feel that their body
A total of 415 children from the United Kingdom and the United States who completed a survey in a recent year were randomly selected. Each student’s country of origin was recorded along with which superpower they would most like to have: the ability to fly, ability to freeze time, invisibility,
Researchers asked 150 subjects to recall the details of a car accident they watched on video. Fifty subjects were randomly assigned to be asked, “About how fast were the cars going when they smashed into each other?” For another 50 randomly assigned subjects, the words “smashed into” were
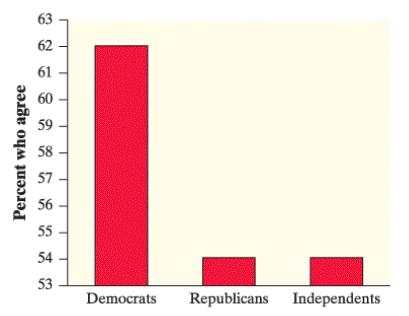
A news network reported the results of a survey about a controversial court decision. The network initially posted on its website a bar graph of the data similar to the one that follows. Explain how this graph is misleading. When notified about the misleading nature of its graph, the network posted
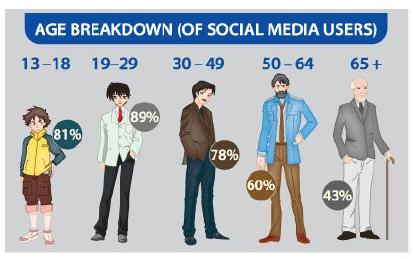
The Pew Research Center surveyed a random sample of U.S. teens and adults about their use of social media. The following pictograph displays some results. Explain how this graph is misleading. AGE BREAKDOWN (OF SOCIAL MEDIA USERS) 13-18 19-29 30 - 49 50 - 64 65 + 89% 81% 78% 60% 43%
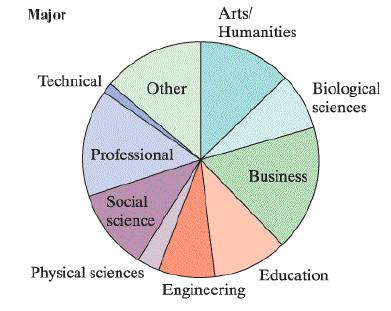
About 3 million first-year students enroll in colleges and universities each year. What do they plan to study? The pie chart displays data on the percent of first-year students who plan to major in several disciplines. About what percent of first-year students plan to major in business? In social
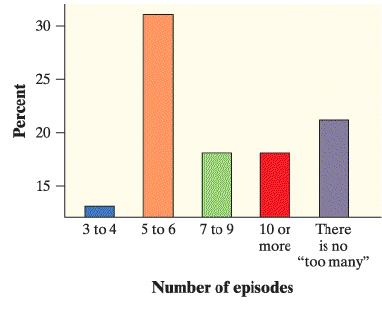
Do you “binge-watch” television series by viewing multiple episodes of a series at one sitting? A survey of 800 people who binge-watch were asked how many episodes is too many to watch in one viewing session. The results are displayed in the bar graph.13 Explain how this graph is misleading. 30
Email spam is the curse of the Internet. Here is a relative frequency table that summarizes data on the most common types of spam:Type of spam .................................. PercentAdult ................................................... 19Financial
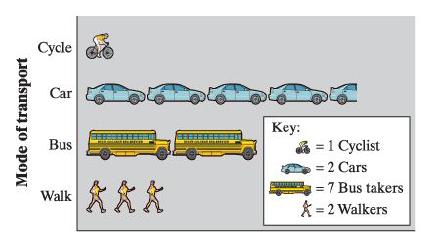
Students in a high school statistics class were given data about the main method of transportation to school for a group of 30 students. They produced the pictograph shown. Explain how this graph is misleading. Cycle Car Key: Bus =1 Cyclist = 2 Cars |大众 = 7 Bus takers Walk * = 2 Walkers Mode of
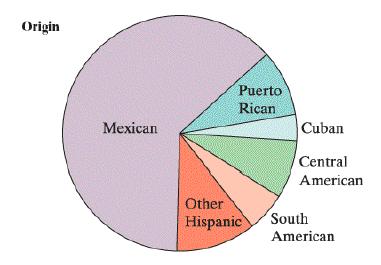
Here is a pie chart prepared by the Census Bureau to show the origin of the more than 50 million Hispanics in the United States in 2010. About what percent of Hispanics are Mexican? Puerto Rican? Origin Puerto Rican Мехican Cuban Central American Other Hispanic South American
The most popular colors for cars and light trucks change over time. Silver advanced past green in 2000 to become the most popular color worldwide, then gave way to shades of white in 2007. Here is a relative frequency table that summarizes data on the colors of vehicles sold worldwide in a recent
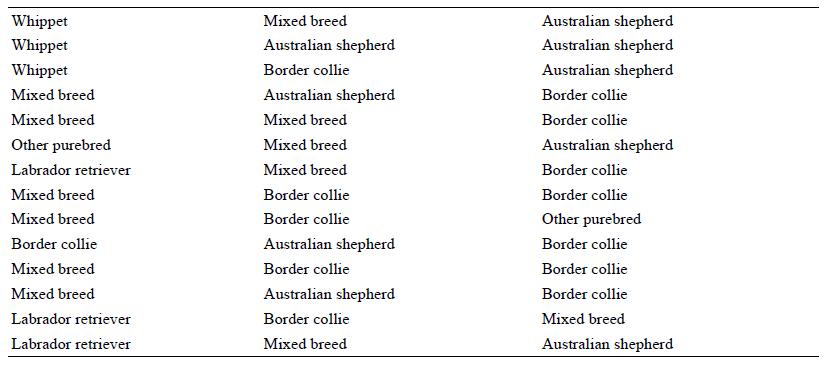
Here is a list of the breeds of dogs that won the World Canine Disc Championships from 1975 through 2016. Make a relative frequency bar graph for these data. Describe what you see. Whippet Mixed breed Australian shepherd Whippet Australian shepherd Australian shepherd Whippet Border collie
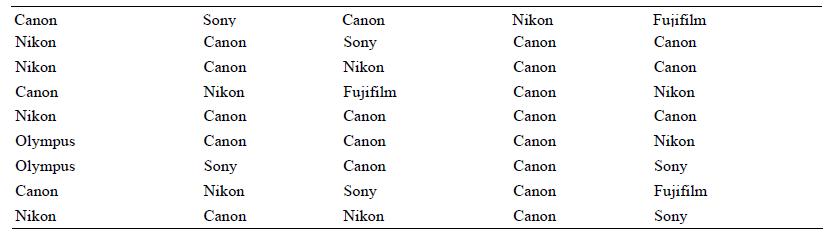
The brands of the last 45 digital single-lens reflex (SLR) cameras sold on a popular Internet auction site are listed here. Make a relative frequency bar graph for these data. Describe what you see. Canon Sony Canon Nikon Fujifilm Nikon Canon Sony Canon Canon Nikon Canon Nikon Canon Canon Canon
As of 2015, there were over 75,000 elevators in New York City. The frequency table summarizes data on the number of elevators of each type.Type ............................................... CountPassenger elevator ..................... 66,602Freight elevator .............................
The frequency table summarizes data on the numbers of babies born on each day of the week in the United States in a recent week.Day ........................................................ BirthsSunday ................................................... 7374Monday
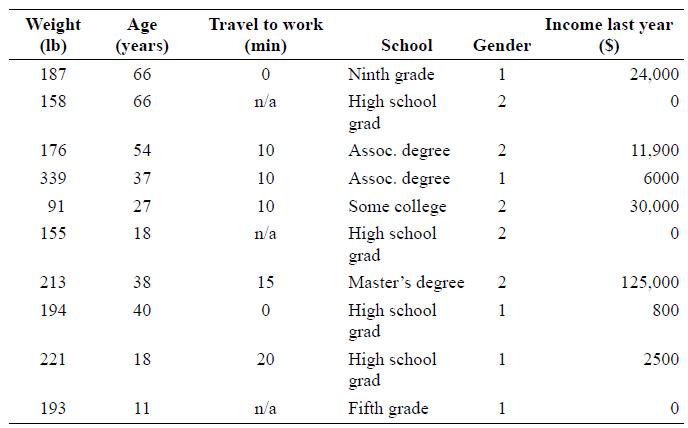
The individuals in this data set area. Households.b. People.c. Adults.d. 120 variables.e. Columns.At the Census Bureau website www.census.gov, you can view detailed data collected by the American Community Survey. The following table includes data for 10 people chosen at random from the more than 1
This data set containsa. 7 variables, 2 of which are categorical.b. 7 variables, 1 of which is categorical.c. 6 variables, 2 of which are categorical.d. 6 variables, 1 of which is categorical.e. None of these.At the Census Bureau website www.census.gov, you can view detailed data collected by the
You are preparing to study the social media habits of high school students. Describe two categorical variables and two quantitative variables that you might record for each student.
Popular magazines rank colleges and universities on their “academic quality” in serving undergraduate students. Describe two categorical variables and two quantitative variables that you might record for each institution.
Data from a medical study contain values of many variables for each subject in the study. Some of the variables recorded were gender (female or male); age (years); race (Asian, Black, White, or other); smoker (yes or no); systolic blood pressure (millimeters of mercury); level of calcium in the
What measures can be taken, especially when restoring historic wooden buildings, to help wood surfaces resist weathering? In a study of this question, researchers prepared wooden panels and then exposed them to the weather. Some of the variables recorded were type of wood (yellow poplar, pine,
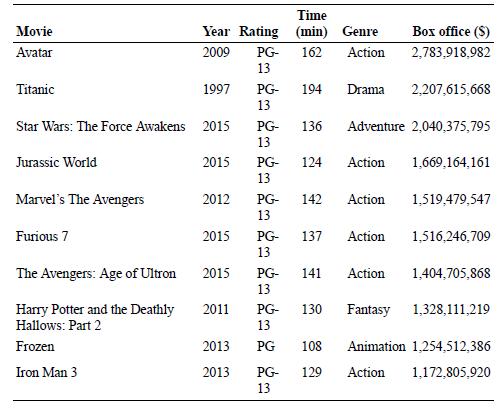
According to the Internet Movie Database, Avatar is tops based on box office receipts worldwide as of January 2017. The following table displays data on several popular movies. Identify the individuals and variables in this data set. Classify each variable as categorical or quantitative. Time Movie
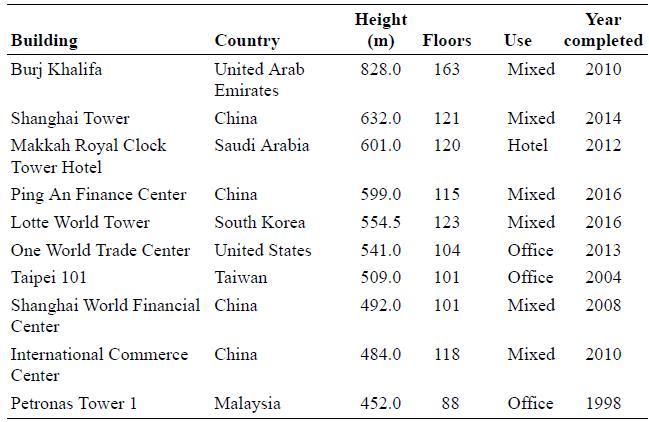
Here is some information about the tallest buildings in the world as of February 2017. Identify the individuals and variables in this data set. Classify each variable as categorical or quantitative. Height (m) Year Building Country Floors Use completed Burj Khalifa United Arab 828.0 163 Mixed 2010
Each month, the U.S. Census Bureau selects a random sample of about 300,000 U.S. households to participate in the American Community Survey (ACS). The chosen households are notified by mail and invited to complete the survey online. The Census Bureau follows up on any uncompleted surveys by phone
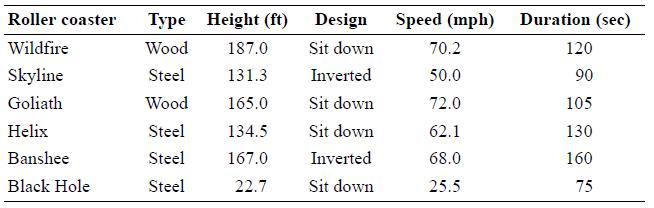
Many people like to ride roller coasters. Amusement parks try to increase attendance by building exciting new coasters. The following table displays data on several roller coasters that were opened in a recent year.a. Identify the individuals in this data set.b. What are the variables? Classify
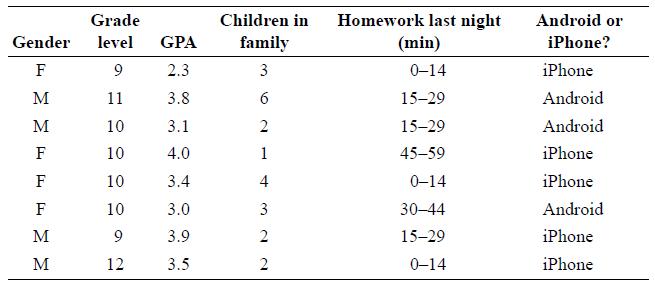
Here is a small part of the data set that describes the students in an AP® Statistics class. The data come from anonymous responses to a questionnaire filled out on the first day of class.a. Identify the individuals in this data set.b. What are the variables? Classify each as categorical or
Showing 1100 - 1200
of 1147
1
2
3
4
5
6
7
8
9
10
11
12
Step by Step Answers