New Semester
Started
Get
50% OFF
Study Help!
--h --m --s
Claim Now
Question Answers
Textbooks
Find textbooks, questions and answers
Oops, something went wrong!
Change your search query and then try again
S
Books
FREE
Study Help
Expert Questions
Accounting
General Management
Mathematics
Finance
Organizational Behaviour
Law
Physics
Operating System
Management Leadership
Sociology
Programming
Marketing
Database
Computer Network
Economics
Textbooks Solutions
Accounting
Managerial Accounting
Management Leadership
Cost Accounting
Statistics
Business Law
Corporate Finance
Finance
Economics
Auditing
Tutors
Online Tutors
Find a Tutor
Hire a Tutor
Become a Tutor
AI Tutor
AI Study Planner
NEW
Sell Books
Search
Search
Sign In
Register
study help
mathematics
practice of statistics
The Practice Of Statistics 6th Edition Daren S. Starnes, Josh Tabor - Solutions
Individuals with low bone density (osteoporosis) have a high risk of broken bones (fractures). Physicians who are concerned about low bone density in patients can refer them for specialized testing. Currently, the most common method for testing bone density is dual energy X-ray absorptiometry
Eleanor scores 680 on the SAT Mathematics test. The distribution of SAT Math scores is symmetric and single-peaked with mean 500 and standard deviation 100. Gerald takes the American College Testing (ACT) Mathematics test and scores 29. ACT scores also follow a symmetric, single-peaked
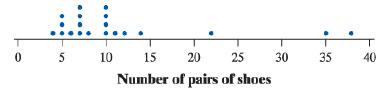
Refer to Exercise 1. Jackson, who reported owning 22 pairs of shoes, has a standardized score of z=1.10 .a. Interpret this z-score.b. The standard deviation of the distribution of number of pairs of shoes owned in this sample of 20 boys is 9.42. Use this information along with Jackson’s z-score
Refer to Exercise 17. Judy’s friend Mary also had the bone density in her hip measured using DEXA. Mary is 35 years old. Her bone density is also reported as 948 g/cm2, but her standardized score is z=0.50. The mean bone density in the hip for the reference population of 35-year-old women is 944
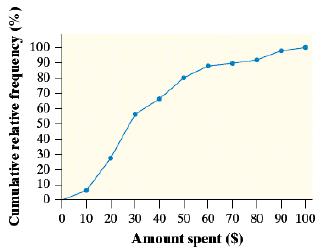
The figure is a cumulative relative frequency graph of the amount spent by 50 consecutive grocery shoppers at a store.a. Estimate the interquartile range (IQR) of this distribution. Show your method.b. What is the percentile for the shopper who spent $19.50?c. Explain why the graph is steepest
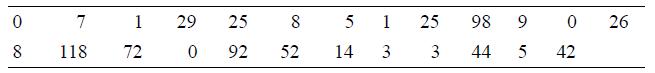
Refer to Exercise 4. Alejandro, who sent 92 texts, has a standardized score of z=1.89 .a. Interpret this z-score.b. The standard deviation of the distribution of number of text messages sent over the past 24 hours by the students in Mr. Williams’s class is 34.15. Use this information along with
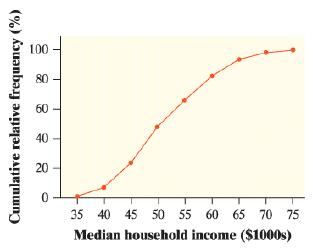
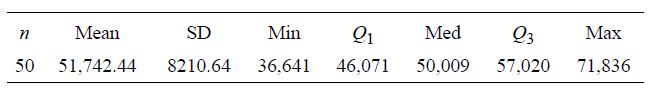
The cumulative relative frequency graph describes the distribution of median household incomes in the 50 states in a recent year.a. The median household income in North Dakota that year was $55,766. Is North Dakota an unusually wealthy state?b. Estimate and interpret the 90th percentile of the
Refer to Exercise 10. Here are summary statistics for the state median household incomes:a. Find and interpret the z-score for North Carolina, with a median household income of $41,553.b. New Jersey had a standardized score of 1.82. Find New Jersey’s median household income for that year.Exercise
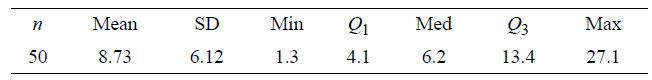
Refer to Exercise 11. Here are summary statistics for the percent of foreign-born residents in the 50 states:a. Find and interpret the z-score for Montana, which had 1.9% foreign born residents.b. New York had a standardized score of 2.10. Find the percent of foreign-born residents in New York at
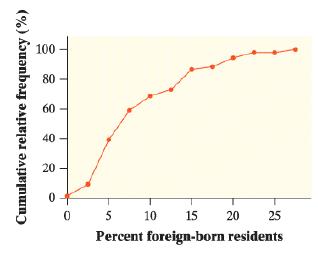
The cumulative relative frequency graph shows the distribution of the percent of foreign-born residents in the 50 states.a. Estimate the interquartile range (IQR) of this distribution. Show your method.b. What is the percentile for Arizona, which had 15.1% foreign-born residents that year?c.
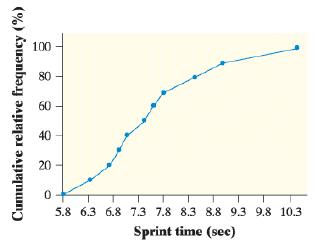
As part of a student project, high school students were asked to sprint 50 yards and their times (in seconds) were recorded. A cumulative relative frequency graph of the sprint times is shown here.a. One student ran the 50 yards in 8 seconds. Is a sprint time of 8 seconds unusually slow?b. Estimate
Peter is a star runner on the track team. In the league championship meet, Peter records a time that would fall at the 80th percentile of all his race times that season. But his performance places him at the 50th percentile in the league championship meet. Explain how this is possible. (Remember
We used an online growth chart to find percentiles for the height and weight of a 16-year-old girl who is 66 inches tall and weighs 118 pounds. According to the chart, this girl is at the 48th percentile for weight and the 78th percentile for height. Explain what these values mean in plain English.
Larry came home very excited after a visit to his doctor. He announced proudly to his wife, “My doctor says my blood pressure is at the 90th percentile among men like me. That means I’m better off than about 90% of similar men.” How should his wife, who is a statistician, respond to Larry’s
According to the Los Angeles Times, speed limits on California highways are set at the 85th percentile of vehicle speeds on those stretches of road. Explain to someone who knows little statistics what that means.
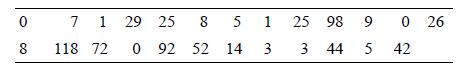
According to a study by Nielsen Mobile, “Teenagers ages 13 to 17 are by far the most prolific texters, sending 1742 messages a month.” Mr. Williams, a high school statistics teacher, was skeptical about the claims in the article. So he collected data from his first-period statistics class on
Many athletes (and their parents) worry about the risk of concussions when playing sports. A football coach plans to obtain specially made helmets for his players that are designed to reduce the chance of getting a concussion. Here are the measurements of head circumference (in inches) for the
Here is a stemplot of the percents of residents aged 65 and older in the 50 states:a. Find the percentile for Colorado, where 10.1% of the residents are aged 65 and older.b. Rhode Island is at the 80th percentile of the distribution. Interpret this value. What percent of Rhode Island’s residents
How many pairs of shoes does a typical teenage boy own? To find out, two AP® Statistics students surveyed a random sample of 20 male students from their large high school. Then they recorded the number of pairs of shoes that each boy owned. Here is a dotplot of the data:a. Find the percentile for
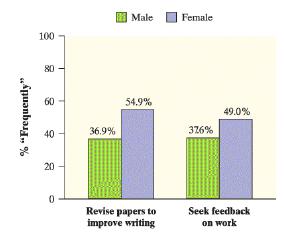
The Freshman Survey asked first-year college students about their “habits of mind”—specific behaviors that college faculty have identified as being important for student success. One question asked students, “How often in the past year did you revise your papers to improve your writing?”
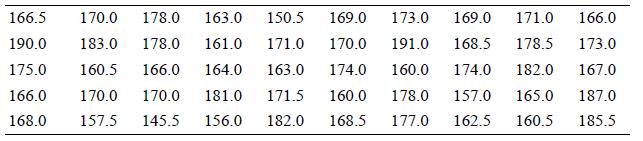
We used Census At School’s “Random Data Selector” to choose a sample of 50 Canadian students who completed a survey in a recent year. Here are the students’ heights (in centimeters):Make an appropriate graph to display these data. Describe the shape, center, and variability of the
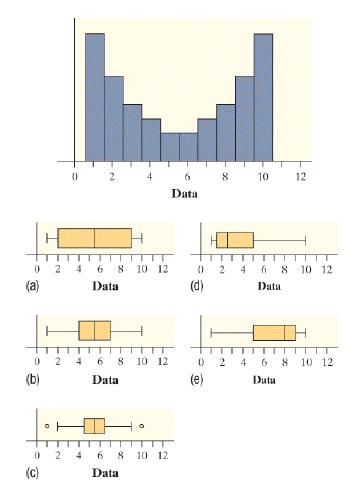
Which of the following boxplots best matches the distribution shown in the histogram? 4 10 12 Data 2 8 10 12 2. 4 8 10 12 (a) Data (d) Data 2 4 6 8 10 12 4 6 10 12 (b) Data (e) Data 0 2 6 8 10 12 (C) Data
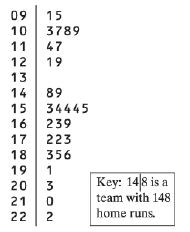
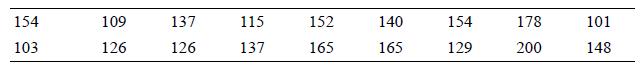
The stemplot shows the number of home runs hit by each of the 30 Major League Baseball teams in a single season. Home run totals above what value should be considered outliers?a. 173b. 210c. 222d. 229e. 257 09 15 10 11 3789 47 12 13 19 14 89 34445 15 16 239 17 223 18 19 20 356 1 Key: 148 is a team
The scores on a statistics test had a mean of 81 and a standard deviation of 9. One student was absent on the test day, and his score wasn’t included in the calculation. If his score of 84 was added to the distribution of scores, what would happen to the mean and standard deviation?a. Mean will
If a distribution is skewed to the right with no outliers, which expression is correct?a. mean < medianb. mean ≈ medianc. mean = mediand. mean > mediane. We can’t tell without examining the data.
For each of the following summary statistics, decide(i) Whether it could be used to measure center or variability(ii) Whether it is resistant.a. Q1 + Q3/2b. Max − Min/2
This is a standard deviation contest. You must choose four numbers from the whole numbers 0 to 10, with repeats allowed.a. Choose four numbers that have the smallest possible standard deviation.b. Choose four numbers that have the largest possible standard deviation.c. Is more than one choice
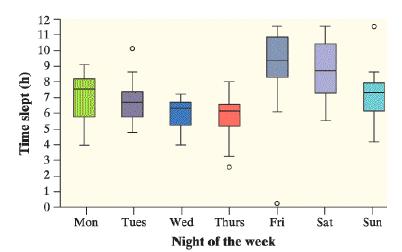
Researchers recorded data on the amount of sleep reported each night during a week by a random sample of 20 high school students. Here are parallel boxplots comparing the distribution of time slept on all 7 nights of the study:Use the graph to help answer the following questions.a. Which
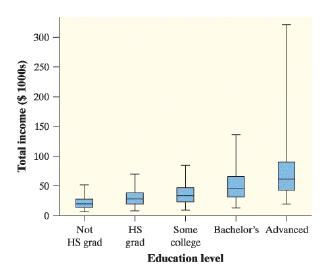
Each March, the Bureau of Labor Statistics compiles an Annual Demographic Supplement to its monthly Current Population Survey. Data on about 71,067 individuals between the ages of 25 and 64 who were employed full-time were collected in one of these surveys. The parallel boxplots compare the
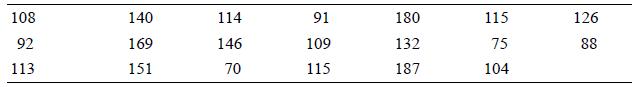
Here are the scores on the Survey of Study Habits and Attitudes (SSHA) for a random sample of 18 first-year college women:Here are the SSHA scores for a random sample of 20 first-year college men:Note that high scores indicate good study habits and attitudes toward learning.a. Make parallel
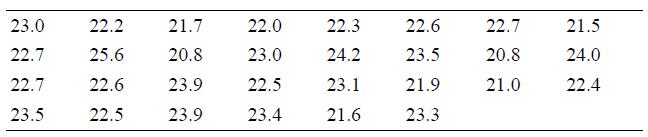
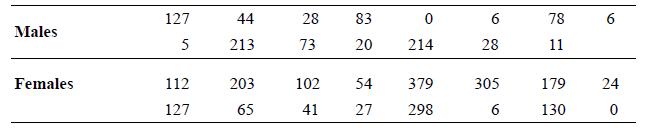
For their final project, a group of AP® Statistics students wanted to compare the texting habits of males and females. They asked a random sample of students from their school to record the number of text messages sent and received over a two-day period. Here are their data:a. Make parallel
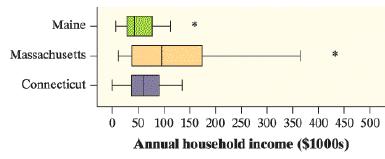
The following boxplots show the total income of 40 randomly chosen households each from Connecticut, Maine, and Massachusetts, based on U.S. Census data from the American Community Survey. Compare the distributions of annual incomes in the three states. Maine Massachusetts - Connecticut 0. 50 100
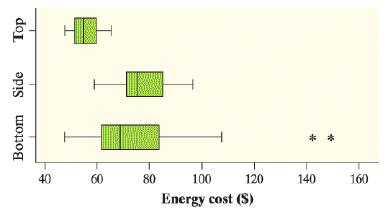
Consumer Reports magazine rated different types of refrigerators, including those with bottom freezers, those with top freezers, and those with side freezers. One of the variables they measured was annual energy cost (in dollars). The following boxplots show the energy cost distributions for each
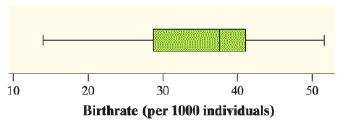
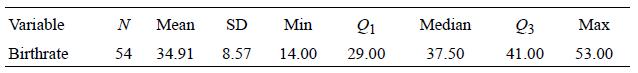
Refer to Exercise 92. Here are a boxplot and some numerical summaries of the birthrate data:a. Explain why the median and IQR would be a better choice for summarizing the center and variability of the distribution of birthrates in African countries than the mean and standard deviation.b. Identify
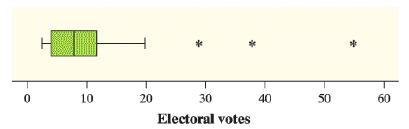
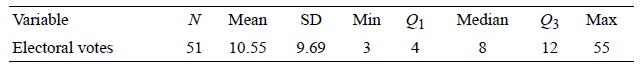
Refer to Exercise 91. Here are a boxplot and some numerical summaries of the electoral vote data:a. Explain why the median and IQR would be a better choice for summarizing the center and variability of the distribution of electoral votes than the mean and standard deviation.b. Identify an aspect of
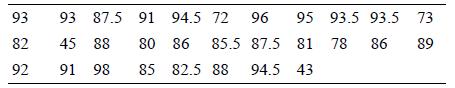
Here are the scores of Mrs. Liao’s students on their first statistics test:a. Make a boxplot of these data.b. Use the boxplot you created in part (a) to describe how the students did on Mrs. Liao’s first test. 93 93 87.5 91 94.5 72 96 95 93.5 93.5 73 82 45 88 80 86 85.5 87.5 81 78 86 89 92 91
According to a study by Nielsen Mobile, “Teenagers ages 13 to 17 are by far the most prolific texters, sending 1742 messages a month.” Mr. Williams, a high school statistics teacher, was skeptical about the claims in the article. So he collected data from his first-period statistics class on
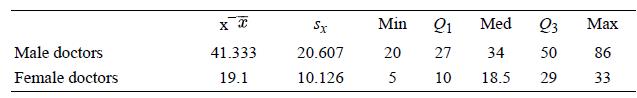
A study in Switzerland examined the number of cesarean sections (surgical deliveries of babies) performed in a year by samples of male and female doctors. Here are summary statistics for the two distributions:a. Based on the computer output, which distribution would you guess has a more symmetrical
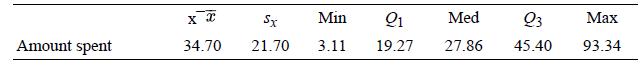
The figure displays computer output for data on the amount spent by 50 grocery shoppers.a. What would you guess is the shape of the distribution based only on the computer output? Explain.b. Interpret the value of the standard deviation.c. Are there any outliers? Justify your answer. Sx Min Med Q3
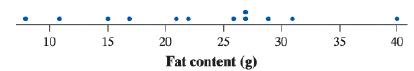
Refer to Exercises 102 and 106. Identify any outliers in the distribution. Show your work.Exercises 102 and 106.Here is a dotplot of the amount of fat (to the nearest gram) in 12 different hamburgers served at a fast-food restaurant: 10 15 20 25 30 35 40 Fat content (g)
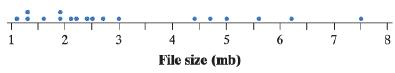
Refer to Exercises 101 and 105. Identify any outliers in the distribution. Show your work.Exercises 101 and 105.How much storage space does your music use? Here is a dotplot of the file sizes (to the nearest tenth of a megabyte) for 18 randomly selected files on Nathaniel’s mp3 player: 3 4 6. 7
Refer to Exercise 102. Find the interquartile range of the fat content distribution shown in the dotplot.Exercise 102.Here is a dotplot of the amount of fat (to the nearest gram) in 12 different hamburgers served at a fast-food restaurant: 10 15 20 25 30 35 40 Fat content (g)
Refer to Exercise 101. Find the interquartile range of the file size distribution shown in the dotplot.Exercise 101. How much storage space does your music use? Here is a dotplot of the file sizes (to the nearest tenth of a megabyte) for 18 randomly selected files on Nathaniel’s mp3 player:
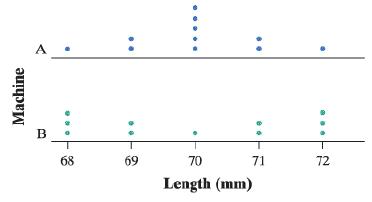
The parallel dotplots show the lengths (in millimeters) of a sample of 11 nails produced by each of two machines. Which distribution has the larger standard deviation? Justify your answer. A B 68 69 70 71 72 Length (mm) Machine
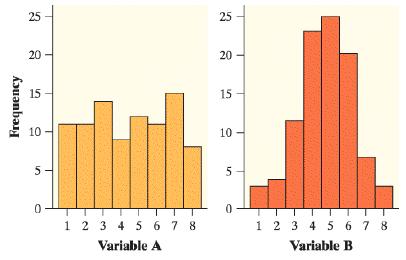
Which of the following distributions has a smaller standard deviation? Justify your answer. 25 25 20 - 20 15 15 10 10 5- 5 1 2 3 4 5 6 7 8 1 2 3 4 5 6 7 8 Variable A Variable B Frequency
Here is a dotplot of the amount of fat (to the nearest gram) in 12 different hamburgers served at a fast-food restaurant: a. The distribution of fat content has a mean of x̅ =22.83 grams and a standard deviation of sx = 9.06 grams. Interpret the standard deviation.b. Suppose the restaurant
How much storage space does your music use? Here is a dotplot of the file sizes (to the nearest tenth of a megabyte) for 18 randomly selected files on Nathaniel’s mp3 player:a. The distribution of file size has a mean of x̅ =3.2 megabytes and a standard deviation of sx = 1.9 megabytes. Interpret
A random sample of 6 students in a first-period statistics class was asked how much sleep (to the nearest hour) they got last night. Their responses were 6, 7, 7, 8, 10, and 10. Calculate the standard deviation. Interpret this value.
Here are the foot lengths (in centimeters) for a random sample of seven 14-year-olds from the United Kingdom:Calculate the standard deviation. Interpret this value. 25 22 20 25 24 24 28
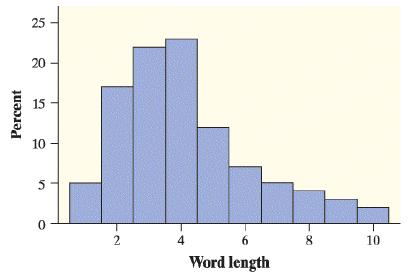
The histogram shows the distribution of lengths of words used in Shakespeare’s plays.a. Find the median word length in Shakespeare’s plays from the histogram. Explain your method clearly.b. Calculate the mean of the distribution. Show your work. 25 20 15 10 4 6. 8 10 Word length Percent 2.
Refer to Exercise 88.a. Find the range of the pulse rates for all 19 students and the range of the pulse rates excluding the student with the medical issue.b. Explain what part (a) suggests about using the range as a measure of variability for a distribution of quantitative data.Exercise 88.Here
Refer to Exercise 87.a. Find the range of Joey’s first 14 quiz grades and the range of Joey’s quiz grades after his unexcused absence.b. Explain what part (a) suggests about using the range as a measure of variability for a distribution of quantitative data.Exercise 87.Joey’s first 14 quiz
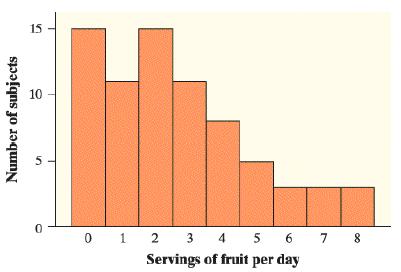
We all know that fruit is good for us. Here is a histogram of the number of servings of fruit per day claimed by 74 seventeen year-old girls in a study in Pennsylvania.a. Find the median number of servings of fruit per day from the histogram. Explain your method clearly.b. Calculate the mean of the
Last year a small accounting firm paid each of its five clerks $32,000, two junior accountants $60,000 each, and the firm’s owner $280,000.a. What is the mean salary paid at this firm? How many of the employees earn less than the mean? What is the median salary?b. Write a sentence to describe how
The mean and median selling prices of existing single-family homes sold in September 2016 were $276,200 and $234,200. Which of these numbers is the mean and which is the median? Explain your reasoning.
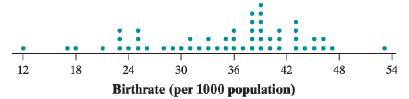
One of the important factors in determining population growth rates is the birthrate per 1000 individuals in a population. The dotplot shows the birthrates per 1000 individuals (rounded to the nearest whole number) for 54 African nations.a. Find the median.b. Without doing any calculations, explain
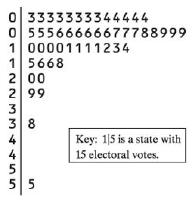
To become president of the United States, a candidate does not have to receive a majority of the popular vote. The candidate does have to win a majority of the 538 Electoral College votes. Here is a stemplot of the number of electoral votes in 2016 for each of the 50 states and the District of
Refer to Exercise 88.a. Find the median pulse rate for all 19 students.b. Find the median pulse rate excluding the student with the medical issue. Explain why this student’s 120 pulse rate does not have much effect on the median.Exercise 88.Here are data on the resting pulse rates (in beats per
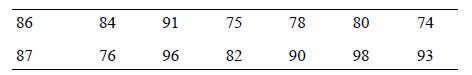
Refer to Exercise 87.a. Find the median of Joey’s first 14 quiz grades.b. Find the median of Joey’s quiz grades after his unexcused absence. Explain why the 0 quiz grade does not have much effect on the median.Exercise 87.Joey’s first 14 quiz grades in a marking period were as follows: 86 84
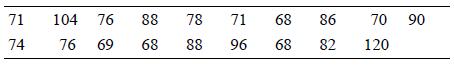
Here are data on the resting pulse rates (in beats per minute) of 19 middle school students:a. Calculate the mean. Show your work.b. The student with a 120 pulse rate has a medical issue. Find the mean pulse rate for the other 18 students. What property of the mean does this illustrate? 71 104 76
Joey’s first 14 quiz grades in a marking period were as follows:a. Calculate the mean. Show your work.b. Suppose Joey has an unexcused absence for the 15th quiz, and he receives a score of 0. Recalculate the mean. What property of the mean does this illustrate? 86 84 91 75 78 80 74 87 76 96 82 90
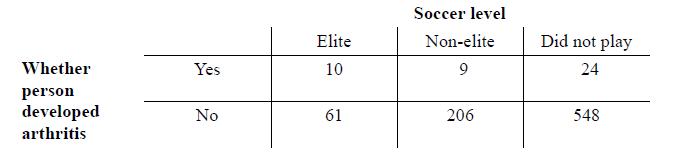
A study in Sweden looked at former elite soccer players, people who had played soccer but not at the elite level, and people of the same age who did not play soccer. Here is a two-way table that classifies these individuals by whether or not they had arthritis of the hip or knee by their
Which of the following is the best reason for choosing a stemplot rather than a histogram to display the distribution of a quantitative variable?a. Stemplots allow you to split stems; histograms don’t.b. Stemplots allow you to see the values of individual observations.c. Stemplots are better for
When comparing two distributions, it would be best to use relative frequency histograms rather than frequency histograms whena. The distributions have different shapes.b. The distributions have different amounts of variability.c. The distributions have different centers.d. The distributions have
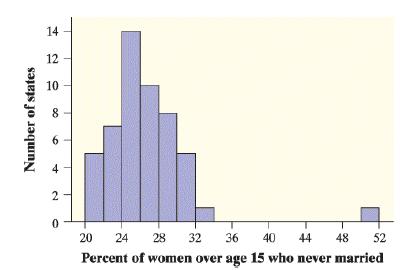
The histogram shows the distribution of the percents of women aged 15 and over who have never married in each of the 50 states and the District of Columbia. Which of the following statements about the histogram is correct?a. The center (median) of the distribution is about 36%.b. There are more
You look at real estate ads for houses in Naples, Florida. There are many houses ranging from $200,000 to $500,000 in price. The few houses on the water, however, are priced up to $15 million. The distribution of house prices will bea. Skewed to the left.b. Roughly symmetric.c. Skewed to the
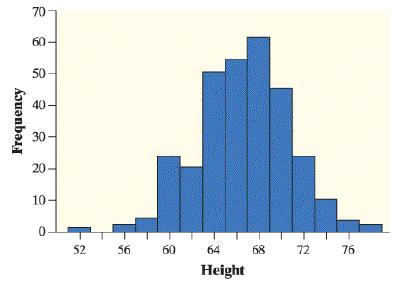
The histogram shows the heights of 300 randomly selected high school students. Which of the following is the best description of the shape of the distribution of heights?a. Roughly symmetric and single-peakedb. Roughly symmetric and double-peakedc. Roughly symmetric and multi-peakedd. Skewed to the
Here are the amounts of money (cents) in coins carried by 10 students in a statistics class: 50, 35, 0, 46, 86, 0, 5, 47, 23, 65. To make a stemplot of these data, you would use stemsa. 0, 2, 3, 4, 6, 8.b. 0, 1, 2, 3, 4, 5, 6, 7, 8.c. 0, 3, 5, 6, 7.d. 00, 10, 20, 30, 40, 50, 60, 70, 80, 90.e. None
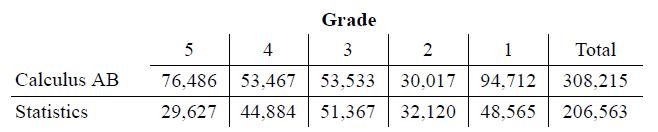
The table gives the distribution of grades earned by students taking the AP® Calculus AB and AP® Statistics exams in 2016.a. Make an appropriate graphical display to compare the grade distributions for AP® Calculus AB and AP® Statistics.b. Write a few sentences comparing the two distributions
Imagine rolling a fair, six-sided die 60 times. Draw a plausible graph of the distribution of die rolls. Should you use a bar graph or a histogram to display the data?
Imagine asking a random sample of 60 students from your school about their birth months. Draw a plausible (believable) graph of the distribution of birth months. Should you use a bar graph or a histogram to display the data?
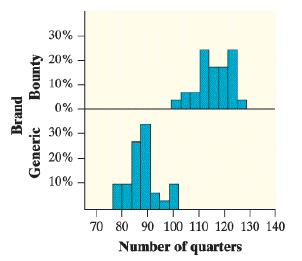
In commercials for Bounty paper towels, the manufacturer claims that they are the “quicker picker-upper,” but are they also the stronger picker-upper? Two of Mr. Tabor’s statistics students, Wesley and Maverick, decided to find out. They selected a random sample of 30 Bounty paper towels and
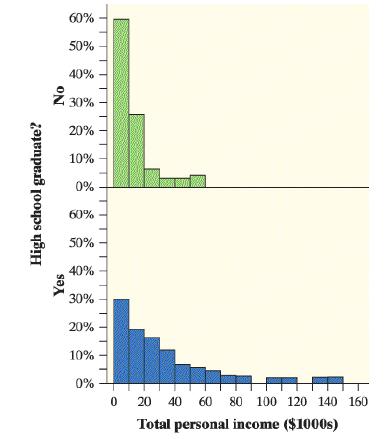
Do students who graduate from high school earn more money than students who do not? To find out, we took a random sample of 371 U.S. residents aged 18 and older. The educational level and total personal income of each person were recorded. The data for the 57 non graduates (No) and the 314
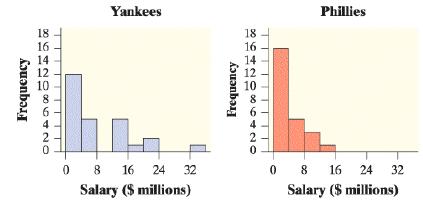
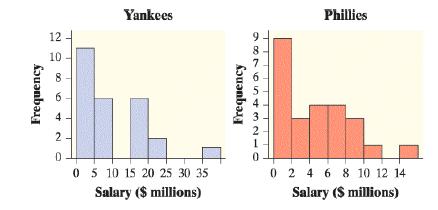
Refer to Exercise 73. Here is a better graph of the 2008 salary distributions for the Yankees and the Phillies. Write a few sentences comparing these two distributions.Exercise 73.Does paying high salaries lead to more victories in professional sports? The New York Yankees have long been known for
Does paying high salaries lead to more victories in professional sports? The New York Yankees have long been known for having Major League Baseball’s highest team payroll. And over the years, the team has won many championships. This strategy didn’t pay off in 2008, when the Philadelphia
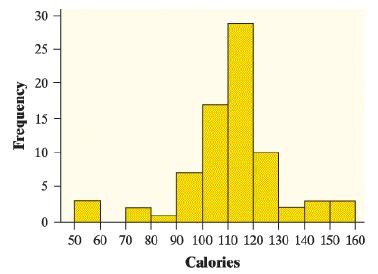
Researchers collected data on calories per serving for 77 brands of breakfast cereal. The histogram displays the data.a. Describe the overall shape of the distribution of calories.b. What is the approximate center of this distribution?c. Explain why you cannot find the exact value for the maximum
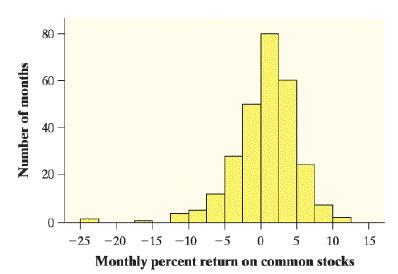
The return on a stock is the change in its market price plus any dividend payments made. Return is usually expressed as a percent of the beginning price. The figure shows a histogram of the distribution of monthly returns for the U.S. stock market over a 273-month period.a. Describe the overall
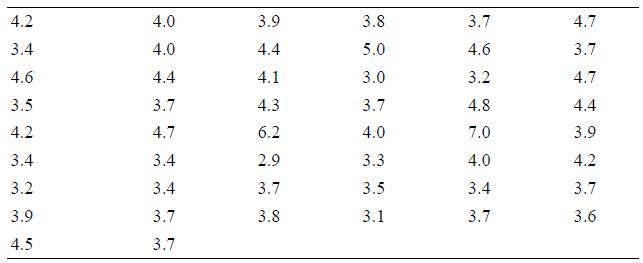
The lengths, in minutes, of the 50 most popular mp3 downloads of songs by country artist Dierks Bentley are given here.Make a histogram to display the data. Write a few sentences describing the distribution of song lengths. 4.2 4.0 3.9 3.8 3.7 4.7 3.4 4.0 4.4 5.0 4.6 3.7 4.6 4.4 4.1 3.0 3.2 4.7 3.5
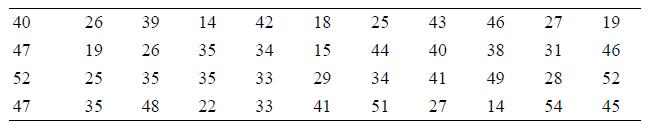
There are many ways to measure the reading ability of children. One frequently used test is the Degree of Reading Power (DRP). In a research study on third-grade students, the DRP was administered to 44 students. Their scores were as follows.Make a histogram to display the data. Write a few
How long do people travel each day to get to work? The following table gives the average travel times to work (in minutes) for workers in each state and the District of Columbia who are at least 16 years old and don’t work at
Burning fuels in power plants and motor vehicles emits carbon dioxide (CO2), which contributes to global warming. The table displays CO2 emissions per person from countries with populations of at least 20 million.30a. Make a histogram of the data using intervals of width 2, starting at 0.b.
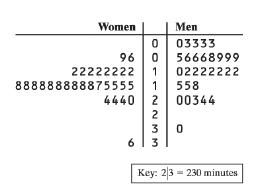
Researchers asked the students in a large first-year college class how many minutes they studied on a typical weeknight. The back-to-back stemplot displays the responses from random samples of 30 women and 30 men from the class, rounded to the nearest 10 minutes. Write a few sentences comparing the
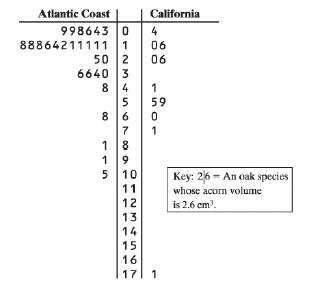
Of the many species of oak trees in the United States, 28 grow on the Atlantic Coast and 11 grow in California. The back-to-back stemplot displays data on the average volume of acorns (in cubic centimeters) for these 39 oak species.29 Write a few sentences comparing the distributions of acorn size
The U.S. Food and Drug Adminis tration (USFDA) limits the amount of caffeine in a 12-ounce can of carbonated beverage to 72 milligrams. That translates to a maximum of 48 milligrams of caffeine per 8-ounce serving. Data on the caffeine content of popular soft drinks (in milligrams per 8-ounce
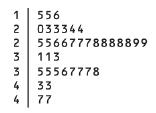
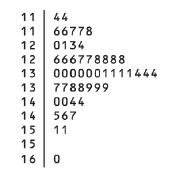
Here is a stemplot of the percent of residents aged 25 to 34 in each of the 50 states:a. Why did we split stems?b. Give an appropriate key for this stemplot.c. Describe the shape of the distribution. Are there any outliers? 11 44 11 66778 12 0134 12 666778888 13 0000001111444 13 7788999 14 0044 567
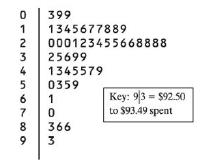
The stemplot displays data on the amount spent by 50 shoppers at a grocery store. Note that the values have been rounded to the nearest dollar.a. What was the smallest amount spent by any of the shoppers?b. Describe the distribution of amount spent by these 50 shoppers. 399 1 1345677889 2
Beans and other legumes are a great source of protein. The following data give the protein content of 30 different varieties of beans, in grams per 100 grams of cooked beans.a. Make a stemplot of these data.b. What interesting feature does the graph reveal?c. What proportion of these bean varieties
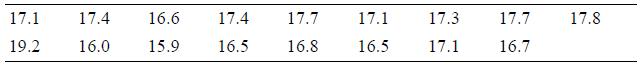
Here are the weights (in grams) of 17 Snickers Fun Size bars from a single bag:a. Make a stemplot of these data.b. What interesting feature does the graph reveal?c. The advertised weight of a Snickers Fun Size bar is 17 grams. What proportion of candy bars in this sample weigh less than advertised?
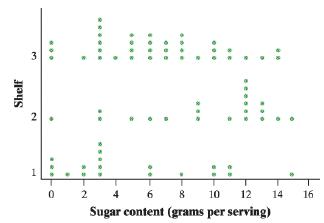
Researchers collected data on 76 brands of cereal at a local supermarket. For each brand, the sugar content (grams per serving) and the shelf in the store on which the cereal was located (1 = bottom, 2 = middle, 3 = top) were recorded. A dotplot of the data is shown here.a. Is the variability in
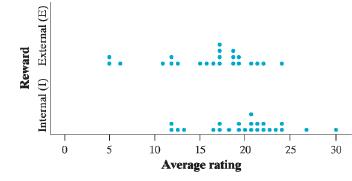
Do external rewards—things like money, praise, fame, and grades promote creativity? Researcher Teresa Amabile recruited 47 experienced creative writers who were college students and divided them at random into two groups. The students in one group were given a list of statements about external
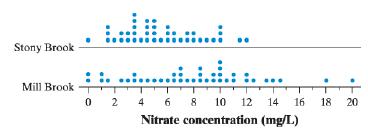
Nitrates are organic compounds that are a main ingredient in fertilizers. When those fertilizers run off into streams, the nitrates can have a toxic effect on fish. An ecologist studying nitrate pollution in two streams measures nitrate concentrations at 42 places on Stony Brook and 42 places on
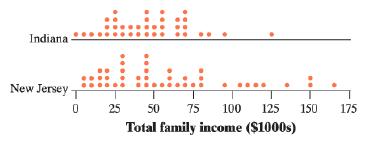
The parallel dotplots show the total family income of randomly chosen individuals from Indiana (38 individuals) and New Jersey (44 individuals). Compare the distributions of total family incomes in these two samples. Indiana New Jersey - 25 50 75 100 125 150 175 Total family income ($1000s)
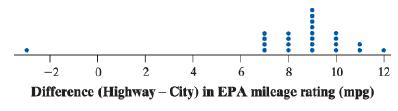
Refer to Exercise 48. Describe the distribution.Exercise 48.The dotplot shows the difference (Highway − City) in EPA mileage ratings, in miles per gallon (mpg) for each of 24 model year 2018 cars. 2 4 8 10 12 Difference (Highway - City) in EPA mileage rating (mpg) eeeee
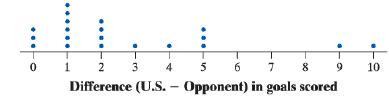
Refer to Exercise 47. Describe the distribution.Exercise 47.Earlier, we examined data on the number of goals scored by the 2016 U.S. women’s soccer team in 20 games played.The following dotplot displays the goal differential for those same games, computed as U.S. goals scored minus opponent goals
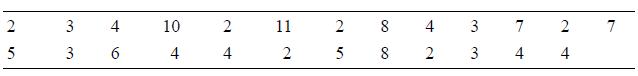
Refer to Exercise 46. Describe the shape of the distribution.Exercise 46.Here are data on the lengths of the first 25 words on a randomly selected page from Toni Morrison’s Song of Solomon: 2 4 10 11 4 7 2 7 6. 2 5 8 2 4 4 3. 3. 2. 2. 4. 4. 3. 3.
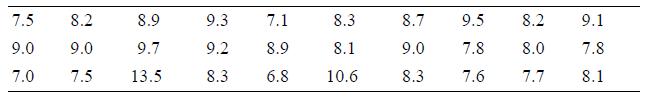
Refer to Exercise 45. Describe the shape of the distribution.Exercise 45.Students in a high school statistics class responded to a survey designed by their teacher. One of the survey questions was “How much sleep did you get last night?” Here are the data (in hours): 8 7 8 8 6.5 7 7 9.0 4 6 11
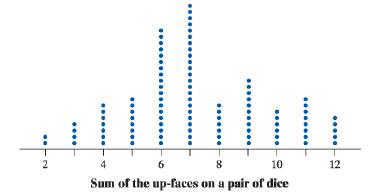
The dotplot shows the results of rolling a pair of fair, sixsided dice and finding the sum of the up-faces 100 times. Describe the shape of the distribution. 2. 6. 8 10 12 Sum of the up-faces on a pair of dice .... ..
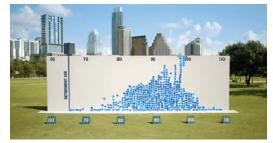
How old is the oldest person you know?Prudential Insurance Company asked 400 people to place a blue sticker on a huge wall next to the age of the oldest person they have ever known. An image of the graph is shown here. Describe the shape of the distribution.
The dotplot shows the difference (Highway − City) in EPA mileage ratings, in miles per gallon (mpg) for each of 24 model year 2018 cars.a. Explain what the dot above −3 represents.b. What does the graph tell us about fuel economy in the city versus on the highway for these car models? Be
Earlier, we examined data on the number of goals scored by the 2016 U.S. women’s soccer team in 20 games played.The following dotplot displays the goal differential for those same games, computed as U.S. goals scored minus opponent goals scored.a. Explain what the dot above 3 represents.b. What
Showing 1000 - 1100
of 1147
1
2
3
4
5
6
7
8
9
10
11
12
Step by Step Answers