New Semester
Started
Get
50% OFF
Study Help!
--h --m --s
Claim Now
Question Answers
Textbooks
Find textbooks, questions and answers
Oops, something went wrong!
Change your search query and then try again
S
Books
FREE
Study Help
Expert Questions
Accounting
General Management
Mathematics
Finance
Organizational Behaviour
Law
Physics
Operating System
Management Leadership
Sociology
Programming
Marketing
Database
Computer Network
Economics
Textbooks Solutions
Accounting
Managerial Accounting
Management Leadership
Cost Accounting
Statistics
Business Law
Corporate Finance
Finance
Economics
Auditing
Tutors
Online Tutors
Find a Tutor
Hire a Tutor
Become a Tutor
AI Tutor
AI Study Planner
NEW
Sell Books
Search
Search
Sign In
Register
study help
mathematics
practice of statistics
The Practice Of Statistics 6th Edition Daren S. Starnes, Josh Tabor - Solutions
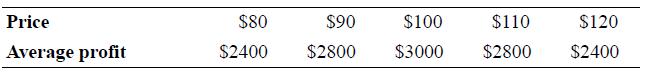
A carpenter sells handmade wooden benches at a craft fair every week. Over the past year, the carpenter has varied the price of the benches from $80 to $120 and recorded the average weekly profit he made at each selling price. The prices of the bench and the corresponding average profits are shown
Marc and Rob are both high school English teachers. Students think that Rob is a harder grader, so Rob and Marc decide to grade the same 10 essays and see how their scores compare. The correlation is r = 0.98, but Rob’s scores are always lower than Marc’s. Draw a possible scatterplot that
A college newspaper interviews a psychologist about student ratings of the teaching of faculty members. The psychologist says, “The evidence indicates that the correlation between the research productivity and teaching rating of faculty members is close to zero.” The paper reports this as
Consider each of the following relationships: the heights of fathers and the heights of their adult sons, the heights of husbands and the heights of their wives, and the heights of women at age 4 and their heights at age 18. Rank the correlations between these pairs of variables from largest to
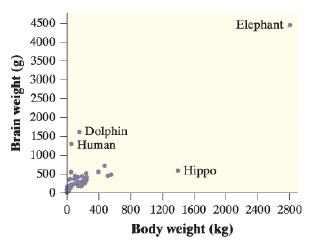
Refer to Exercise 20.a. Explain why it isn’t correct to say that the correlation is 0.86 g/kg.b. What would happen to the correlation if the variables were reversed on the scatterplot? Explain your reasoning.c. What would happen to the correlation if brain weight was measured in kilograms instead
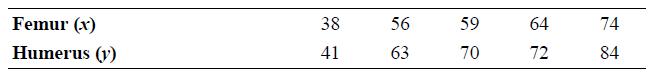
Archaeopteryx is an extinct beast that had feathers like a bird but teeth and a long bony tail like a reptile. Only six fossil specimens are known to exist today. Because these specimens differ greatly in size, some scientists think they are different species rather than individuals from the same
Refer to Exercise 19.a. Explain why it isn’t correct to say that the correlation is 0.87 mg/cal.b. What would happen to the correlation if the variables were reversed on the scatterplot? Explain your reasoning.c. What would happen to the correlation if sodium was measured in grams instead of
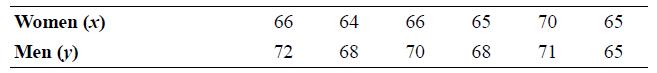
A student wonders if tall women tend to date taller men than do short women. She measures herself, her dormitory roommate, and the women in the adjoining dorm rooms. Then she measures the next man each woman dates. Here are the data (heights in inches):a. Make a scatterplot of these data. Describe
The following scatterplot plots the average brain weight (in grams) versus average body weight (in kilograms) for 96 species of mammals. There are many small mammals whose points overlap at the lower left.a. The correlation between body weight and brain weight is r = 0.86. Interpret this value.b.
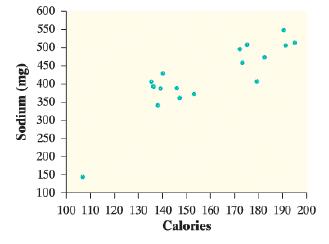
The following scatterplot shows the calories and salt content (measured in milligrams of sodium) in 17 brands of meat hot dogs.a. The correlation for these data is r = 0.87. Interpret this value.b. What effect does the hot dog brand with the smallest calorie content have on the correlation? Justify
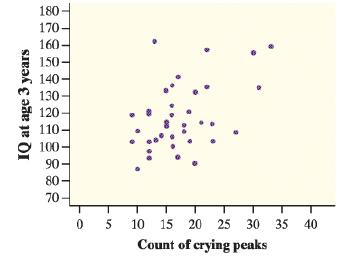
Refer to Exercise 16. Does the fact that r = 0.45 suggest that making an infant cry will increase his or her IQ later in life? Explain your reasoning.Exercise 16.Infants who cry easily may be more easily stimulated than others. This may be a sign of higher IQ. Child development researchers explored
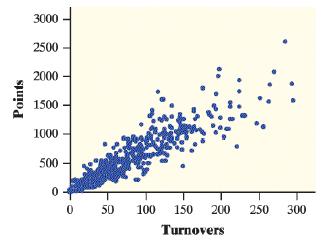
Here is a scatterplot showing the relationship between the number of turnovers and the number of points scored for players in a recent NBA season. The correlation for these data is r = 0.92. Interpret the correlation. 3000 2500 2000 1500 1000 500 50 100 150 200 250 300 Turnovers Points
Refer to Exercise 15. Does the fact that r = 0.92 suggest that an increase in turnovers will cause NBA players to score more points? Explain your reasoning.Exercise 15.Here is a scatterplot showing the relationship between the number of turnovers and the number of points scored for players in a
Infants who cry easily may be more easily stimulated than others. This may be a sign of higher IQ. Child development researchers explored the relationship between the crying of infants 4 to 10 days old and their IQ test scores at age 3 years. A snap of a rubber band on the sole of the foot caused
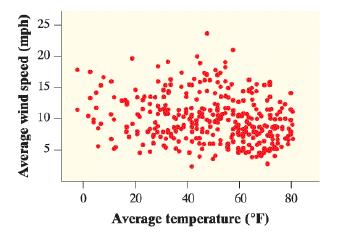
Is it possible to use temperature to predict wind speed? Here is a scatterplot showing the average temperature (in degrees Fahrenheit) and average wind speed (in miles per hour) for 365 consecutive days at O’Hare International Airport in Chicago. Is r > 0 or r < 0? Closer to r = 0 or r =
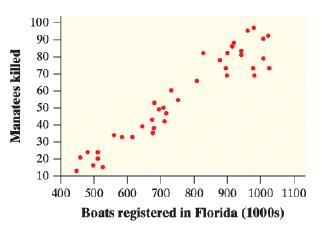
Manatees are large, gentle, slow-moving sea creatures found along the coast of Florida. Many manatees are injured or killed by boats. Here is a scatterplot showing the relationship between the number of boats registered in Florida (in thousands) and the number of manatees killed by boats for the
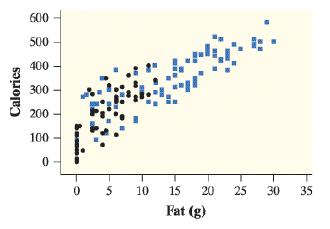
How do the nutritional characteristics of food products differ from drink products at Starbucks? The scatterplot shown here enhances the scatterplot from Exercise 6 by plotting the food products with blue squares. How are the relationships between fat and calories the same for the two types of
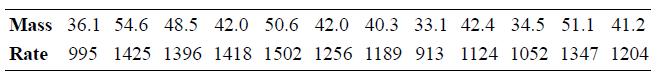
Metabolic rate, the rate at which the body consumes energy, is important in studies of weight gain, dieting, and exercise. We have data on the lean body mass and resting metabolic rate for 12 women who are subjects in a study of dieting. Lean body mass, given in kilograms, is a person’s weight
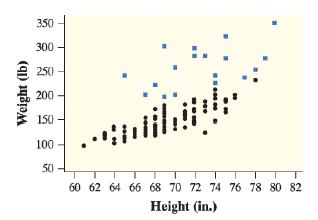
Athletes who participate in the shot put, discus throw, and hammer throw tend to have different physical characteristics than other track and field athletes. The scatterplot shown here enhances the scatterplot from Exercise 5 by plotting these athletes with blue squares. How are the relationships
Refer to your graph from Exercise 4. Describe the relationship between distance from hole and percent of putts made for the sample of professional golfers.Exercise 4.How well do professional golfers putt from various distances to the hole? The data show various distances to the hole (in feet) and
How does the fuel consumption of a car change as its speed increases? Here are data for a British Ford Escort. Speed is measured in kilometers per hour, and fuel consumption is measured in liters of gasoline used per 100 kilometers traveled.Speed (km/h) ...................... Fuel used (L/100 km)10
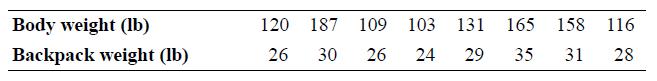
Refer to your graph from Exercise 3. Describe the relationship between body weight and backpack weight for this group of hikers.Exercise 3.Ninth-grade students at the Webb Schools go on a backpacking trip each fall. Students are divided into hiking groups of size 8 by selecting names from a hat.
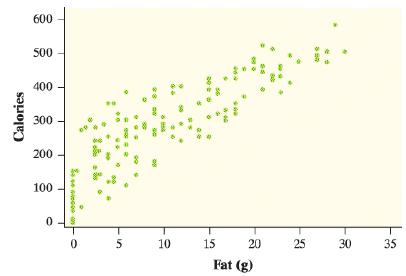
The scatterplot shows the relationship between the amount of fat (in grams) and number of calories in products sold at Starbucks. Describe the relationship between fat and calories for these products. 600 500 400 300 200 100 5 10 15 20 25 30 35 Fat (g) Calories a se eco
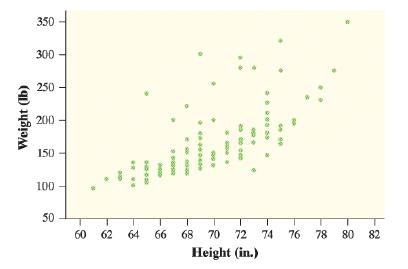
The scatterplot shows the relationship between height (in inches) and weight (in pounds) for the members of the United States 2016 Olympic Track and Field team. Describe the relationship between height and weight for these athletes. 350 300 250 200 150 100 50 60 62 64 66 68 70 72 74 76 78 80 82
How well do professional golfers putt from various distances to the hole? The data show various distances to the hole (in feet) and the percent of putts made at each distance for a sample of golfers.9 Make a scatterplot by hand that shows how the percent of putts made relates to the distance of the
Ninth-grade students at the Webb Schools go on a backpacking trip each fall. Students are divided into hiking groups of size 8 by selecting names from a hat. Before leaving, students and their backpacks are weighed. The data here are from one hiking group. Make a scatterplot by hand that shows how
Identify the explanatory variable and the response variable for the following relationships, if possible. Explain your reasoning.a. The height and arm span of a sample of 50 teenagersb. The yield of corn in bushels per acre and the amount of rain in the growing season
Identify the explanatory variable and the response variable for the following relationships, if possible. Explain your reasoning.a. The weight gain of corals in aquariums where the water temperature is controlled at different levelsb. The number of text messages sent and the number of phone calls
What is a better predictor of the number of wins for a baseball team, the number of runs scored by the team or the number of runs they allow the other team to score? What variables can we use to predict the number of runs a team scores? To predict the number of runs it allows the other team to
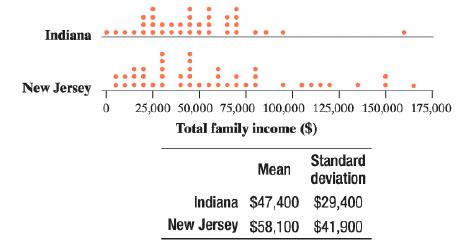
Refer to Exercise 91.a. How do the ranges of the two distributions compare? Justify your answer.b. Explain why the standard deviation of the total family incomes in the New Jersey sample is so much larger than for the Indiana sample.Exercise 91.The parallel dotplots show the total family income of
The parallel dotplots show the total family income of randomly chosen individuals from Indiana (38 individuals) and New Jersey (44 individuals). Means and standard deviations are given below the dotplots.Consider individuals in each state with total family incomes of $95,000. Which individual has a
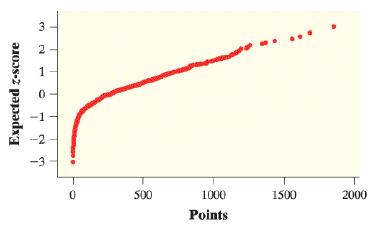
The following Normal probability plot shows the distribution of points scored for the 551 players in a single NBA season.If the distribution of points was displayed in a histogram, what would be the best description of the histogram’s shape?a. Approximately Normalb. Symmetric but not
A different species of cockroach has weights that are approximately Normally distributed with a mean of 50 grams. After measuring the weights of many of these cockroaches, a lab assistant reports that 14% of the cockroaches weigh more than 55 grams. Based on this report, what is the approximate
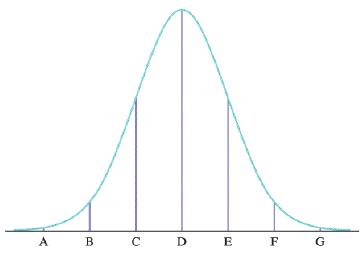
About what percent of the cockroaches have weights between 76 and 84 grams?a. 99.7%b. 95%c. 68%d. 47.5%e. 34%The weights of laboratory cockroaches can be modeled with a Normal distribution having mean 80 grams and standard deviation 2 grams. The following figure is the Normal curve for this
Point C on this Normal curve corresponds toa. 84 grams.b. 82 grams.c. 78 grams.d. 76 grams.e. 74 grams.The weights of laboratory cockroaches can be modeled with a Normal distribution having mean 80 grams and standard deviation 2 grams. The following figure is the Normal curve for this distribution
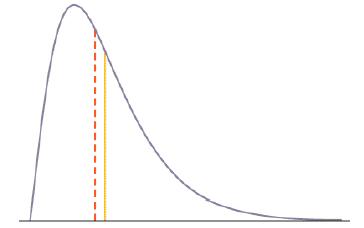
Two measures of center are marked on the density curve shown. Which of the following is correct?a. The median is at the yellow line and the mean is at the red line.b. The median is at the red line and the mean is at the yellow line.c. The mode is at the red line and the median is at the yellow
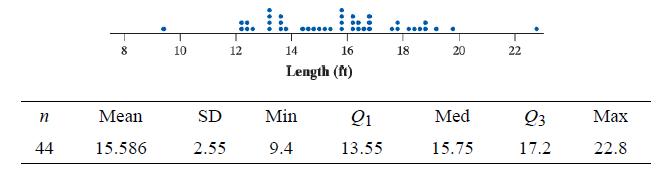
Refer to Exercise 76.a. Use your calculator to make a Normal probability plot of the data. Sketch this graph on your paper.b. What does the graph in part (a) imply about whether the distribution of shark length is approximately Normal? Explain.Exercise 76.Here are the lengths (in feet) of 44 great
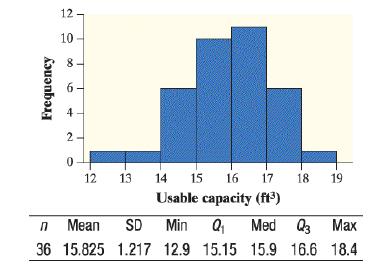
Refer to Exercise 75.a. Use your calculator to make a Normal probability plot of the data. Sketch this graph on your paper.b. What does the graph in part (a) imply about whether the distribution of refrigerator capacity is approximately Normal? Explain.Exercise 75.Consumer Reports magazine
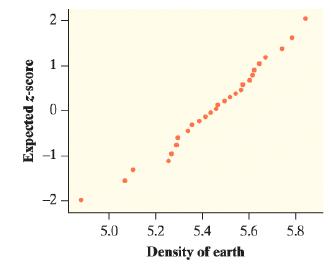
In 1798, the English scientist Henry Cavendish measured the density of the earth several times by careful work with a torsion balance. The variable recorded was the density of the earth as a multiple of the density of water. A Normal probability plot of the data is shown. Use the graph to determine
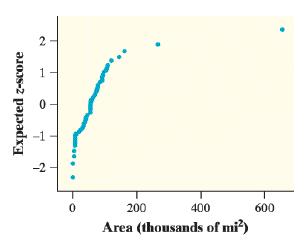
The Normal probability plot displays data on the areas (in thousands of square miles) of each of the 50 states. Use the graph to determine if the distribution of land area is approximately Normal. -2 200 400 600 Area (thousands of mi?) Expected z-score 2.
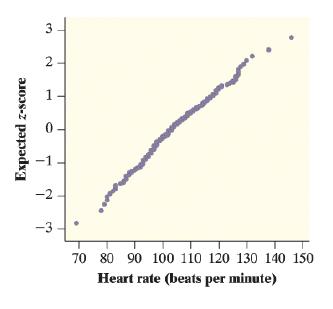
The following figure is a Normal probability plot of the heart rates of 200 male runners after 6 minutes of exercise on a treadmill. Use the graph to determine if this distribution of heart rates is approximately Normal. 3 1. -2 -3 70 80 90 100 110 120 130 140 150 Heart rate (beats per minute)
The heights of people of the same gender and similar ages follow Normal distributions reasonably closely. How about body weights? The weights of women aged 20 to 29 have mean 141.7 pounds and median 133.2 pounds. The first and third quartiles are 118.3 pounds and 157.3 pounds. Is it reasonable to
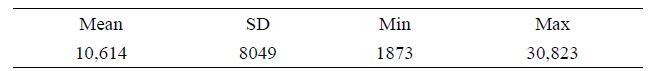
We collected data on the tuition charged by colleges and universities in Michigan. Here are some numerical summaries for the data:Based on the relationship between the mean, standard deviation, minimum, and maximum, is it reasonable to believe that the distribution of Michigan tuitions is
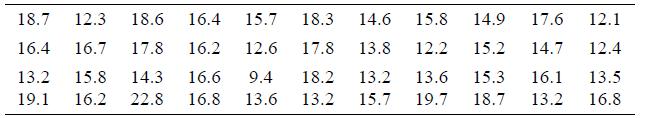
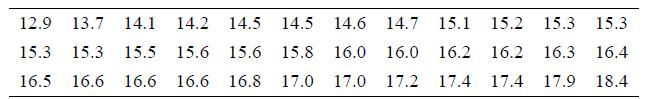
Here are the lengths (in feet) of 44 great white sharks:A dotplot of the data and summary statistics are shown below. Is this distribution of shark length approximately Normal? Justify your answer based on the graph and the 68–95–99.7 rule. 18.7 12.3 18.6 16.4 15.7 18.3 14.6 15.8 14.9 17.6 12.1
Consumer Reports magazine collected data on the usable capacity (in cubic feet) of a sample of 36 side-byside refrigerators. Here are the data:A histogram of the data and summary statistics are shown here. Is this distribution of refrigerator capacities approximately Normal? Justify your answer
The amount of time Ricardo spends brushing his teeth follows a Normal distribution with unknown mean and standard deviation. Ricardo spends less than 1 minute brushing his teeth about 40% of the time. He spends more than 2 minutes brushing his teeth 2% of the time. Use this information to determine
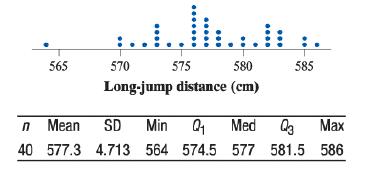
Refer to Exercise 21. Suppose that the corrected long-jump distances are converted from centimeters to meters (note that 100 cm =1 m ).a. What shape would the resulting distribution have? Explain your answer.b. Find the mean of the distribution of corrected long-jump distance in meters.c. Find the
A used-car salesman has 28 cars in his inventory, with prices ranging from $11,500 to $25,000. For a Labor Day sale, he reduces the price of each car by $500. What effect will this reduction have on each of the following characteristics of the resulting distribution of price?a. Shapeb. Mean and
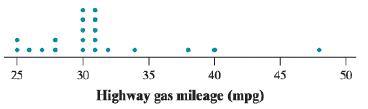
The dotplot shows the EPA highway gas mileage estimates in miles per gallon (mpg) for a random sample of 21 model year 2018 midsize cars. Explain why this distribution of highway gas mileage is not approximately Normal. 25 30 35 40 45 50 Highway gas mileage (mpg)
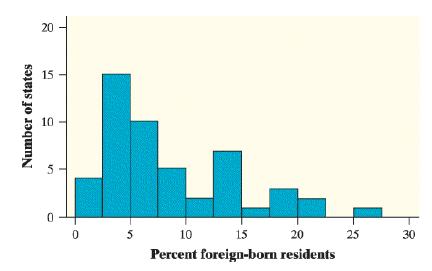
The histogram displays the percent of foreign-born residents in each of the 50 states.12 Explain why this distribution of the percent of foreign born residents in the states is not approximately Normal. 20 15 - 10 5 10 15 20 25 30 Percent foreign-born residents Number of states
An airline flies the same route at the same time each day. The flight time varies according to a Normal distribution with unknown mean and standard deviation. On 15% of days, the flight takes more than an hour. On 3% of days, the flight lasts 75 minutes or more. Use this information to determine
The supplier is considering two changes to reduce to 1% the percentage of its large-cup lids that are too small. One strategy is to adjust the mean diameter of its lids. Another option is to alter the production process, thereby decreasing the standard deviation of the lid diameters.a. If the
a. What percent of large lids are too small to fit?b. What percent of large lids are too big to fit?c. Compare your answers to parts (a) and (b). Does it make sense for the lid manufacturer to try to make one of these values larger than the other? Why or why not?At some fast-food restaurants,
A local post office weighs outgoing mail and finds that the weights of first-class letters are approximately Normally distributed with a mean of 0.69 ounce and a standard deviation of 0.16 ounce.a. Estimate the 60th percentile of first-class letter weights.b. First-class letters weighing more than
Scores on the Wechsler Adult Intelligence Scale (an IQ test) for the 20- to 34-year-old age group are approximately Normally distributed with μ = 110 and σ = 25 .a. What percent of people aged 20 to 34 have IQs between 125 and 150?b. MENSA is an elite organization that admits as members people
The percent of the observations that are classified as outliers by the 1.5 × IQR rule is the same in any Normal distribution. What is this percent? Show your method clearly.
The deciles of any distribution are the values at the 10th, 20th, … , 90th percentiles. The first and last deciles are the 10th and the 90th percentiles, respectively. What are the first and last deciles of the standard Normal distribution?
Refer to Exercise 62. Find the 85th percentile of Djokovic’s first-serve speeds.Exercise 62.Professional tennis player Novak Djokovic hits the ball extremely hard. His first-serve speeds can be modeled by a Normal distribution with mean 112 miles per hour (mph) and standard deviation 5 mph.
Refer to Exercise 61. Find the 20th percentile of Mrs. Starnes’s Sudoku times for easy puzzles.Exercise 61.Mrs. Starnes enjoys doing Sudoku puzzles. The time she takes to complete an easy puzzle can be modeled by a Normal distribution with mean 5.3 minutes and standard deviation 0.9 minute.
Professional tennis player Novak Djokovic hits the ball extremely hard. His first-serve speeds can be modeled by a Normal distribution with mean 112 miles per hour (mph) and standard deviation 5 mph.a. How often does Djokovic hit his first serve faster than 120 mph?b. What percent of Djokovic’s
Mrs. Starnes enjoys doing Sudoku puzzles. The time she takes to complete an easy puzzle can be modeled by a Normal distribution with mean 5.3 minutes and standard deviation 0.9 minute.a. What proportion of the time does Mrs. Starnes finish an easy Sudoku puzzle in less than 3 minutes?b. How often
Find the proportion of observations in a standard Normal distribution that satisfies each of the following statements.a. z < −2.46b. 0.89 < z < 2.46
Find the proportion of observations in a standard Normal distribution that satisfies each of the following statements.a. z > −1.66b. −1.66 < z < 2.85
Refer to Exercise 56. According to the same health information website, a diastolic blood pressure between 80 and 90 indicates borderline high blood pressure. About what percent of adults have borderline high blood pressure?Exercise 56.According to a health information website, the distribution of
Refer to Exercise 55. About what percent of the meals ordered contained between 1200 mg and 1800 mg of sodium?Exercise 55.A study investigated about 3000 meals ordered from Chipotle restaurants using the online site Grubhub. Researchers calculated the sodium content (in milligrams) for each order
According to a health information website, the distribution of adults’ diastolic blood pressure (in millimeters of mercury) can be modeled by a Normal distribution with mean 70 and standard deviation 20. A diastolic pressure above 100 for an adult is classified as very high blood pressure. About
A study investigated about 3000 meals ordered from Chipotle restaurants using the online site Grubhub. Researchers calculated the sodium content (in milligrams) for each order based on Chipotle’s published nutrition information. The distribution of sodium content is approximately Normal with mean
Refer to Exercise 48. A player with a batting average below 0.200 is at risk of sitting on the bench during important games. About what percent of players are at risk?Exercise 48.In baseball, a player’s batting average is the proportion of times the player gets a hit out of his total number of
Refer to Exercise 47. About what percent of 9-ounce bags of this brand of potato chips weigh less than the advertised 9 ounces? Is this likely to pose a problem for the company that produces these chips?Exercise 47.The weights of 9-ounce bags of a particular brand of potato chips can be modeled by
Refer to Exercise 48. Use the 68–95–99.7 rule to answer the following questions.a. About what percent of Major League Baseball players with 100 plate appearances had batting averages of 0.363 or higher? Show your method clearly.b. A player with a batting average of 0.227 is at about what
Refer to Exercise 47. Use the 68–95–99.7 rule to answer the following questions.a. About what percent of bags weigh less than 9.02 ounces? Show your method clearly.b. A bag that weighs 9.07 ounces is at about what percentile in this distribution? Justify your answer.Exercise 47.The weights of
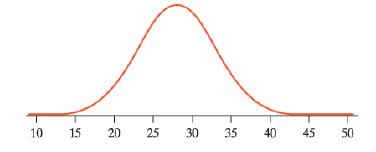
Estimate the mean and standard deviation of the Normal density curve below. 10 15 20 25 30 35 40 45 50
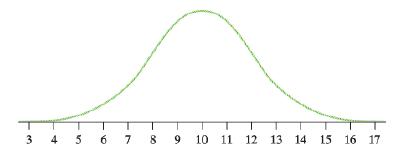
Estimate the mean and standard deviation of the Normal density curve below. 3 4 5 6 7 8 9 10 11 12 13 14 15 16 17
In baseball, a player’s batting average is the proportion of times the player gets a hit out of his total number of times at bat. The distribution of batting averages in a recent season for Major League Baseball players with at least 100 plate appearances can be modeled by a Normal distribution
The weights of 9-ounce bags of a particular brand of potato chips can be modeled by a Normal distribution with mean μ = 9.12 ounces and standard deviation σ = 0.05 ounce . Sketch the Normal density curve. Label the mean and the points that are 1, 2, and 3 standard deviations from the mean.
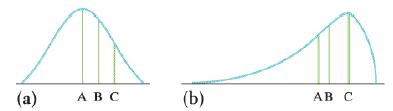
The figure displays two density curves that model different distributions of quantitative data. Identify the location of the mean and median by letter for each graph. Justify your answers. (а) ABC (b) AB C
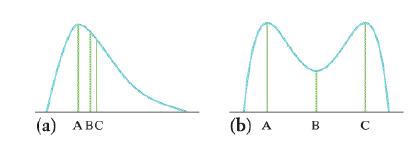
The figure displays two density curves that model different distributions of quantitative data. Identify the location of the mean and median by letter for each graph. Justify your answers. (а) (b) в с АВС A B
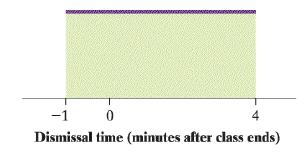
Mr. Shrager does not always let his statistics class out on time. In fact, he seems to end class according to his own “internal clock.” The density curve models the distribution of the amount of time after class ends (in minutes) when Mr. Shrager dismisses the class. (A negative value indicates
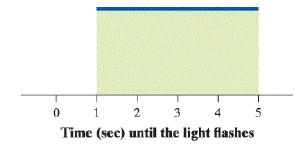
An Internet reaction time test asks subjects to click their mouse button as soon as a light flashes on the screen. The light is programmed to go on at a randomly selected time after the subject clicks “Start.” The density curve models the amount of time the subject has to wait for the light to
How does your web browser get a file from the Internet? Your computer sends a request for the file to a web server, and the web server sends back a response. For one particular web server, the time (in seconds) after the start of an hour at which a request is received can be modeled by a uniform
Where’s the bus? Sally takes the same bus to work every morning. The amount of time (in minutes) that she has to wait for the bus can be modeled by a uniform distribution on the interval from 0 minutes to 10 minutes.a. Draw a density curve to model the amount of time that Sally has to wait for
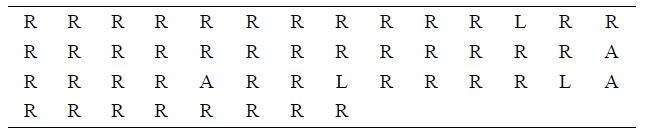
Students were asked, “Are you right-handed, lefthanded, or ambidextrous?” The responses (R=right-handed, L = lefthanded, A = ambidextrous.a. Make an appropriate graph to display these data.b. Over 10,000 Canadian high school students took the Census At School survey that year. What percent of
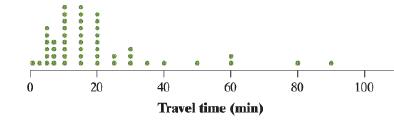
The dotplot displays data on students’ responses to the question “How long does it usually take you to travel to school?” Describe the distribution.We used Census At School’s Random Data Selector to choose a sample of 50 Canadian students who completed a survey in a recent year. :.. 20 40
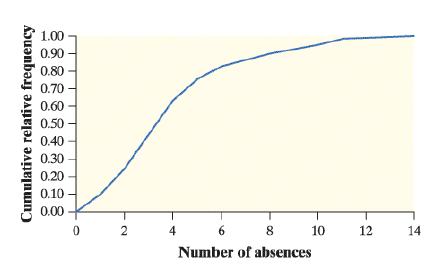
If the distribution of absences was displayed in a histogram, what would be the best description of the histogram’s shape?a. Symmetricb. Uniformc. Skewed leftd. Skewed righte. Cannot be determinedThe number of absences during the fall semester was recorded for each student in a large elementary
What is the interquartile range (IQR) for the distribution of absences?a. 1b. 2c. 3d. 5e. 14The number of absences during the fall semester was recorded for each student in a large elementary school. The distribution of absences is displayed in the following cumulative relative frequency
George’s average bowling score is 180; he bowls in a league where the average for all bowlers is 150 and the standard deviation is 20. Bill’s average bowling score is 190; he bowls in a league where the average is 160 and the standard deviation is 15. Who ranks higher in his own league, George
Scores on the ACT college entrance exam follow a bell-shaped distribution with mean 21 and standard deviation 5. Wayne’s standardized score on the ACT was −0.6. What was Wayne’s actual ACT score?a. 3b. 13c. 16d. 18e. 24Select the best answer.
When Sam goes to a restaurant, he always tips the server $2 plus 10% of the cost of the meal. If Sam’s distribution of meal costs has a mean of $9 and a standard deviation of $3, what are the mean and standard deviation of his tip distribution?a. $2.90, $0.30b. $2.90, $2.30c. $9.00, $3.00d.
Jorge’s score on Exam 1 in his statistics class was at the 64th percentile of the scores for all students. His score fallsa. Between the minimum and the first quartile.b. Between the first quartile and the median.c. Between the median and the third quartile.d. Between the third quartile and the
The scores on Ms. Martin’s statistics quiz had a mean of 12 and a standard deviation of 3. Ms. Martin wants to transform the scores to have a mean of 75 and a standard deviation of 12. What transformations should she apply to each test score? Explain your answer.
In 2016, taxicabs in Los Angeles charged an initial fee of $2.85 plus $2.70 per mile. In equation form, Fare Fare = 2.85 + 2.7(miles). At the end of a month, a businessman collects all his taxicab receipts and calculates some numerical summaries. The mean fare he paid was $15.45 with a standard
Clarence measures the diameter of each tennis ball in a bag with a standard ruler. Unfortunately, he uses the ruler incorrectly so that each of his measurements is 0.2 inch too large. Clarence’s data had a mean of 3.2 inches and a standard deviation of 0.1 inch. (Recall that 1 in. = 2.54 cm.)a.
Coach Ferguson uses a thermometer to measure the temperature (in degrees Fahrenheit) at 20 different locations in the school swimming pool. An analysis of the data yields a mean of 77°F and a standard deviation of 3°F. (Recall that °C = 59 °F−1609.a. Find the mean temperature reading in
Refer to Exercise 24. Suppose each car’s price is reduced by 10% instead of $500. What effect will this discount have on each of the following characteristics of the resulting price distribution?a. Shapeb. Medianc. Interquartile range (IQR)Exercise 24.A used-car salesman has 28 cars in his
Refer to Exercise 23. Suppose each teacher receives a 5% raise instead of a $1000 raise. What effect will this raise have on each of the following characteristics of the resulting salary distribution?a. Shapeb. Medianc. Interquartile range (IQR)Exercise 23.A school system employs teachers at
Refer to Exercise 22. Suppose that the distances from the tops of the students’ heads to the ground are converted from inches to feet (note that 12 in.=1 ft).a. What shape would the resulting distribution have? Explain your answer.b. Find the mean of the distribution of distance in feet.c. Find
A school system employs teachers at salaries between $38,000 and $70,000. The teachers’ union and school board are negotiating the form of next year’s increase in the salary schedule. Suppose that every teacher is given a $1000 raise. What effect will this raise have on each of the following
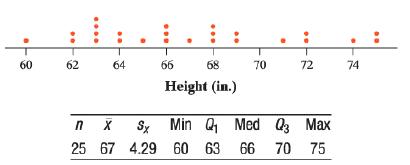
A dotplot of the distribution of height for Mrs. Navard’s class is shown, along with some numerical summaries of the data.Suppose that Mrs. Navard has the entire class stand on a 6-inch-high platform and then asks the students to measure the distance from the top of their heads to the ground.a.
A member of a track team was practicing the long jump and recorded the distances (in centimeters) shown in the dotplot. Some numerical summaries of the data are also provided.After chatting with a teammate, the jumper realized that he measured his jumps from the back of the board instead of the
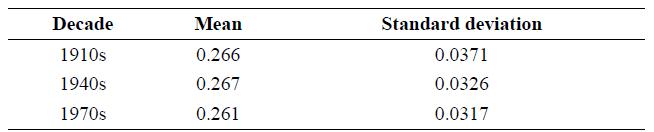
Three landmarks of baseball achievement are Ty Cobb’s batting average of 0.420 in 1911, Ted Williams’s 0.406 in 1941, and George Brett’s 0.390 in 1980. These batting averages cannot be compared directly because the distribution of major league batting averages has changed over the years. The
Showing 900 - 1000
of 1147
1
2
3
4
5
6
7
8
9
10
11
12
Step by Step Answers